This indicator measures the share of the male labor force ages 15–24 that is without work, available for work, and seeking employment. The denominator is therefore the male youth labor force, not the entire male population in that age group. Young men who are studying, caring for family members, unable to work, serving in institutions, or otherwise outside the labor force may not be part of the denominator. Among the 103 countries and economies with a 2024 national estimate, the median rate was 13.44%, while reported values ranged from 0.26% in Qatar to 56.99% in South Africa.
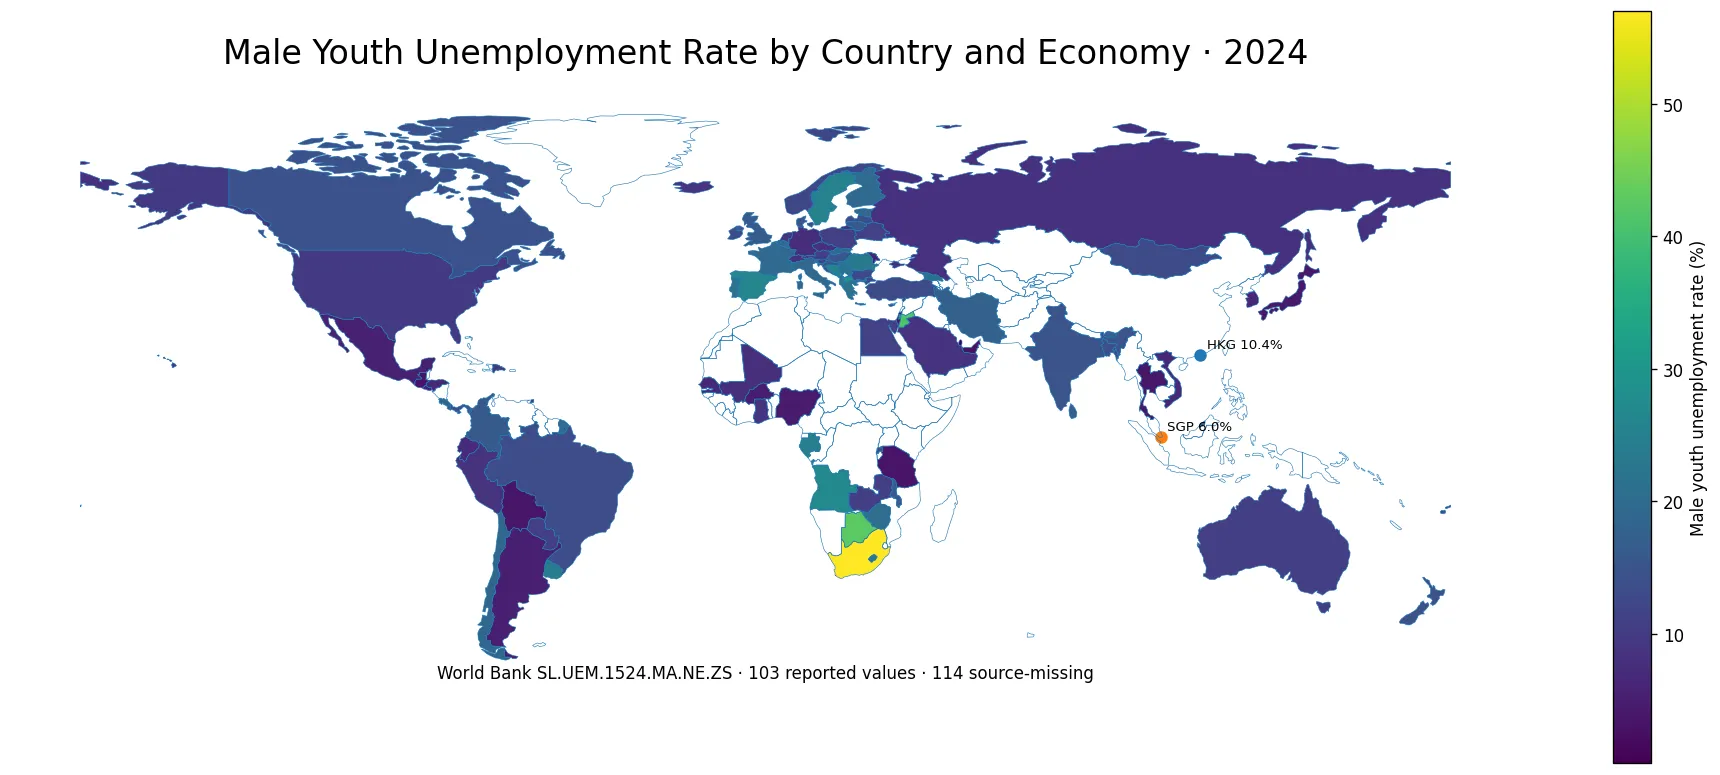
Table of Contents
What the male youth unemployment rate measures
The World Bank indicator code is SL.UEM.1524.MA.NE.ZS. The phrase national estimate matters because the series reflects official national estimates rather than a single harmonized model applied uniformly to every economy. That makes it valuable for understanding official labor-market statistics, but it also means definitions of unemployment and the labor force can differ across countries. Youth labor markets are especially sensitive to school-to-work transitions, temporary jobs, first-job search, and economic cycles, so youth unemployment can move quite differently from total unemployment.
Only 103 economies reported a 2024 value
Of the 217 countries and economies represented in the geographic frame, 103 had a reported 2024 value and 114 did not. That coverage gap is a major part of the interpretation. A blank area on the map does not represent a zero unemployment rate, and the rankings apply only to economies with a reported value. Replacing missing observations with zero would mix genuinely low unemployment with missing information and would distort both the map and summary statistics.
Across the 103 reported values, the mean was 14.77% and the median was 13.44%. The first quartile was about 8.41% and the third quartile about 19.26%, placing roughly half of reporting economies within that interval. Twenty-two economies had rates of at least 20%, and four were at or above 30%. Ten had rates below 5%. The mean being somewhat higher than the median reflects the influence of a relatively small group of very high reported values.
South Africa had the highest reported rate at 56.99%
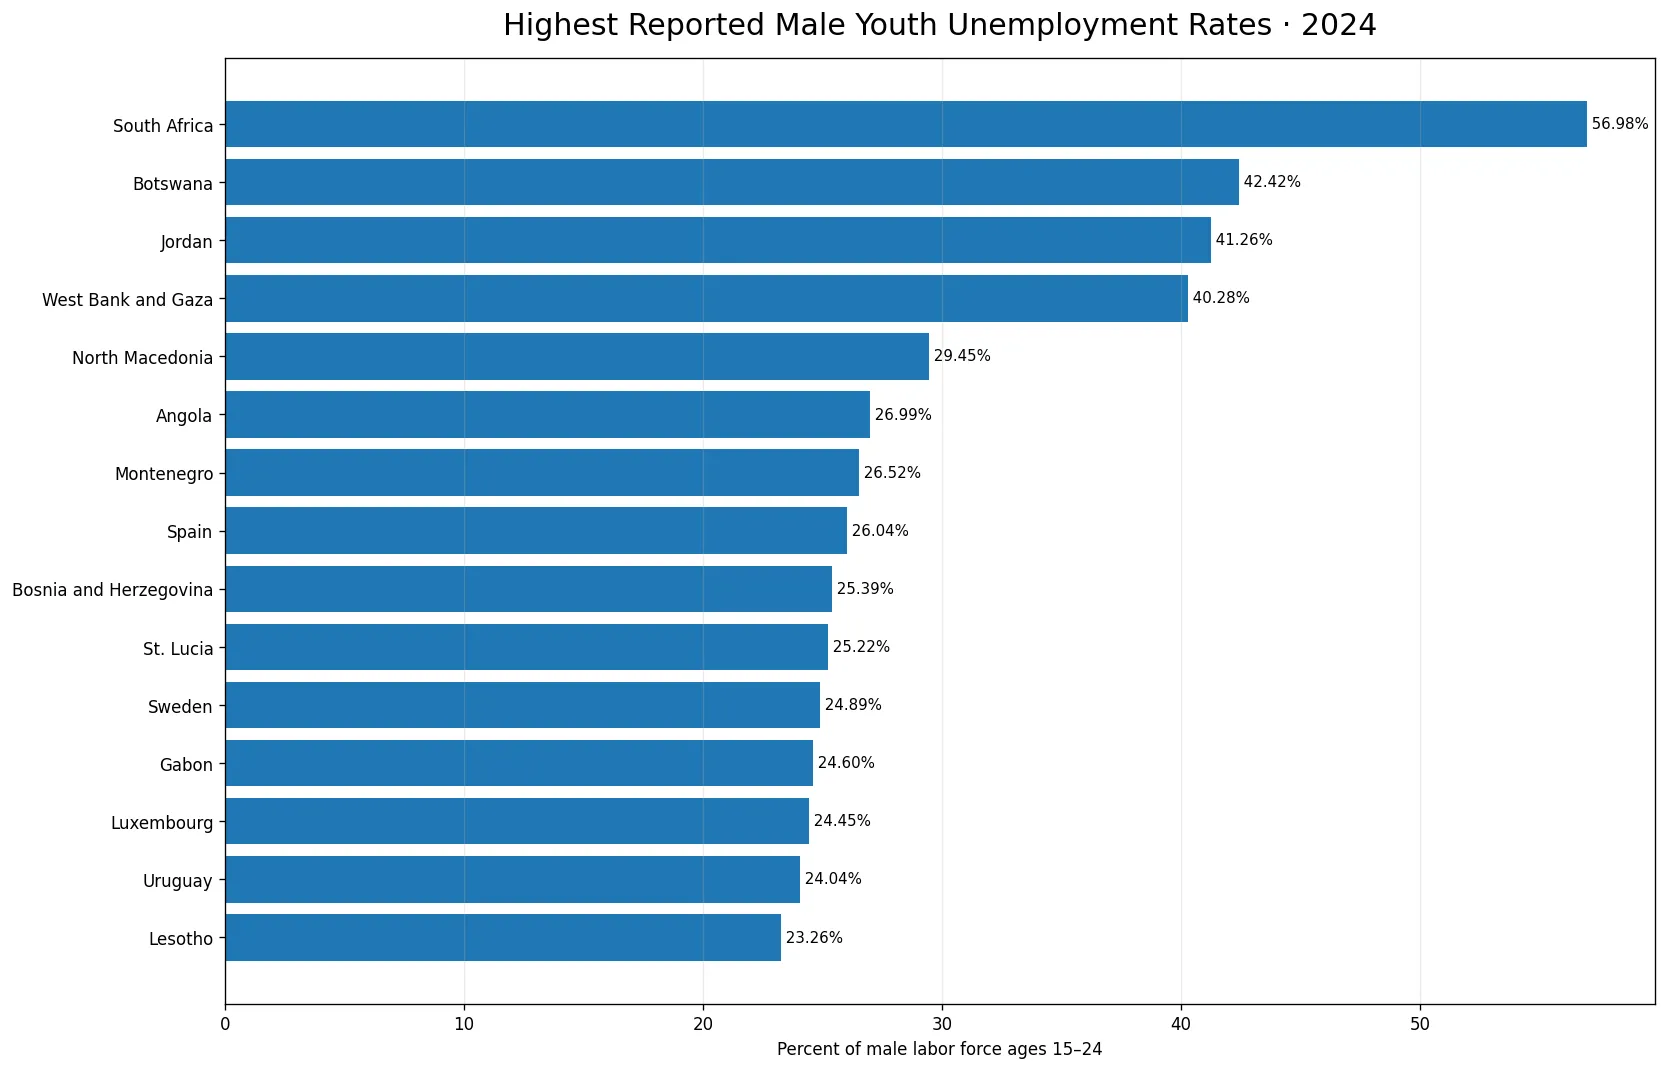
South Africa recorded the highest reported national estimate at 56.99%. Botswana followed at 42.42%, Jordan at 41.26%, and the West Bank and Gaza at 40.28%. These were the only four reported economies above 30%. North Macedonia was next at 29.45%, followed by Angola at 26.99%, Montenegro at 26.52%, Spain at 26.04%, Bosnia and Herzegovina at 25.39%, and St. Lucia at 25.22%.
A high youth unemployment rate does not identify a single cause. Weak hiring, slow economic growth, a mismatch between skills and available jobs, barriers to first employment, regional mobility, long job-search periods, and differences in informal employment can all contribute. The indicator is best treated as an outcome measure rather than a diagnosis. Employment-to-population ratios, labor-force participation, NEET rates, wages, and sectoral employment can help explain the mechanisms behind a high value.
The top 15 show a wide spread even among high-rate economies
The comparison of the 15 highest reported values shows that the upper end of the distribution is not a tight cluster. South Africa was about 14.56 percentage points above Botswana, while Jordan and the West Bank and Gaza were just above 40%. North Macedonia was already below 30%, and many of the remaining high-rate economies were concentrated in the low-to-mid 20s. Treating every economy in the top group as facing the same magnitude of problem would hide these substantial differences.
The chart compares rates, not the number of unemployed young men. A populous economy can have a lower rate but a much larger number of unemployed youth than a smaller economy with a high rate. Likewise, a rate cannot tell us the size of the male youth labor force. For planning employment services or estimating the number of people affected, a population or labor-force count is needed alongside the percentage.
Around the median, small differences deserve caution
Many reporting economies sit relatively close to the 13.44% median. In that part of the distribution, one or two percentage points should not automatically be treated as a meaningful ranking gap. National labor-force surveys can differ in design, reference periods, treatment of marginal jobs, and sampling uncertainty. A value printed to three decimal places should not be interpreted as if cross-country measurement were precise to the third decimal place.
Youth unemployment is also cyclical. When firms slow hiring, first-time labor-market entrants can be affected quickly because they have less experience and weaker professional networks. During a recovery, youth hiring can improve rapidly as well. A one-year map therefore provides a geographic snapshot rather than a structural trend. Looking at several years of the same national series can help distinguish a temporary shock from a more persistent labor-market problem.
Very low unemployment does not automatically mean ideal youth outcomes
Qatar had the lowest reported rate at 0.26%, followed by Guatemala at 2.89%, the United Arab Emirates at 3.03%, Tanzania at 3.20%, and Thailand at 3.62%. Low rates can reflect strong labor demand, but unemployment alone does not describe the full experience of young people. A low rate can coexist with low labor-force participation, high informality, underemployment, low wages, or a large share of youth remaining outside both work and active job search.
This is particularly important for youth because many people ages 15–24 are still in education. Someone who is not employed and is not actively seeking work is generally outside the labor force rather than unemployed. A low unemployment rate can therefore look different depending on whether many young men are studying, discouraged from searching, or working in informal arrangements. Labor-force participation and employment-to-population ratios add essential context.
Why national estimates require care in international comparisons
National estimates are grounded in each country’s official statistical system, but they are not necessarily harmonized in every detail. The World Bank notes that definitions of the labor force and unemployment can differ by country. Survey frequency, reference periods, treatment of informal jobs, and the classification of students who are seeking work can also affect measured rates. Large cross-country differences are informative, but very small differences should not be overinterpreted.
For some research questions, an ILO modeled estimate may be more appropriate because modeling is designed to improve comparability and fill gaps. For questions tied to a country’s official policy environment, national estimates may be more directly relevant. The two series should not be substituted for one another without noting the methodological difference. This article stays with the 2024 national-estimate series throughout.
The map shows spatial patterns, not causal explanations
The map makes it easy to see clusters of high reported rates in parts of southern Africa, the Middle East and North Africa, and southeastern Europe. Yet substantial variation also exists within those broad regions, and many economies have no 2024 observation. Similar map colors do not imply identical causes. Demographics, industrial structure, education-to-work institutions, macroeconomic conditions, migration, and labor-market regulation differ sharply from place to place.
The 114 missing observations also shape what the map looks like. A blank area is a data gap, not evidence of a low rate. The visualization should therefore be used to locate reported high and low values and to identify places for further research. Country-level labor-market reports and time series are needed to explain why the rate is high or low in a specific economy.
How to read this with total unemployment, female youth unemployment and NEET
Male youth unemployment is one part of a broader youth labor-market picture. Comparing it with total youth unemployment shows how the male component relates to the overall rate, while comparing it with female youth unemployment can reveal gender differences among young labor-force participants. However, gender comparisons also need participation rates because a low participation rate can reduce the number of people counted in the unemployment denominator.
Employment-to-population ratios use a different denominator and show the share of the whole youth population that is employed. NEET rates identify young people who are not in employment, education or training, including some people who are not actively seeking work and therefore are not unemployed. Using these measures together can distinguish an economy where young people are actively searching but cannot find jobs from one where many are outside both employment and active job search.
What the 2024 distribution tells us
The 2024 national estimates show an unusually wide range of male youth unemployment outcomes across the 103 reporting economies. The median was 13.44%, yet South Africa reached 56.99% and Qatar was at 0.26%. Twenty-two economies were at or above 20%, and four exceeded 30%. These contrasts point to very different school-to-work and early-career conditions across labor markets.
At the same time, the indicator cannot by itself tell us about job quality, wages, informal employment, discouraged workers, education participation, or the absolute number of people affected. Coverage is also incomplete, with 114 economies lacking a 2024 value. The most useful reading is to treat this map as a comparative starting point and combine it with participation, employment, NEET, total unemployment, and multi-year trends before drawing broader conclusions.
Frequently Asked Questions
Which economy had the highest reported male youth unemployment rate in 2024?
Among the 103 economies with a 2024 national estimate, South Africa was highest at 56.99%, followed by Botswana at 42.42%, Jordan at 41.26%, and the West Bank and Gaza at 40.28%.
Is the denominator all men ages 15–24?
No. The denominator is the male labor force ages 15–24. Young men outside the labor force are not included in the unemployment-rate denominator.
Do the 114 economies without a value have 0% unemployment?
No. They are source-missing for 2024. Missing observations were not replaced with zero, and summary statistics use only the 103 reported values.
Related Articles
Green Map creates custom-edited map images using open geographic data sources such as geoBoundaries, Natural Earth, OpenStreetMap, and government open data. These maps are edited visual materials, not raw data files, and are provided for education, documents, presentations, and graphic reference.