A country’s health spending can be compared with the size of its economy by expressing it as a share of gross domestic product. World Bank indicator SH.XPD.CHEX.GD.ZS measures current health expenditure as a percentage of GDP. Current expenditure covers health-care goods and services consumed during the year; capital health spending such as buildings, major machinery, IT infrastructure and emergency vaccine stocks is excluded from this indicator.
The latest-available file contains 193 economies. Of these observations, 170 are from 2023, 22 are from 2024, and Ukraine’s latest value is from 2021. The map displays every latest available value, but rankings and distribution statistics below use the 170 observations from 2023 so that different observation years are not mixed into a single league table.
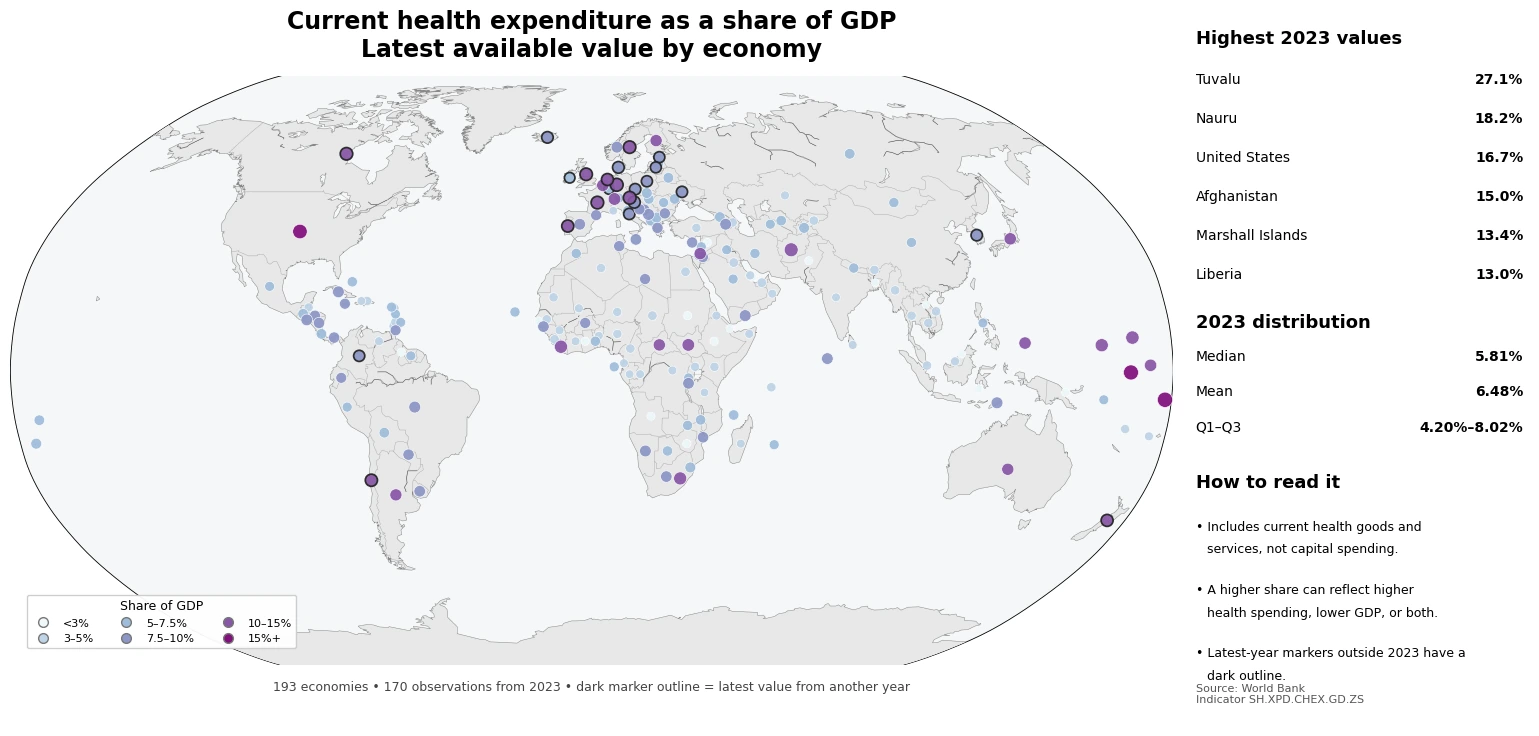
Table of Contents
Health spending as a share of GDP is not the same as total spending
A value of 8 percent means that current health expenditure in that year was equivalent to about 8 percent of GDP. Because GDP is the denominator, the measure does not directly compare total health spending in dollars or spending per person. It also is not a government-only measure: current health expenditure can be financed through government, private, household, insurance and external sources.
The denominator matters. A ratio can rise because health spending increases, because GDP falls, or because both move at the same time. Likewise, a low ratio does not by itself mean health care is inexpensive, accessible or adequately financed. Outcomes, coverage, efficiency and household financial burden require separate evidence.
The 2023 median was 5.81% of GDP
Across the 170 economies with 2023 observations, the median was 5.81% of GDP and the simple mean was 6.48%. The first quartile was 4.20% and the third quartile was 8.02%. The mean is higher than the median because a smaller group of economies records double-digit shares.
| 2023 current health expenditure share | Economies |
|---|---|
| <3% | 16 |
| 3–5% | 52 |
| 5–7.5% | 49 |
| 7.5–10% | 34 |
| 10–15% | 16 |
| 15%+ | 3 |
The largest concentrations are in the 3–5 percent band (52 economies) and the 5–7.5 percent band (49). A total of 19 economies are at 10 percent or more, while 16 are below 3 percent. This spread makes a single global average an incomplete description of the distribution.
Tuvalu had the highest 2023 share at 27.09%
Tuvalu records the highest 2023 value at 27.09% of GDP, followed by Nauru at 18.21%, the United States at 16.69%, Afghanistan at 14.99% and the Marshall Islands at 13.41%. The top group includes very different types of economies, so a high share should not be assigned one universal explanation.
| Economy | 2023 current health expenditure (% of GDP) |
|---|---|
| Tuvalu | 27.09% |
| Nauru | 18.21% |
| United States | 16.69% |
| Afghanistan | 14.99% |
| Marshall Islands | 13.41% |
| Liberia | 13.01% |
| Micronesia (Fed. Sts.) | 12.88% |
| Lesotho | 12.61% |
| Switzerland | 11.69% |
| South Sudan | 11.61% |
In small economies, the GDP denominator can make the ratio more sensitive to changes in either health spending or national output. In a large economy such as the United States, a high ratio can also reflect a very large level of health expenditure. The indicator does not identify the causal reason for a high value; per-capita spending, financing-source shares and income levels are useful companion measures.
Low shares do not show whether spending is adequate
The lowest 2023 observations include Laos at 1.33%, Bangladesh at 2.17%, Brunei Darussalam at 2.23%, Djibouti at 2.28% and Guyana at 2.47%. These values show that current health expenditure is small relative to GDP, but they do not reveal how much is spent per person or whether residents can obtain needed services.
| Economy | 2023 current health expenditure (% of GDP) |
|---|---|
| Laos | 1.33% |
| Bangladesh | 2.17% |
| Brunei Darussalam | 2.23% |
| Djibouti | 2.28% |
| Guyana | 2.47% |
| Pakistan | 2.52% |
| Qatar | 2.52% |
| Angola | 2.55% |
Two countries can both spend 5 percent of GDP on health while having very different GDP per person. Their health spending per resident can therefore differ substantially. Reading the GDP-share measure alongside per-capita health expenditure provides a more balanced cross-country comparison.
The 22 observations from 2024 should stay separate from the 2023 ranking
The latest-available map includes 2024 values for 22 economies. Germany records 12.27%, Austria 11.83%, France 11.54%, Canada 11.31% and Sweden 11.22%. These are shown as the freshest observations on the map but are excluded from the 2023 ranking and summary statistics because both GDP and health expenditure can change from one year to the next.
Ukraine’s latest value is 8.20% from 2021. A latest-available map maximizes geographic coverage, but a strict country ranking should align observation years. The dark marker outline is used to make those year differences visible.
Three rules for reading the map
- Current health expenditure covers health-care goods and services consumed during the year and excludes capital health expenditure.
- A higher GDP share can result from more health spending, lower GDP, or movements in both the numerator and denominator.
- The map uses 193 latest available values, while same-year ranking and distribution statistics use only the 170 observations from 2023.
Source: World Bank World Development Indicators, SH.XPD.CHEX.GD.ZS. Under the World Bank definition, current health expenditure includes health goods and services consumed during the year and excludes capital items such as buildings, machinery and IT.
Frequently Asked Questions
What does current health expenditure equal to 8% of GDP mean?
It means current health expenditure in that year was equivalent to about 8 percent of gross domestic product. It is not a government-only share or a per-person dollar amount.
Does a higher health-spending share of GDP mean a better health system?
Not necessarily. The ratio measures spending relative to economic output. Health outcomes, access, efficiency and household financial burden require separate indicators.
Why are 2024 values excluded from the 2023 ranking?
Both GDP and health expenditure change over time. The ranking and distribution statistics use the 170 observations from 2023 for a same-year comparison, while the map shows each economy’s latest available value.
Related Articles
Green Map creates custom-edited map images using open geographic data sources such as geoBoundaries, Natural Earth, OpenStreetMap, and government open data.
These maps are edited visual materials, not raw data files, and are provided for education, documents, presentations, and graphic reference.