World Bank indicator EN.GHG.CH4.AG.MT.CE.AR5 measures methane (CH₄) emissions from agriculture in million tonnes of CO₂ equivalent. The 2024 master file contains 217 economies and territories, with 198 reported numeric values and 19 source-missing rows. The unit is not million tonnes of methane itself: methane is converted to CO₂ equivalent using Global Warming Potential factors from the IPCC Fifth Assessment Report.
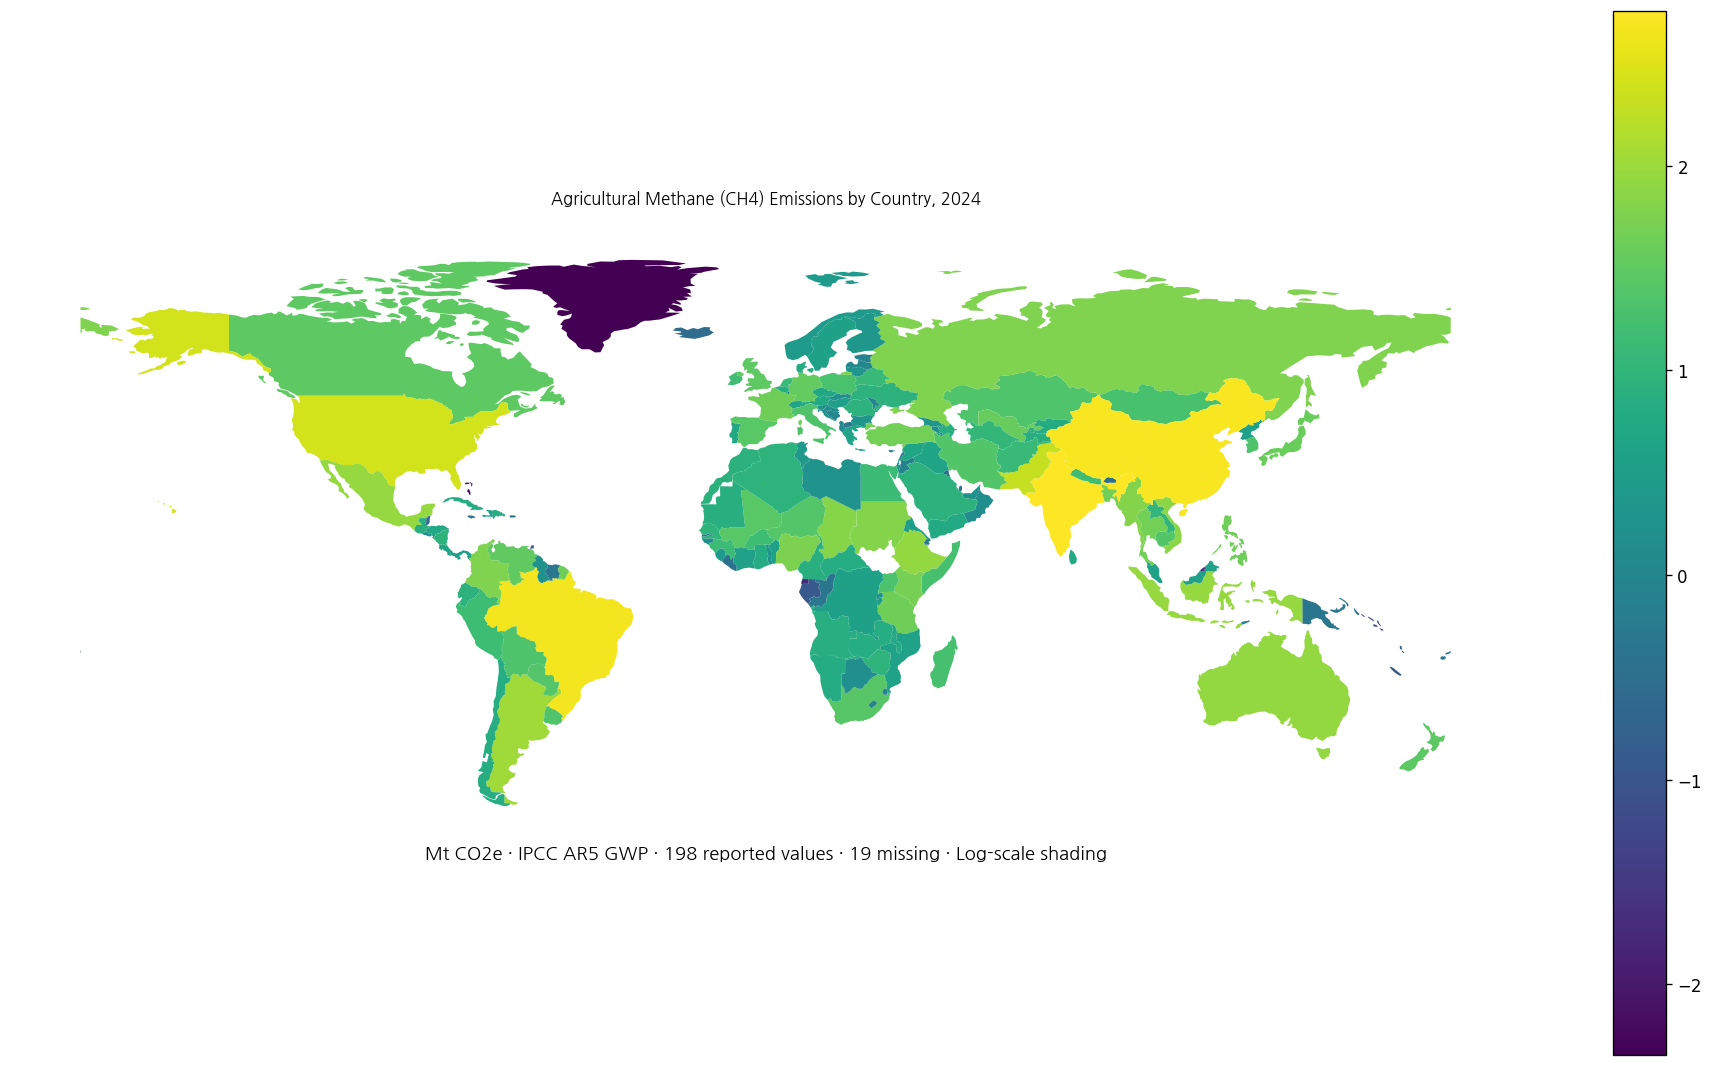
Table of Contents
What is included in agricultural methane emissions
The source description includes methane from livestock, especially enteric fermentation and manure management, as well as crop-related sources such as biomass burning and rice cultivation. The indicator therefore isolates methane from the agricultural sector rather than combining every greenhouse gas emitted by agriculture.
Livestock-related methane can be important in economies with large cattle and ruminant populations, while rice cultivation can be a major source in areas with extensive flooded paddy systems. This national total does not show the source-by-source split.
Mt CO₂e is not the physical mass of methane
Mt CO₂e means million tonnes of carbon dioxide equivalent. The methane quantity is converted using a Global Warming Potential factor so different greenhouse gases can be compared on a common climate-impact scale.
A value of 100 Mt CO₂e should not be restated as 100 million tonnes of CH₄. Recovering the physical methane mass would require the appropriate GWP conversion factor.
The AR5 conversion basis matters
This series uses Global Warming Potential factors from the IPCC Fifth Assessment Report. Other greenhouse-gas datasets may use AR4, AR6, or another conversion convention.
The same physical methane emissions can therefore produce different CO₂-equivalent values under different GWP factors. Indicator comparisons should align the assessment-report basis before concluding that two sources disagree.
The 2024 mean is 21.85 Mt CO₂e and the median is 3.84
Across the 198 economies with reported values, the mean is 21.85 Mt CO₂e and the median 3.84. The first quartile is 0.41 and the third quartile 15.00 Mt CO₂e. The mean is much higher than the median because a small number of large agricultural economies dominate the upper tail.
58 observations are at least 10 Mt CO₂e, 34 are at least 25, 18 are at least 50, and 6 exceed 100. Many small economies are far below 1 Mt CO₂e.
India is highest at 572.27 Mt CO₂e
India records 572.27 Mt CO₂e in 2024. China follows at 498.98, Brazil at 471.81, the United States at 257.35, and Pakistan at 203.87 Mt CO₂e. Argentina is the sixth economy above 100, at 105.38 Mt CO₂e.
| 2024 rank | Economy/territory | Agricultural methane emissions |
|---|---|---|
| 1 | India | 572.27 Mt CO₂e |
| 2 | China | 498.98 Mt CO₂e |
| 3 | Brazil | 471.81 Mt CO₂e |
| 4 | United States | 257.35 Mt CO₂e |
| 5 | Pakistan | 203.87 Mt CO₂e |
| 6 | Argentina | 105.38 Mt CO₂e |
| 7 | Indonesia | 88.40 Mt CO₂e |
| 8 | Mexico | 87.24 Mt CO₂e |
| 9 | Ethiopia | 87.11 Mt CO₂e |
| 10 | Australia | 84.70 Mt CO₂e |
| 11 | Viet Nam | 74.18 Mt CO₂e |
| 12 | Chad | 69.17 Mt CO₂e |
| 13 | Sudan | 64.91 Mt CO₂e |
| 14 | Myanmar | 63.91 Mt CO₂e |
| 15 | Russian Federation | 60.00 Mt CO₂e |
| 16 | Colombia | 58.86 Mt CO₂e |
| 17 | Nigeria | 56.75 Mt CO₂e |
| 18 | Kenya | 50.02 Mt CO₂e |
| 19 | Bangladesh | 47.41 Mt CO₂e |
| 20 | Turkiye | 46.39 Mt CO₂e |
These are absolute emissions, so population, agricultural land, livestock numbers, and rice-growing area can strongly influence the ranking. A high total does not by itself demonstrate poor emissions efficiency per unit of agricultural output.
Small island economies have very low absolute totals
The lowest reported value is Maldives at exactly 0.00 Mt CO₂e in the source. Naoero records 0.0003, Aruba 0.0015, Tuvalu 0.0017, and Macao SAR, China 0.0020 Mt CO₂e.
| Low-order position | Economy/territory | Agricultural methane emissions |
|---|---|---|
| 1 | Maldives | 0.00 Mt CO₂e |
| 2 | Naoero | 0.00 Mt CO₂e |
| 3 | Aruba | 0.00 Mt CO₂e |
| 4 | Tuvalu | 0.00 Mt CO₂e |
| 5 | Macao SAR, China | 0.00 Mt CO₂e |
| 6 | Bermuda | 0.00 Mt CO₂e |
| 7 | Seychelles | 0.00 Mt CO₂e |
| 8 | Guam | 0.00 Mt CO₂e |
| 9 | Kiribati | 0.00 Mt CO₂e |
| 10 | American Samoa | 0.00 Mt CO₂e |
| 11 | Cayman Islands | 0.00 Mt CO₂e |
| 12 | Greenland | 0.00 Mt CO₂e |
| 13 | Bahamas, The | 0.01 Mt CO₂e |
| 14 | British Virgin Islands | 0.01 Mt CO₂e |
| 15 | Singapore | 0.01 Mt CO₂e |
| 16 | St. Vincent and the Grenadines | 0.01 Mt CO₂e |
| 17 | Sao Tome and Principe | 0.01 Mt CO₂e |
| 18 | St. Kitts and Nevis | 0.01 Mt CO₂e |
| 19 | Antigua and Barbuda | 0.01 Mt CO₂e |
| 20 | Grenada | 0.01 Mt CO₂e |
Very small agricultural methane totals can reflect small agricultural sectors or limited relevant emission sources. They do not show the entire environmental footprint of agriculture, because carbon dioxide, nitrous oxide, land-use change, and other effects are outside this methane-only measure.
A published zero and a missing value are not the same
Only 1 of the 198 numeric observations is exactly zero: Maldives. By contrast, 19 economies and territories, including Andorra, Montenegro, and South Sudan, are marked `NA_SOURCE_MISSING` in the 2024 master data.
Filling those missing rows with zero would create false low-emission rankings. The map therefore leaves them unfilled, and the complete table identifies them as missing.
Total emissions do not measure agricultural productivity or emissions intensity
Large agricultural economies naturally tend to have larger totals. The ranking cannot tell whether agriculture is more or less emissions-efficient per tonne of output, per hectare, per animal, or per unit of value added.
Intensity analysis requires denominators such as agricultural value added, crop output, livestock counts, or food production. Total emissions and emissions intensity answer different questions.
A source-by-source breakdown is needed for mitigation analysis
The national total combines methane from livestock and crop-related sources covered by the indicator. Two countries with the same total can have very different underlying structures.
Mitigation options also differ. Enteric fermentation and manure management require livestock-focused approaches, while rice methane can respond to water-management practices. Policy interpretation therefore benefits from source-level data.
Agricultural methane is different from fugitive methane in energy
Methane is also released by oil, gas, coal, waste, and other activities. This indicator covers agriculture only and should not be combined conceptually with fugitive energy methane without explicitly adding separate sectoral data.
A national total methane inventory would require agriculture, energy, waste, and other methane sources. Sector-specific indicators are useful because they identify where emissions originate.
CO₂-equivalent does not make methane identical to CO₂
Expressing methane in CO₂ equivalent makes climate impact more comparable across gases, but methane and carbon dioxide remain different greenhouse gases with different sources, atmospheric behavior, and mitigation strategies.
Transport CO₂ emissions and agricultural methane can both be expressed in climate-related units, yet the gas identity and sector should remain visible in interpretation.
The map displays 165 of the 198 reporting economies
The low-resolution world boundary file matches 165 of the 198 reported economies, about 83.3%. Several small islands and territories lack polygons and remain available only in the table.
Logarithmic shading is used because the range from very small island values to India’s 572.27 Mt CO₂e is extremely wide. The table retains the untransformed source values.
The simple sum of reported rows is not an official world total
The 198 reported values sum to about 4326.92 Mt CO₂e, but 19 master rows are missing. Official world aggregates can also use aggregation procedures that differ from a simple sum of country rows.
The observed-row sum should therefore be described only as the sum of the 198 available values, not as the official 2024 global agricultural methane total.
Complete 2024 list of 217 economies and territories
The table below preserves every row in the 2024 master data. Missing source values remain missing and are not converted to zero.
| Economy/territory | Year | Agricultural methane emissions | Data status |
|---|---|---|---|
| Afghanistan | 2024 | 12.48 Mt CO₂e | Reported |
| Albania | 2024 | 1.07 Mt CO₂e | Reported |
| Algeria | 2024 | 8.94 Mt CO₂e | Reported |
| American Samoa | 2024 | 0.00 Mt CO₂e | Reported |
| Andorra | 2024 | No source value | No source value |
| Angola | 2024 | 7.25 Mt CO₂e | Reported |
| Antigua and Barbuda | 2024 | 0.01 Mt CO₂e | Reported |
| Argentina | 2024 | 105.38 Mt CO₂e | Reported |
| Armenia | 2024 | 1.26 Mt CO₂e | Reported |
| Aruba | 2024 | 0.00 Mt CO₂e | Reported |
| Australia | 2024 | 84.70 Mt CO₂e | Reported |
| Austria | 2024 | 5.21 Mt CO₂e | Reported |
| Azerbaijan | 2024 | 7.03 Mt CO₂e | Reported |
| Bahamas, The | 2024 | 0.01 Mt CO₂e | Reported |
| Bahrain | 2024 | 0.03 Mt CO₂e | Reported |
| Bangladesh | 2024 | 47.41 Mt CO₂e | Reported |
| Barbados | 2024 | 0.03 Mt CO₂e | Reported |
| Belarus | 2024 | 12.24 Mt CO₂e | Reported |
| Belgium | 2024 | 6.62 Mt CO₂e | Reported |
| Belize | 2024 | 0.20 Mt CO₂e | Reported |
| Benin | 2024 | 3.77 Mt CO₂e | Reported |
| Bermuda | 2024 | 0.00 Mt CO₂e | Reported |
| Bhutan | 2024 | 0.34 Mt CO₂e | Reported |
| Bolivia | 2024 | 21.76 Mt CO₂e | Reported |
| Bosnia and Herzegovina | 2024 | 1.04 Mt CO₂e | Reported |
| Botswana | 2024 | 1.51 Mt CO₂e | Reported |
| Brazil | 2024 | 471.81 Mt CO₂e | Reported |
| British Virgin Islands | 2024 | 0.01 Mt CO₂e | Reported |
| Brunei Darussalam | 2024 | 0.02 Mt CO₂e | Reported |
| Bulgaria | 2024 | 2.05 Mt CO₂e | Reported |
| Burkina Faso | 2024 | 14.39 Mt CO₂e | Reported |
| Burundi | 2024 | 2.90 Mt CO₂e | Reported |
| Cabo Verde | 2024 | 0.07 Mt CO₂e | Reported |
| Cambodia | 2024 | 23.83 Mt CO₂e | Reported |
| Cameroon | 2024 | 7.44 Mt CO₂e | Reported |
| Canada | 2024 | 30.53 Mt CO₂e | Reported |
| Cayman Islands | 2024 | 0.00 Mt CO₂e | Reported |
| Central African Republic | 2024 | 6.45 Mt CO₂e | Reported |
| Chad | 2024 | 69.17 Mt CO₂e | Reported |
| Channel Islands | 2024 | No source value | No source value |
| Chile | 2024 | 6.65 Mt CO₂e | Reported |
| China | 2024 | 498.98 Mt CO₂e | Reported |
| Colombia | 2024 | 58.86 Mt CO₂e | Reported |
| Comoros | 2024 | 0.07 Mt CO₂e | Reported |
| Congo, Dem. Rep. | 2024 | 3.50 Mt CO₂e | Reported |
| Congo, Rep. | 2024 | 0.46 Mt CO₂e | Reported |
| Costa Rica | 2024 | 4.38 Mt CO₂e | Reported |
| Cote d’Ivoire | 2024 | 3.88 Mt CO₂e | Reported |
| Croatia | 2024 | 1.49 Mt CO₂e | Reported |
| Cuba | 2024 | 6.42 Mt CO₂e | Reported |
| Curacao | 2024 | No source value | No source value |
| Cyprus | 2024 | 0.46 Mt CO₂e | Reported |
| Czechia | 2024 | 5.05 Mt CO₂e | Reported |
| Denmark | 2024 | 6.34 Mt CO₂e | Reported |
| Djibouti | 2024 | 0.52 Mt CO₂e | Reported |
| Dominica | 2024 | 0.03 Mt CO₂e | Reported |
| Dominican Republic | 2024 | 6.70 Mt CO₂e | Reported |
| Ecuador | 2024 | 8.44 Mt CO₂e | Reported |
| Egypt, Arab Rep. | 2024 | 13.40 Mt CO₂e | Reported |
| El Salvador | 2024 | 1.57 Mt CO₂e | Reported |
| Equatorial Guinea | 2024 | 0.02 Mt CO₂e | Reported |
| Eritrea | 2024 | 3.15 Mt CO₂e | Reported |
| Estonia | 2024 | 0.84 Mt CO₂e | Reported |
| Eswatini | 2024 | 0.79 Mt CO₂e | Reported |
| Ethiopia | 2024 | 87.11 Mt CO₂e | Reported |
| Faroe Islands | 2024 | 0.02 Mt CO₂e | Reported |
| Fiji | 2024 | 0.40 Mt CO₂e | Reported |
| Finland | 2024 | 2.36 Mt CO₂e | Reported |
| France | 2024 | 42.25 Mt CO₂e | Reported |
| French Polynesia | 2024 | 0.03 Mt CO₂e | Reported |
| Gabon | 2024 | 0.11 Mt CO₂e | Reported |
| Gambia, The | 2024 | 0.54 Mt CO₂e | Reported |
| Georgia | 2024 | 2.06 Mt CO₂e | Reported |
| Germany | 2024 | 33.97 Mt CO₂e | Reported |
| Ghana | 2024 | 6.20 Mt CO₂e | Reported |
| Gibraltar | 2024 | No source value | No source value |
| Greece | 2024 | 4.10 Mt CO₂e | Reported |
| Greenland | 2024 | 0.00 Mt CO₂e | Reported |
| Grenada | 2024 | 0.01 Mt CO₂e | Reported |
| Guam | 2024 | 0.00 Mt CO₂e | Reported |
| Guatemala | 2024 | 7.48 Mt CO₂e | Reported |
| Guinea | 2024 | 13.69 Mt CO₂e | Reported |
| Guinea-Bissau | 2024 | 1.38 Mt CO₂e | Reported |
| Guyana | 2024 | 1.62 Mt CO₂e | Reported |
| Haiti | 2024 | 3.22 Mt CO₂e | Reported |
| Honduras | 2024 | 5.22 Mt CO₂e | Reported |
| Hong Kong SAR, China | 2024 | 0.02 Mt CO₂e | Reported |
| Hungary | 2024 | 3.44 Mt CO₂e | Reported |
| Iceland | 2024 | 0.28 Mt CO₂e | Reported |
| India | 2024 | 572.27 Mt CO₂e | Reported |
| Indonesia | 2024 | 88.40 Mt CO₂e | Reported |
| Iran, Islamic Rep. | 2024 | 23.95 Mt CO₂e | Reported |
| Iraq | 2024 | 4.30 Mt CO₂e | Reported |
| Ireland | 2024 | 15.58 Mt CO₂e | Reported |
| Isle of Man | 2024 | No source value | No source value |
| Israel | 2024 | 2.03 Mt CO₂e | Reported |
| Italy | 2024 | 21.92 Mt CO₂e | Reported |
| Jamaica | 2024 | 0.43 Mt CO₂e | Reported |
| Japan | 2024 | 38.90 Mt CO₂e | Reported |
| Jordan | 2024 | 0.76 Mt CO₂e | Reported |
| Kazakhstan | 2024 | 22.33 Mt CO₂e | Reported |
| Kenya | 2024 | 50.02 Mt CO₂e | Reported |
| Kiribati | 2024 | 0.00 Mt CO₂e | Reported |
| Korea, Dem. People’s Rep. | 2024 | 3.43 Mt CO₂e | Reported |
| Korea, Rep. | 2024 | 21.02 Mt CO₂e | Reported |
| Kosovo | 2024 | No source value | No source value |
| Kuwait | 2024 | 0.26 Mt CO₂e | Reported |
| Kyrgyz Republic | 2024 | 5.92 Mt CO₂e | Reported |
| Lao PDR | 2024 | 9.63 Mt CO₂e | Reported |
| Latvia | 2024 | 1.09 Mt CO₂e | Reported |
| Lebanon | 2024 | 0.41 Mt CO₂e | Reported |
| Lesotho | 2024 | 0.79 Mt CO₂e | Reported |
| Liberia | 2024 | 0.38 Mt CO₂e | Reported |
| Libya | 2024 | 1.92 Mt CO₂e | Reported |
| Liechtenstein | 2024 | No source value | No source value |
| Lithuania | 2024 | 2.02 Mt CO₂e | Reported |
| Luxembourg | 2024 | 0.48 Mt CO₂e | Reported |
| Macao SAR, China | 2024 | 0.00 Mt CO₂e | Reported |
| Madagascar | 2024 | 17.89 Mt CO₂e | Reported |
| Malawi | 2024 | 5.42 Mt CO₂e | Reported |
| Malaysia | 2024 | 3.89 Mt CO₂e | Reported |
| Maldives | 2024 | 0.00 Mt CO₂e | Reported |
| Mali | 2024 | 26.64 Mt CO₂e | Reported |
| Malta | 2024 | 0.05 Mt CO₂e | Reported |
| Marshall Islands | 2024 | No source value | No source value |
| Mauritania | 2024 | 7.33 Mt CO₂e | Reported |
| Mauritius | 2024 | 0.02 Mt CO₂e | Reported |
| Mexico | 2024 | 87.24 Mt CO₂e | Reported |
| Micronesia, Fed. Sts. | 2024 | 0.04 Mt CO₂e | Reported |
| Moldova | 2024 | 0.93 Mt CO₂e | Reported |
| Monaco | 2024 | No source value | No source value |
| Mongolia | 2024 | 18.68 Mt CO₂e | Reported |
| Montenegro | 2024 | No source value | No source value |
| Morocco | 2024 | 8.32 Mt CO₂e | Reported |
| Mozambique | 2024 | 3.93 Mt CO₂e | Reported |
| Myanmar | 2024 | 63.91 Mt CO₂e | Reported |
| Namibia | 2024 | 6.32 Mt CO₂e | Reported |
| Naoero | 2024 | 0.00 Mt CO₂e | Reported |
| Nepal | 2024 | 15.20 Mt CO₂e | Reported |
| Netherlands | 2024 | 12.14 Mt CO₂e | Reported |
| New Caledonia | 2024 | 0.13 Mt CO₂e | Reported |
| New Zealand | 2024 | 29.69 Mt CO₂e | Reported |
| Nicaragua | 2024 | 9.07 Mt CO₂e | Reported |
| Niger | 2024 | 24.49 Mt CO₂e | Reported |
| Nigeria | 2024 | 56.75 Mt CO₂e | Reported |
| North Macedonia | 2024 | 0.51 Mt CO₂e | Reported |
| Northern Mariana Islands | 2024 | No source value | No source value |
| Norway | 2024 | 2.71 Mt CO₂e | Reported |
| Oman | 2024 | 1.36 Mt CO₂e | Reported |
| Pakistan | 2024 | 203.87 Mt CO₂e | Reported |
| Palau | 2024 | No source value | No source value |
| Panama | 2024 | 3.04 Mt CO₂e | Reported |
| Papua New Guinea | 2024 | 0.45 Mt CO₂e | Reported |
| Paraguay | 2024 | 24.41 Mt CO₂e | Reported |
| Peru | 2024 | 14.34 Mt CO₂e | Reported |
| Philippines | 2024 | 43.03 Mt CO₂e | Reported |
| Poland | 2024 | 20.04 Mt CO₂e | Reported |
| Portugal | 2024 | 4.92 Mt CO₂e | Reported |
| Puerto Rico (US) | 2024 | 0.46 Mt CO₂e | Reported |
| Qatar | 2024 | 0.37 Mt CO₂e | Reported |
| Romania | 2024 | 8.62 Mt CO₂e | Reported |
| Russian Federation | 2024 | 60.00 Mt CO₂e | Reported |
| Rwanda | 2024 | 1.72 Mt CO₂e | Reported |
| Samoa | 2024 | 0.10 Mt CO₂e | Reported |
| San Marino | 2024 | No source value | No source value |
| Sao Tome and Principe | 2024 | 0.01 Mt CO₂e | Reported |
| Saudi Arabia | 2024 | 8.68 Mt CO₂e | Reported |
| Senegal | 2024 | 9.39 Mt CO₂e | Reported |
| Serbia | 2024 | No source value | No source value |
| Seychelles | 2024 | 0.00 Mt CO₂e | Reported |
| Sierra Leone | 2024 | 2.62 Mt CO₂e | Reported |
| Singapore | 2024 | 0.01 Mt CO₂e | Reported |
| Sint Maarten (Dutch part) | 2024 | No source value | No source value |
| Slovak Republic | 2024 | 1.47 Mt CO₂e | Reported |
| Slovenia | 2024 | 1.50 Mt CO₂e | Reported |
| Solomon Islands | 2024 | 0.06 Mt CO₂e | Reported |
| Somalia, Fed. Rep. | 2024 | 17.64 Mt CO₂e | Reported |
| South Africa | 2024 | 25.85 Mt CO₂e | Reported |
| South Sudan | 2024 | No source value | No source value |
| Spain | 2024 | 27.33 Mt CO₂e | Reported |
| Sri Lanka | 2024 | 5.57 Mt CO₂e | Reported |
| St. Kitts and Nevis | 2024 | 0.01 Mt CO₂e | Reported |
| St. Lucia | 2024 | 0.02 Mt CO₂e | Reported |
| St. Martin (French part) | 2024 | No source value | No source value |
| St. Vincent and the Grenadines | 2024 | 0.01 Mt CO₂e | Reported |
| Sudan | 2024 | 64.91 Mt CO₂e | Reported |
| Suriname | 2024 | 0.51 Mt CO₂e | Reported |
| Sweden | 2024 | 3.79 Mt CO₂e | Reported |
| Switzerland | 2024 | 4.05 Mt CO₂e | Reported |
| Syrian Arab Republic | 2024 | 4.66 Mt CO₂e | Reported |
| Tajikistan | 2024 | 7.47 Mt CO₂e | Reported |
| Tanzania | 2024 | 43.66 Mt CO₂e | Reported |
| Thailand | 2024 | 45.93 Mt CO₂e | Reported |
| Timor-Leste | 2024 | 0.83 Mt CO₂e | Reported |
| Togo | 2024 | 1.99 Mt CO₂e | Reported |
| Tonga | 2024 | 0.06 Mt CO₂e | Reported |
| Trinidad and Tobago | 2024 | 0.08 Mt CO₂e | Reported |
| Tunisia | 2024 | 2.49 Mt CO₂e | Reported |
| Turkiye | 2024 | 46.39 Mt CO₂e | Reported |
| Turkmenistan | 2024 | 10.59 Mt CO₂e | Reported |
| Turks and Caicos Islands | 2024 | No source value | No source value |
| Tuvalu | 2024 | 0.00 Mt CO₂e | Reported |
| Uganda | 2024 | 20.51 Mt CO₂e | Reported |
| Ukraine | 2024 | 8.72 Mt CO₂e | Reported |
| United Arab Emirates | 2024 | 1.63 Mt CO₂e | Reported |
| United Kingdom | 2024 | 31.55 Mt CO₂e | Reported |
| United States | 2024 | 257.35 Mt CO₂e | Reported |
| Uruguay | 2024 | 22.96 Mt CO₂e | Reported |
| Uzbekistan | 2024 | 37.79 Mt CO₂e | Reported |
| Vanuatu | 2024 | 0.18 Mt CO₂e | Reported |
| Venezuela, RB | 2024 | 32.46 Mt CO₂e | Reported |
| Viet Nam | 2024 | 74.18 Mt CO₂e | Reported |
| Virgin Islands (U.S.) | 2024 | 0.02 Mt CO₂e | Reported |
| West Bank and Gaza | 2024 | No source value | No source value |
| Yemen, Rep. | 2024 | 5.65 Mt CO₂e | Reported |
| Zambia | 2024 | 6.39 Mt CO₂e | Reported |
| Zimbabwe | 2024 | 9.20 Mt CO₂e | Reported |
How to interpret the comparison
First, the unit is Mt CO₂e using IPCC AR5 GWP factors, not Mt of physical methane. Second, the measure covers methane from agriculture rather than all agricultural greenhouse gases. Third, absolute totals are strongly influenced by the scale and structure of agriculture.
Fourth, published zero and missing are different. Fifth, source composition and emissions intensity need additional data. Sixth, the sum of available country rows should not be relabeled as an official global aggregate.
Source and calculation
The source is World Bank World Development Indicators EN.GHG.CH4.AG.MT.CE.AR5, Methane (CH4) emissions from Agriculture (Mt CO2e). Statistics and rankings use the 198 numeric values in the 2024 master file, while all 19 source-missing rows are preserved.
Frequently Asked Questions
Does Mt CO₂e mean million tonnes of methane?
No. It is million tonnes of carbon dioxide equivalent after applying IPCC AR5 Global Warming Potential factors to methane.
What agricultural sources are included?
The indicator includes methane from livestock such as enteric fermentation and manure management, plus crop-related sources including biomass burning and rice cultivation.
Can the 19 missing economies be treated as zero?
No. Missing means no source value is available; it is different from a published zero.
Related Articles
Green Map creates custom-edited map images using open geographic data sources such as geoBoundaries, Natural Earth, OpenStreetMap, and government open data. These maps are edited visual materials, not raw data files, and are provided for education, documents, presentations, and graphic reference.