World Bank indicator EN.GHG.CO2.TR.MT.CE.AR5 reports 2024 transport-sector carbon dioxide emissions for 194 countries and economies. The 217-economy master frame contains 23 source-missing rows. The sum of the 194 reported observations is 6,936.9 Mt CO₂e, but it should not be labeled a complete world total because some economies are missing. The country median is 4.82 Mt CO₂e and the unweighted mean 35.76.
This indicator covers CO₂ emissions from the transport subsector of energy rather than all national carbon dioxide emissions. World Bank metadata lists IPCC 2006 transport codes for civil aviation, road transportation, railways, water-borne navigation, and other transportation. The unit is million tonnes of carbon-dioxide equivalent, or Mt CO₂e.
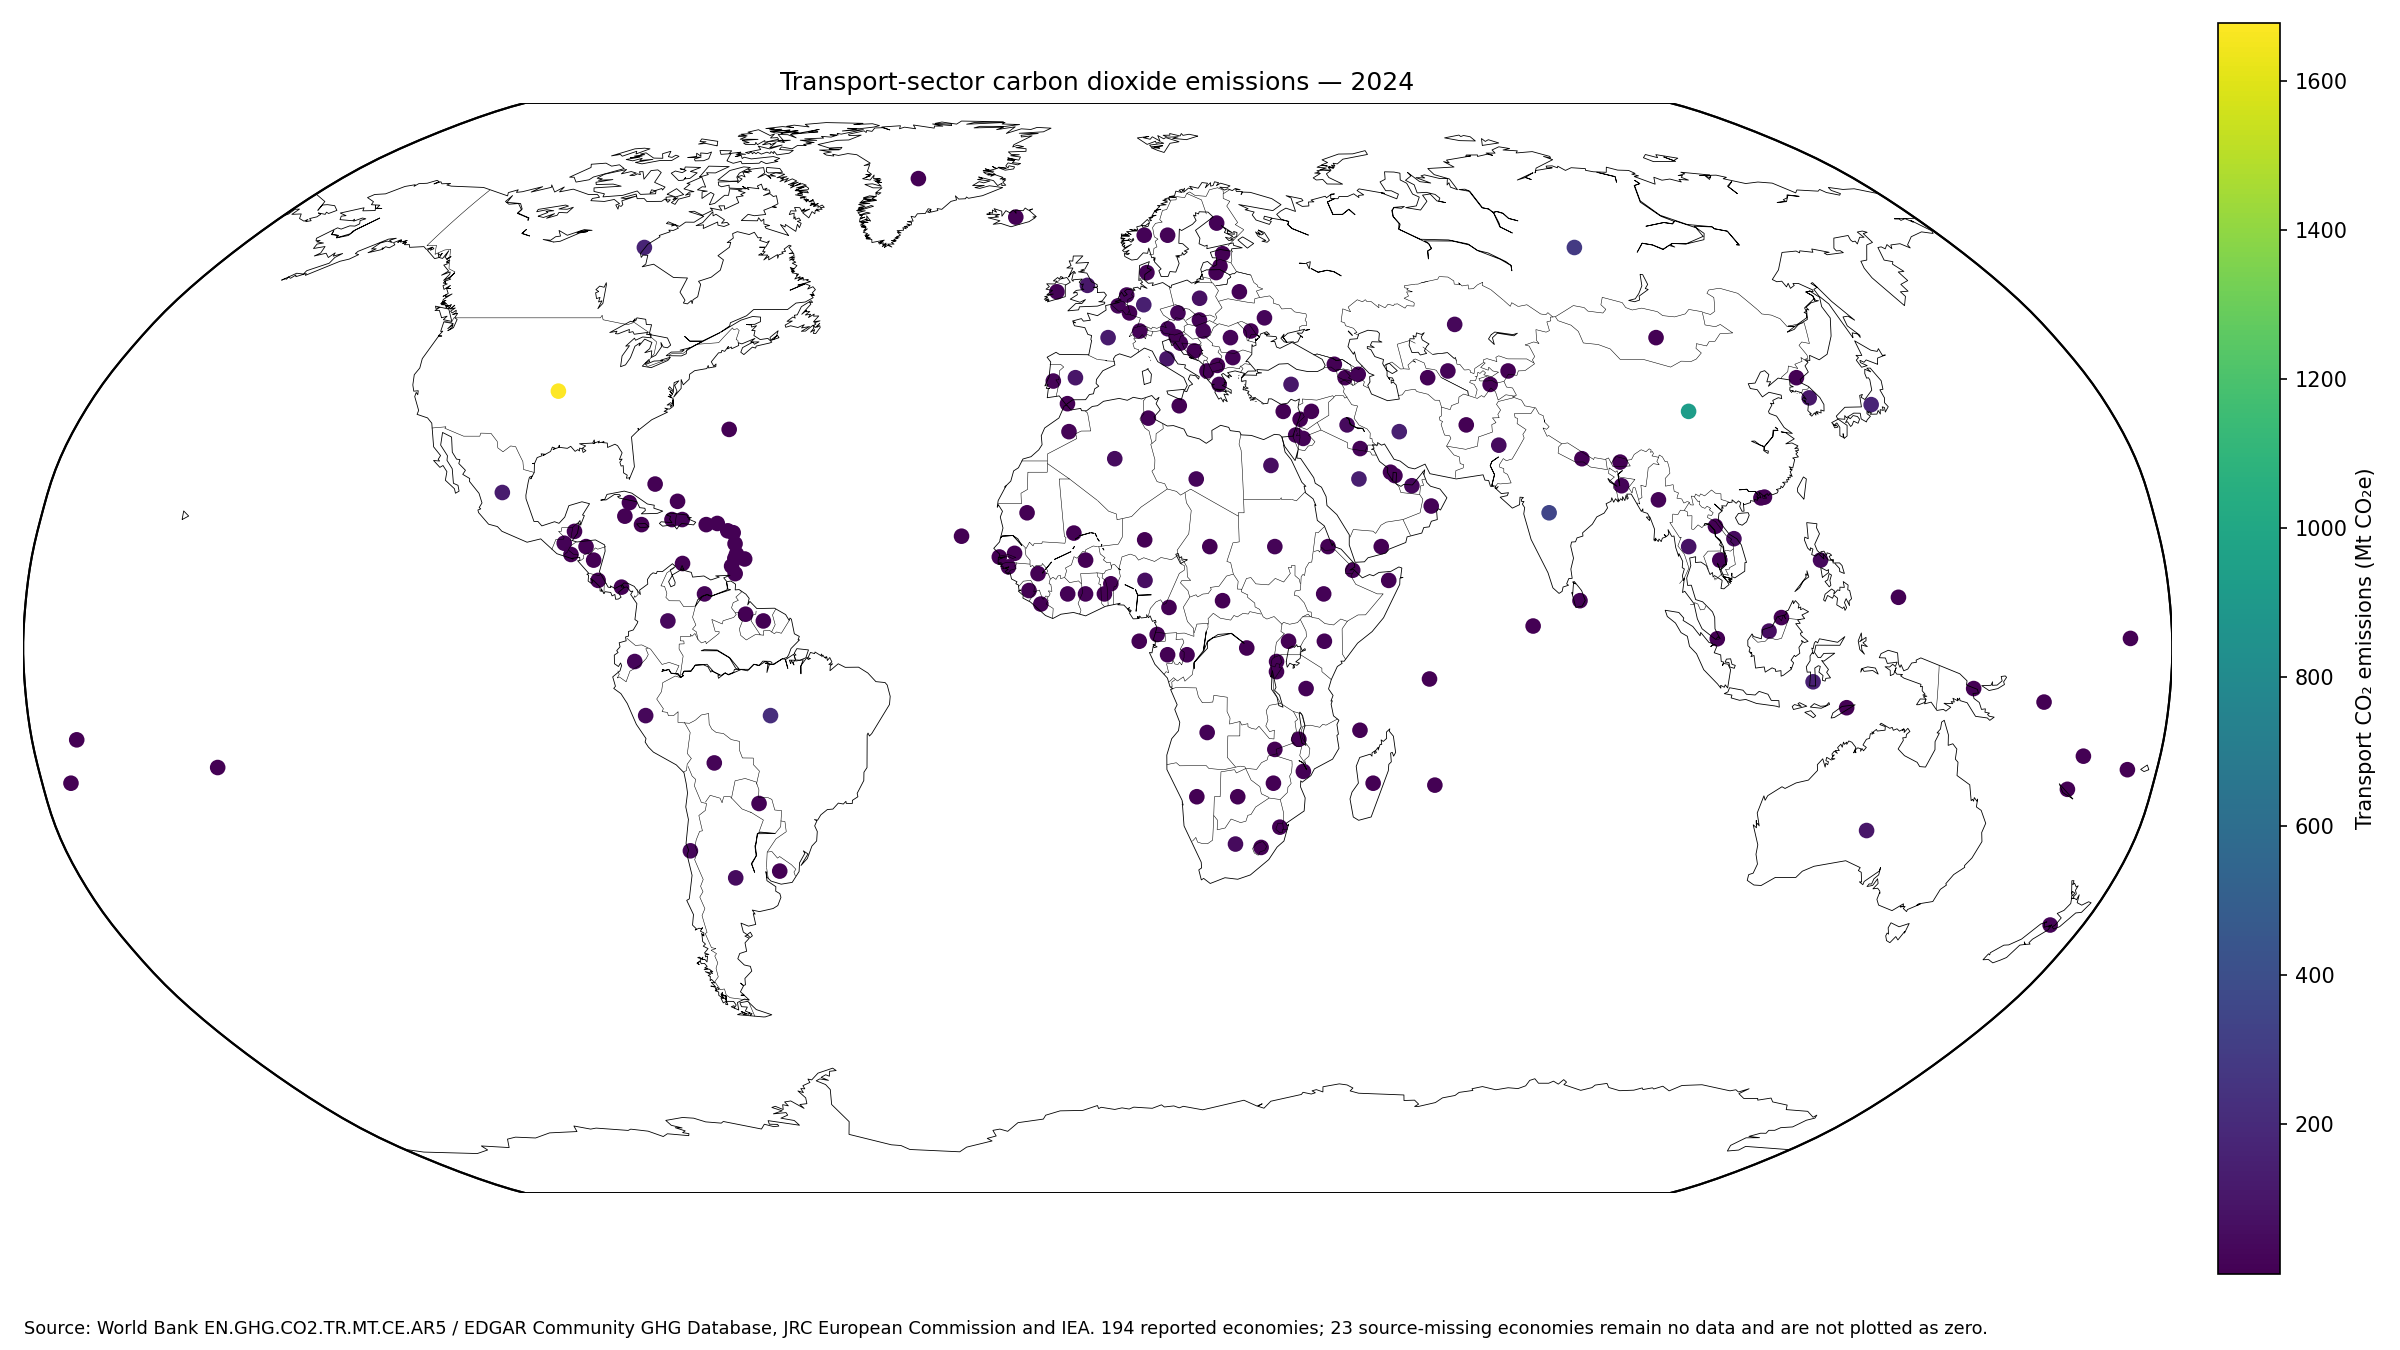
Table of Contents
What the transport CO₂ indicator covers
The World Bank classifies the measure under transport as a subsector of energy. The definition identifies IPCC 2006 categories 1.A.3.a Civil Aviation, 1.A.3.b Road Transportation without resuspension, 1.A.3.c Railways, 1.A.3.d Water-borne Navigation, and 1.A.3.e Other Transportation.
The World Bank indicator details describe annual carbon dioxide emissions standardized using the IPCC Fifth Assessment Report global-warming-potential framework. The World Bank data page lists the EDGAR Community GHG Database, the European Commission Joint Research Centre, and the IEA as sources.
What Mt CO₂e means
Mt means million tonnes. CO₂e is carbon-dioxide equivalent, a common accounting unit used to express climate effects on a comparable basis. Because the gas measured here is carbon dioxide itself, its global-warming-potential reference is one within the CO₂-equivalent system.
A value of 100 Mt CO₂e therefore represents roughly one hundred million tonnes of transport-sector CO₂ under this indicator. Keeping the Mt unit visible is important because confusing tonnes, kilotonnes, and megatonnes would change the scale by orders of magnitude.
The United States has the highest 2024 reported total
The United States records 1,678.56 Mt CO₂e, followed by China at 928.70, India at 344.35, the Russian Federation at 286.72, and Brazil at 219.29.
Japan, Canada, Indonesia, Iran, Saudi Arabia, Germany, Mexico, France, the United Kingdom, Italy, and Australia are also among the high absolute totals. These are national totals, not values normalized by population or economic output.
| Rank | Country or economy | 2024 transport CO₂ emissions |
|---|---|---|
| 1 | United States | 1,678.56 Mt CO₂e |
| 2 | China | 928.70 Mt CO₂e |
| 3 | India | 344.35 Mt CO₂e |
| 4 | Russian Federation | 286.72 Mt CO₂e |
| 5 | Brazil | 219.29 Mt CO₂e |
| 6 | Japan | 174.90 Mt CO₂e |
| 7 | Canada | 166.30 Mt CO₂e |
| 8 | Indonesia | 151.73 Mt CO₂e |
| 9 | Iran, Islamic Rep. | 146.13 Mt CO₂e |
| 10 | Saudi Arabia | 143.04 Mt CO₂e |
| 11 | Germany | 138.04 Mt CO₂e |
| 12 | Mexico | 127.16 Mt CO₂e |
| 13 | France | 119.18 Mt CO₂e |
| 14 | United Kingdom | 106.70 Mt CO₂e |
| 15 | Italy | 104.70 Mt CO₂e |
The top five account for nearly half of reported emissions
Within the 6,936.9 Mt CO₂e sum of 194 reported economies, the largest economy accounts for 24.2%, the top two 37.6%, and the top three 42.5%. The top five together account for 49.8%.
The top ten reach 61.1% and the top twenty 76.7% of the reported-economy sum. This is a highly concentrated distribution. The shares should still be described as shares of reported observations because 23 economies have no 2024 value.
The mean is far above the median
The unweighted country mean is 35.76 Mt CO₂e, compared with a median of only 4.82. The first quartile is 1.02 Mt and the third quartile 17.35 Mt.
The large gap between mean and median reflects a long upper tail created by a relatively small number of very large transport-emission totals. For a typical country observation, the median and distribution bands are more informative than the mean alone.
More than half of reported economies are below 5 Mt
10 reported economies are below 0.1 Mt, 39 are from 0.1 to under 1 Mt, and 49 are from 1 to under 5 Mt. Together those three groups contain 98 of the 194 reported economies.
Another 53 are from 5 to under 20 Mt, 26 from 20 to under 100 Mt, and only 17 are at least 100 Mt. The small number above 100 Mt contributes a disproportionate share of the total.
| Emission band | Economies | Share of reported values |
|---|---|---|
| Below 0.1 Mt | 10 | 5.2% |
| 0.1 to under 1 Mt | 39 | 20.1% |
| 1 to under 5 Mt | 49 | 25.3% |
| 5 to under 20 Mt | 53 | 27.3% |
| 20 to under 100 Mt | 26 | 13.4% |
| 100 Mt or more | 17 | 8.8% |
Small economies occupy the low end
Dominica records 0.0284 Mt, the British Virgin Islands 0.0315, Kiribati 0.0406, St. Vincent and the Grenadines 0.0451, and St. Kitts and Nevis 0.0463. Many low observations are small island economies.
These are reported positive values, not missing observations converted to zero. None of the 194 numeric rows is exactly zero.
| Low-end rank | Country or economy | 2024 transport CO₂ emissions |
|---|---|---|
| 1 | Dominica | 0.0284 Mt CO₂e |
| 2 | British Virgin Islands | 0.0315 Mt CO₂e |
| 3 | Kiribati | 0.0406 Mt CO₂e |
| 4 | St. Vincent and the Grenadines | 0.0451 Mt CO₂e |
| 5 | St. Kitts and Nevis | 0.0463 Mt CO₂e |
| 6 | Grenada | 0.0602 Mt CO₂e |
| 7 | Turks and Caicos Islands | 0.0785 Mt CO₂e |
| 8 | Sao Tome and Principe | 0.0864 Mt CO₂e |
| 9 | Tonga | 0.0866 Mt CO₂e |
| 10 | Bermuda | 0.0916 Mt CO₂e |
| 11 | Greenland | 0.1031 Mt CO₂e |
| 12 | St. Lucia | 0.1052 Mt CO₂e |
| 13 | Antigua and Barbuda | 0.1220 Mt CO₂e |
| 14 | Cayman Islands | 0.1272 Mt CO₂e |
| 15 | Belize | 0.1300 Mt CO₂e |
Absolute totals should not be confused with per-capita emissions
The indicator reports total transport CO₂ within each economy. A country with a large population or a large transport system can have a high total without necessarily having high emissions per person.
Per-capita comparison requires dividing comparable emissions by population. That can produce a very different ordering from the absolute-total table.
Economic size is another possible denominator
Two economies with the same transport CO₂ total can have very different GDP levels. This dataset does not normalize by economic output, transport service, vehicle-kilometres, passenger-kilometres, or tonne-kilometres.
Questions about transport carbon intensity need a suitable denominator. The present indicator is best read as the geographic distribution of absolute transport-sector CO₂ emissions.
Transport CO₂ is not total national CO₂
National carbon dioxide totals can include power generation, manufacturing and construction, buildings, fuel industries, other energy uses, and non-energy sources. This series isolates the transport portion classified within energy.
A transport share of national CO₂ would require a comparable all-sector CO₂ total as the denominator. The transport figure alone cannot show whether transportation dominates a country’s carbon profile.
CO₂ is narrower than total transport greenhouse gases
The indicator name specifically identifies carbon dioxide. Other greenhouse gases such as methane or nitrous oxide are separate gases and may be covered by different sectoral GHG series.
The CO₂e unit places the measure within a harmonized greenhouse-gas accounting framework, but the measured gas here is CO₂. A total-GHG transport analysis would need the corresponding all-gas indicator or gas-specific components.
A common 2024 reference year makes the country comparison clean
All 194 numeric observations refer to 2024. Unlike latest-value datasets that mix years, the high and low values here are temporally aligned.
The remaining limitation is geographic coverage: 23 master economies have no numeric 2024 observation. The analysis therefore avoids calling the 194-row sum an exhaustive global total.
The 23 missing rows are not zero-emission economies
Source-missing rows include Andorra, American Samoa, Channel Islands, Curacao, Faroe Islands, Micronesia, Guam, Isle of Man, Liechtenstein, Montenegro, West Bank and Gaza, Serbia, South Sudan, Tuvalu, Kosovo, and several other territories.
No data means no usable 2024 value was supplied in the source, not that transport emitted zero CO₂. Missing rows are excluded from the map, sum, mean, median, and distribution bands.
The 194-economy sum is not necessarily the official world aggregate
Adding the 194 reported values yields 6,936.9 Mt CO₂e. Because 23 economies are missing and an official aggregate can use different geographic and accounting boundaries, this sum is labeled as a reported-economy total rather than the official world total.
Official global aggregates should be used when the research question requires a complete world figure, with attention to geographic scope and any treatment of international transport.
The map shows strong spatial concentration
Economies above 100 Mt appear across North America, East and South Asia, Europe, the Middle East, South America, Southeast Asia, and Oceania. Very low totals are especially common among small Caribbean and Pacific island economies.
The map describes where absolute totals are concentrated; it does not by itself identify why. Population, vehicle fleets, freight and passenger activity, aviation, navigation, fuel mix, and transport policy require additional data.
Source and calculation notes
The source is World Bank World Development Indicators series EN.GHG.CO2.TR.MT.CE.AR5, based on the EDGAR Community GHG Database, the European Commission Joint Research Centre, and IEA data. The analysis uses 194 numeric observations from 2024 and preserves 23 source-missing economies as no data. The World Bank data page provides the series.
All 194 reported country codes are joined to geographic centroids for the map, producing a 100% match. Missing economies are not zero-filled.
Frequently Asked Questions
What transport activities are included in this CO₂ indicator?
The World Bank definition lists civil aviation, road transportation, railways, water-borne navigation, and other transportation under IPCC 2006 transport codes.
What does Mt CO₂e mean?
Mt means million tonnes and CO₂e means carbon-dioxide equivalent. The gas measured in this indicator is CO₂.
Is the sum of 194 economies the complete world transport CO₂ total?
No. Twenty-three economies have no 2024 value, so the sum should be treated only as the total of reported economies.
Related Articles
Green Map creates custom-edited map images using open geographic data sources such as geoBoundaries, Natural Earth, OpenStreetMap, and government open data. These maps are edited visual materials, not raw data files, and are provided for education, documents, presentations, and graphic reference.