The World Bank indicator Alternative and nuclear energy (% of total energy use) offers a broad view of how much of an economy’s energy supply comes from non-fossil sources. The latest-observation dataset used here contains 150 economies. Values range from 0.00% to 89.18%, with a median of 6.56% and a simple, unweighted mean of 11.16%. The spread is wide enough that a single global-looking number would hide much of the country-level structure.
The indicator should not be mistaken for nuclear power’s share of electricity or for renewable electricity generation. World Bank metadata describes the series as the non-fossil share of total energy supply and lists hydropower, nuclear, geothermal and solar among the included sources. The denominator is total energy use rather than electricity generation alone, so transport, industry and other energy uses matter to the interpretation.
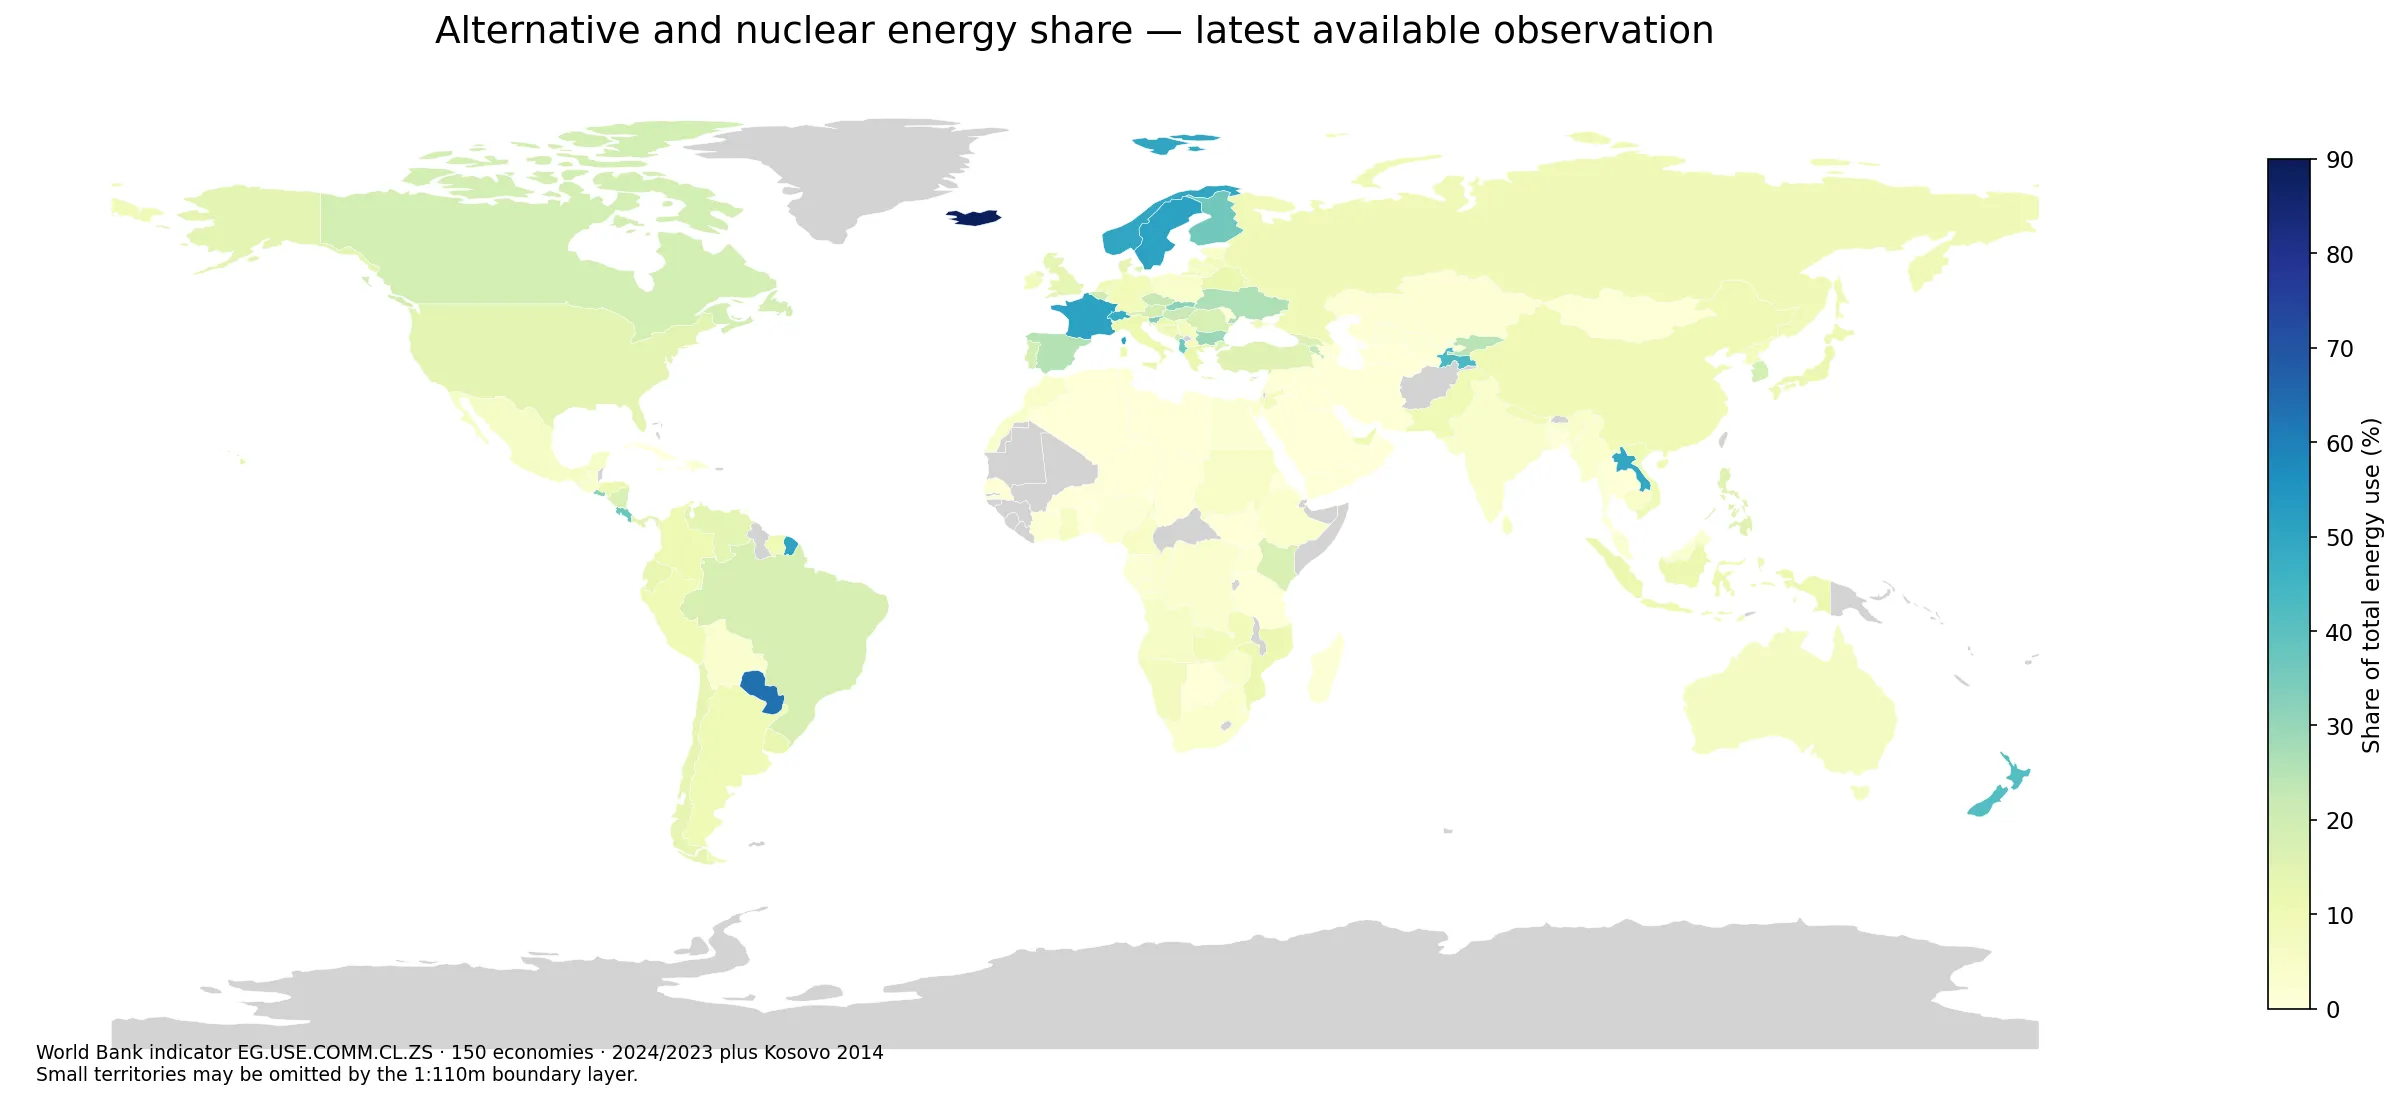
Table of Contents
What the World Bank indicator measures
The official code is EG.USE.COMM.CL.ZS. Its long definition frames “clean energy” here as non-carbohydrate energy that does not produce carbon dioxide when generated, including hydropower, nuclear, geothermal and solar power among other sources. It then states that the indicator is the share of total energy supply that is non-fossil. That wording is more informative than the short label because it makes clear that the series is broader than nuclear energy and is not restricted to renewable technologies.
Total energy use is also different from end-use electricity consumption. World Bank energy-use metadata refers to primary energy before conversion into end-use fuels such as electricity and refined petroleum products. As a result, a country can have a very low-carbon electricity system while still using large amounts of fossil fuels in transport, heating or industry. Comparing this indicator with an electricity-generation indicator can therefore reveal very different pictures of the same economy.
Latest year coverage is unusually concentrated
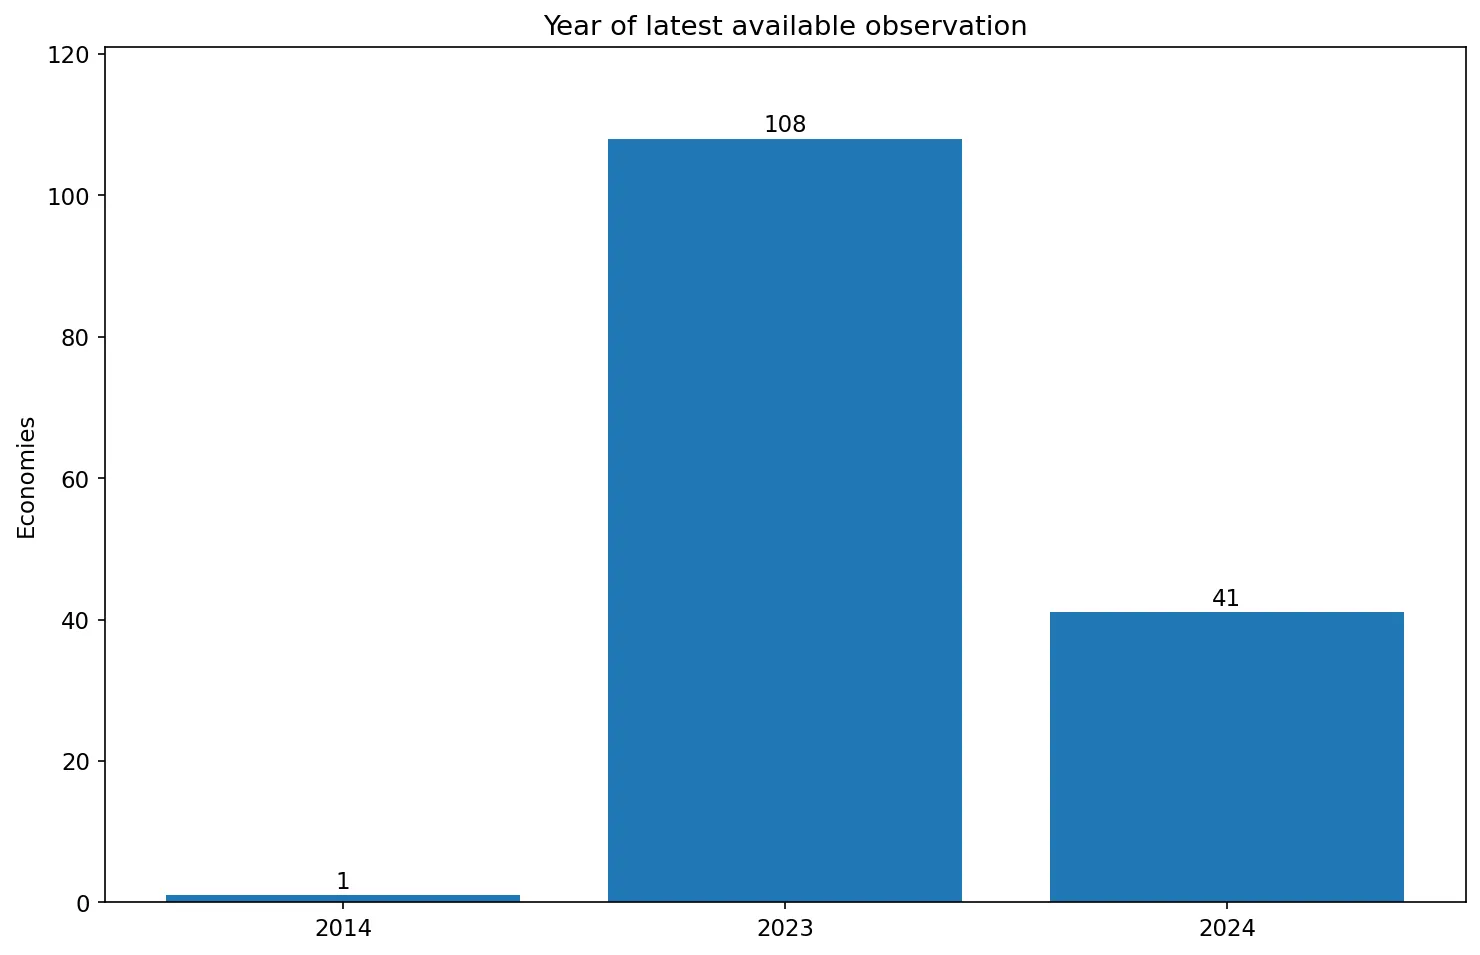
Of the 150 latest observations, 41 are from 2024 and 108 are from 2023. That means 149 of the 150 economies are represented by 2023–2024 data. Kosovo is the only outlier in time: its latest observation in this set is 0.52% from 2014. The overall comparison is therefore fairly recent, but not perfectly synchronized.
A latest-observation map answers a practical question—what is the newest value available for each place—but it does not create a common reference year. Energy shares can shift with hydrological conditions, reactor maintenance, new solar and wind capacity, changes in fuel demand, or revisions to energy balances. Close rankings between a 2023 observation and a 2024 observation should not be treated as precise evidence that one energy system is structurally ahead of another.
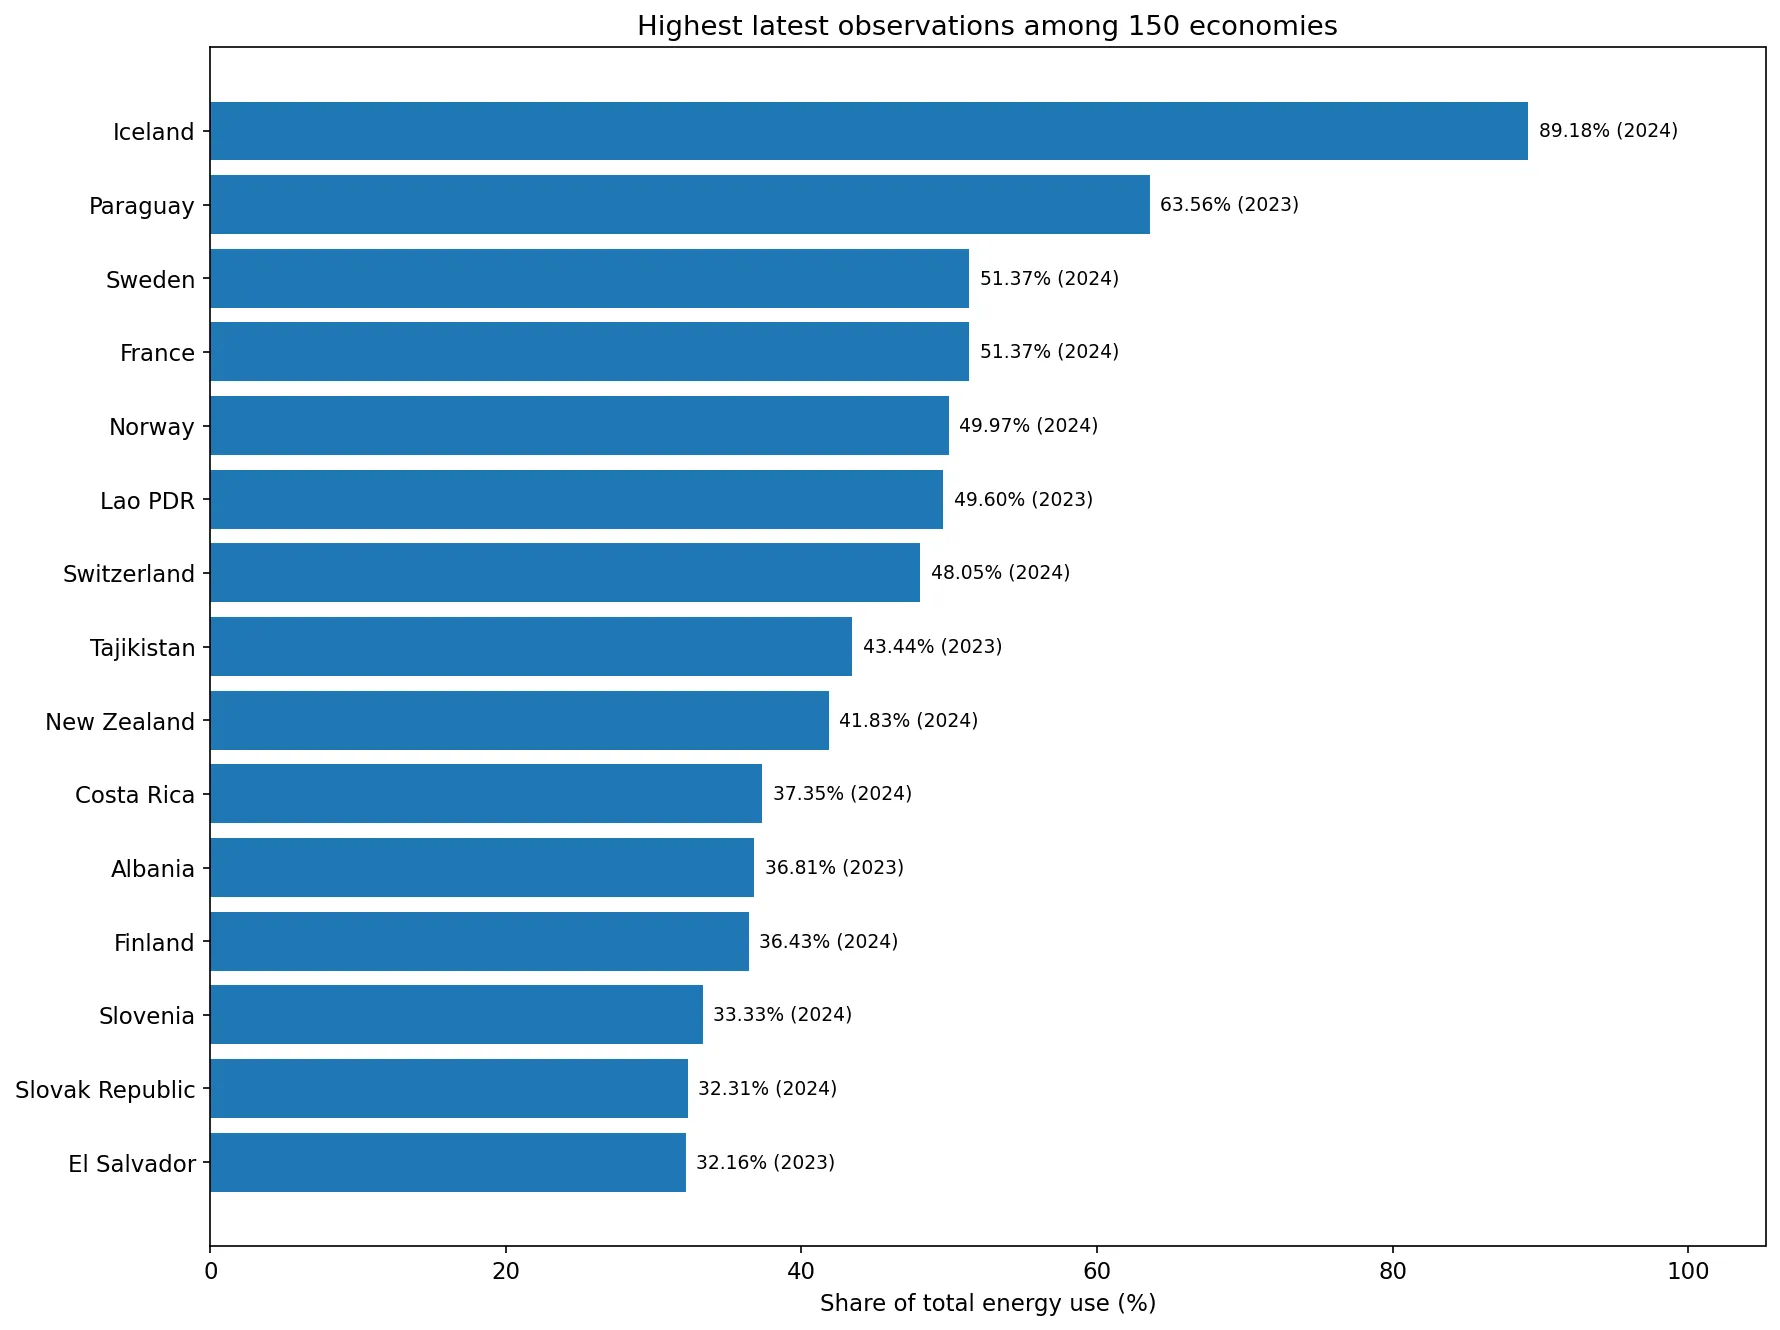
The highest latest shares
Iceland has the highest latest observation at 89.18% in 2024. Paraguay follows at 63.56% in 2023. France and Sweden are both at 51.37% in 2024, while Norway is at 49.97% in 2024 and Lao PDR at 49.60% in 2023. Switzerland reaches 48.05%, Tajikistan 43.44%, New Zealand 41.83% and Costa Rica 37.35%. These values identify the largest non-fossil shares in this particular latest-observation set.
The dataset by itself does not show which technology is responsible for each high value. A hydropower-dominant system and a nuclear-heavy system can both appear near the top even though their physical infrastructure, seasonal behavior and policy history differ substantially. Attribution requires source-specific energy balance data. The safest reading here is descriptive: the non-fossil share is high, but its internal composition is not specified by this single indicator.
Most economies sit far below the leaders
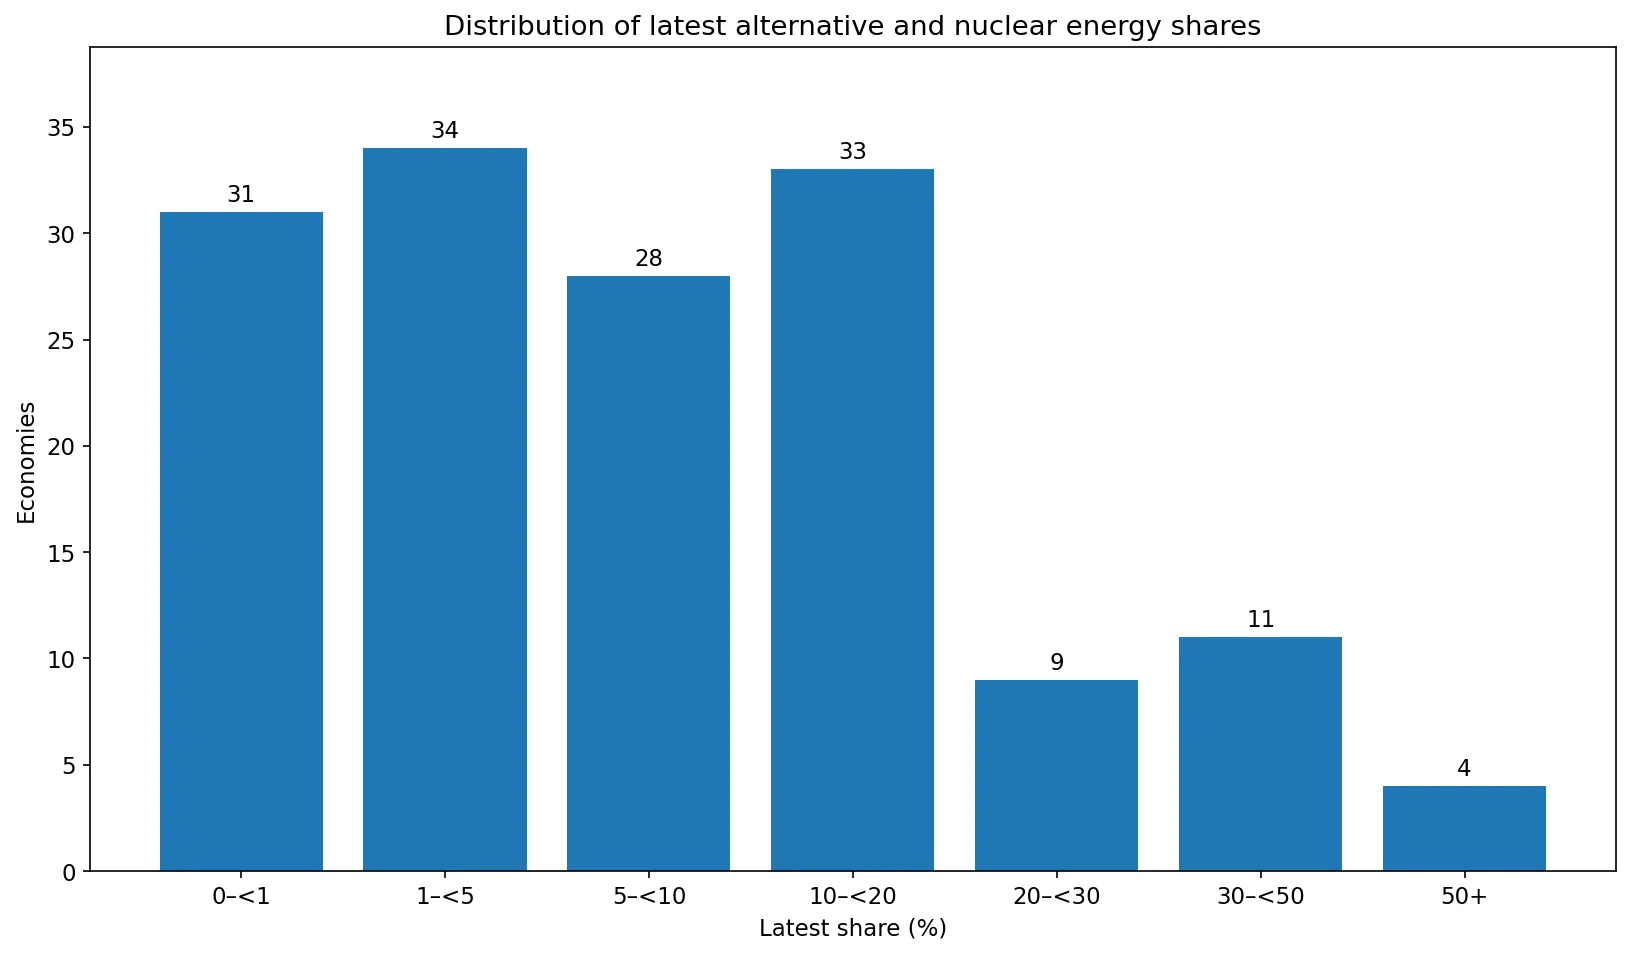
The distribution is strongly right-skewed. The median is 6.56%, while the simple mean is 11.16%. Thirty-one economies are below 1%, 34 are between 1% and 5%, 28 are between 5% and 10%, and 33 are between 10% and 20%. In other words, the majority of observations are below 10%, even though a handful of economies approach or exceed 50%.
Only 24 economies are at or above 20%, 15 are at or above 30%, and 4 reach at least 50%. This matters when interpreting a world map: large values draw visual attention, but they are not representative of the typical observation in the dataset. The arithmetic mean is also not an official global aggregate because every economy counts equally regardless of the size of its energy system.
What near-zero values do and do not say
31 economies have latest values below 1%. Gibraltar, Libya, Turkmenistan and Trinidad and Tobago are recorded at 0.00%. Brunei Darussalam is at 0.01%, Chad at 0.02%, Bahrain at 0.06%, Niger at 0.07%, and Benin, Kuwait and Botswana are also near one tenth of one percent. These are extremely low shares of the denominator used by the indicator.
A displayed 0.00% should not be stretched into a claim that no alternative source exists anywhere in the economy. The series is a national percentage presented at finite precision and does not inventory every individual solar installation, generator or small project. The defensible conclusion is narrower: the recorded non-fossil share of total energy use is zero or rounds to zero in the published latest observation.
Why this is not a renewable-energy ranking
Nuclear energy is not generally classified as renewable, yet it is explicitly part of this series. Conversely, some renewable-energy indicators use definitions that include combustible biomass or focus on final consumption rather than primary energy supply. The categories and denominators are therefore not interchangeable. A country may rank differently when the question changes from non-fossil energy supply to renewable final consumption or renewable electricity output.
Electricity shares are particularly easy to confuse with this indicator. A country can produce most of its electricity from hydropower or nuclear power and still rely heavily on petroleum products for transport or fossil fuels for industrial heat. That wider energy demand lowers the non-fossil share of total energy use relative to the clean share of electricity generation. The two statistics are complementary rather than redundant.
Interpretations the indicator cannot support by itself
The percentage is not an energy-independence score. A country can have a high non-fossil share and still import energy, while a fossil-fuel exporter can have a low non-fossil share and high energy self-sufficiency. It is also not a direct measure of electricity prices, household affordability, national emissions, or energy security. Those outcomes depend on additional quantities and institutional factors that are outside this series.
The indicator is also not a policy-effect estimate. A higher latest value may reflect decades of geography and infrastructure as much as recent policy. Hydropower availability, existing nuclear fleets, industrial structure and the scale of fossil-fuel demand can all shape the result. To test a policy claim, a time series, counterfactual framework and more detailed energy variables would be needed.
Full table of 150 latest observations
The table is sorted from the highest latest share to the lowest. The observation year is shown alongside every value because the list is not a strict same-year ranking. Equal values, such as France and Sweden at 51.37%, should be read as ties at the displayed precision. The ordering is descriptive and should not be interpreted as a score of environmental performance or policy quality.
| Economy | Latest year | Alternative & nuclear share (%) |
|---|---|---|
| Iceland | 2024 | 89.18 |
| Paraguay | 2023 | 63.56 |
| France | 2024 | 51.37 |
| Sweden | 2024 | 51.37 |
| Norway | 2024 | 49.97 |
| Lao PDR | 2023 | 49.60 |
| Switzerland | 2024 | 48.05 |
| Tajikistan | 2023 | 43.44 |
| New Zealand | 2024 | 41.83 |
| Costa Rica | 2024 | 37.35 |
| Albania | 2023 | 36.81 |
| Finland | 2024 | 36.43 |
| Slovenia | 2024 | 33.33 |
| Slovak Republic | 2024 | 32.31 |
| El Salvador | 2023 | 32.16 |
| Bulgaria | 2023 | 29.77 |
| Ukraine | 2023 | 26.44 |
| Spain | 2024 | 25.48 |
| Kyrgyz Republic | 2023 | 24.64 |
| Armenia | 2023 | 24.04 |
| Czechia | 2024 | 22.54 |
| Hungary | 2024 | 22.16 |
| Belgium | 2024 | 20.90 |
| Montenegro | 2023 | 20.56 |
| Canada | 2024 | 19.18 |
| Korea, Rep. | 2024 | 19.01 |
| Austria | 2024 | 18.79 |
| Brazil | 2024 | 17.74 |
| Portugal | 2024 | 17.67 |
| Romania | 2023 | 17.51 |
| Kenya | 2024 | 17.35 |
| Nicaragua | 2023 | 17.27 |
| Georgia | 2023 | 16.92 |
| Turkiye | 2024 | 15.68 |
| Philippines | 2023 | 15.67 |
| Panama | 2023 | 14.95 |
| Denmark | 2024 | 14.47 |
| Venezuela, RB | 2023 | 14.47 |
| United States | 2024 | 14.27 |
| United Kingdom | 2024 | 13.78 |
| Chile | 2024 | 13.51 |
| Ecuador | 2023 | 12.91 |
| Uruguay | 2023 | 12.57 |
| Greece | 2024 | 12.48 |
| Belarus | 2023 | 11.98 |
| Japan | 2024 | 11.77 |
| Mozambique | 2023 | 11.67 |
| Croatia | 2023 | 11.47 |
| Indonesia | 2023 | 11.45 |
| Italy | 2024 | 11.28 |
| Honduras | 2023 | 11.23 |
| Colombia | 2024 | 10.66 |
| United Arab Emirates | 2023 | 10.49 |
| Pakistan | 2023 | 10.46 |
| Suriname | 2023 | 10.25 |
| Peru | 2023 | 10.16 |
| Viet Nam | 2023 | 10.05 |
| Argentina | 2024 | 9.86 |
| China | 2023 | 9.76 |
| Netherlands | 2024 | 9.61 |
| Russian Federation | 2023 | 9.46 |
| Bosnia and Herzegovina | 2023 | 9.15 |
| Germany | 2024 | 9.09 |
| Nepal | 2023 | 8.96 |
| Zambia | 2023 | 8.90 |
| Ireland | 2024 | 8.53 |
| Latvia | 2024 | 8.18 |
| Korea, Dem. People's Rep. | 2023 | 7.77 |
| Namibia | 2023 | 7.71 |
| Jordan | 2023 | 7.52 |
| Cyprus | 2023 | 7.44 |
| Serbia | 2023 | 7.30 |
| North Macedonia | 2023 | 7.20 |
| Israel | 2024 | 6.72 |
| Australia | 2024 | 6.69 |
| Ghana | 2023 | 6.43 |
| Sri Lanka | 2023 | 6.38 |
| Lebanon | 2023 | 6.17 |
| Angola | 2023 | 6.06 |
| Lithuania | 2024 | 6.04 |
| Mexico | 2024 | 6.02 |
| Sudan | 2023 | 5.36 |
| Cambodia | 2023 | 5.23 |
| Estonia | 2024 | 5.09 |
| Cameroon | 2023 | 5.05 |
| Morocco | 2023 | 4.92 |
| Guatemala | 2023 | 4.23 |
| Zimbabwe | 2023 | 4.08 |
| India | 2023 | 4.07 |
| Poland | 2024 | 3.87 |
| Malta | 2023 | 3.81 |
| Myanmar | 2023 | 3.65 |
| Ethiopia | 2023 | 3.59 |
| South Africa | 2023 | 3.58 |
| Luxembourg | 2024 | 3.03 |
| Congo, Rep. | 2023 | 2.94 |
| Curacao | 2023 | 2.93 |
| Dominican Republic | 2023 | 2.88 |
| Malaysia | 2023 | 2.87 |
| Congo, Dem. Rep. | 2023 | 2.65 |
| Bolivia | 2023 | 2.63 |
| Gabon | 2023 | 2.46 |
| Eswatini | 2023 | 2.42 |
| Egypt, Arab Rep. | 2023 | 2.23 |
| Uganda | 2023 | 2.05 |
| Equatorial Guinea | 2023 | 1.91 |
| Cote d'Ivoire | 2023 | 1.85 |
| Moldova | 2023 | 1.78 |
| Kazakhstan | 2023 | 1.68 |
| Senegal | 2023 | 1.58 |
| Jamaica | 2023 | 1.54 |
| Mauritius | 2023 | 1.48 |
| Uzbekistan | 2023 | 1.31 |
| Tunisia | 2023 | 1.23 |
| Madagascar | 2023 | 1.10 |
| Nigeria | 2023 | 1.10 |
| Rwanda | 2023 | 1.04 |
| Iran, Islamic Rep. | 2023 | 1.03 |
| Thailand | 2023 | 1.02 |
| Azerbaijan | 2023 | 0.93 |
| Tanzania | 2023 | 0.88 |
| Mongolia | 2023 | 0.87 |
| Syrian Arab Republic | 2023 | 0.79 |
| Yemen, Rep. | 2023 | 0.75 |
| Oman | 2023 | 0.66 |
| Kosovo | 2014 | 0.52 |
| Eritrea | 2023 | 0.42 |
| Togo | 2023 | 0.41 |
| Haiti | 2023 | 0.38 |
| Singapore | 2023 | 0.38 |
| Qatar | 2023 | 0.37 |
| Cuba | 2023 | 0.35 |
| Bangladesh | 2023 | 0.33 |
| Burkina Faso | 2023 | 0.32 |
| South Sudan | 2023 | 0.23 |
| Hong Kong SAR, China | 2023 | 0.21 |
| Iraq | 2023 | 0.18 |
| Saudi Arabia | 2023 | 0.11 |
| Algeria | 2023 | 0.09 |
| Benin | 2023 | 0.08 |
| Botswana | 2023 | 0.08 |
| Kuwait | 2023 | 0.08 |
| Niger | 2023 | 0.07 |
| Bahrain | 2023 | 0.06 |
| Chad | 2023 | 0.02 |
| Brunei Darussalam | 2023 | 0.01 |
| Gibraltar | 2023 | 0.00 |
| Libya | 2023 | 0.00 |
| Trinidad and Tobago | 2023 | 0.00 |
| Turkmenistan | 2023 | 0.00 |
Source, methodology and practical use
The figures come from the World Bank World Development Indicators series EG.USE.COMM.CL.ZS. World Bank metadata identifies the IEA Energy Statistics Data Browser as the underlying source and lists the indicator as annual. The official definition can be checked in the World Bank DataBank metadata, while the country series is available through the World Bank Data indicator page.
Used carefully, the indicator is a compact way to compare how prominent non-fossil energy is in national energy systems. It works best as a starting point for identifying large contrasts and unusual cases. Questions about the specific contribution of nuclear, hydropower, solar, geothermal or other sources require additional series, and questions about transition speed require a consistent multi-year time series rather than a cross-section of latest values.
Frequently Asked Questions
What does alternative and nuclear energy share measure?
World Bank indicator EG.USE.COMM.CL.ZS measures the non-fossil share of total energy use, including sources such as hydropower, nuclear, geothermal and solar.
Is this the same as renewable electricity share?
No. Nuclear energy is included and the denominator is total energy use rather than electricity generation, so the concepts are different.
Are all 150 observations from 2024?
No. There are 41 latest observations from 2024, 108 from 2023, and Kosovo has a latest observation from 2014.
Which economy has the highest latest value?
Iceland has the highest latest observation at 89.18% in 2024, followed by Paraguay at 63.56% in 2023.
Related Articles
Green Map creates custom-edited map images using open geographic data sources such as geoBoundaries, Natural Earth, OpenStreetMap, and government open data. These maps are edited visual materials, not raw data files, and are provided for education, documents, presentations, and graphic reference.