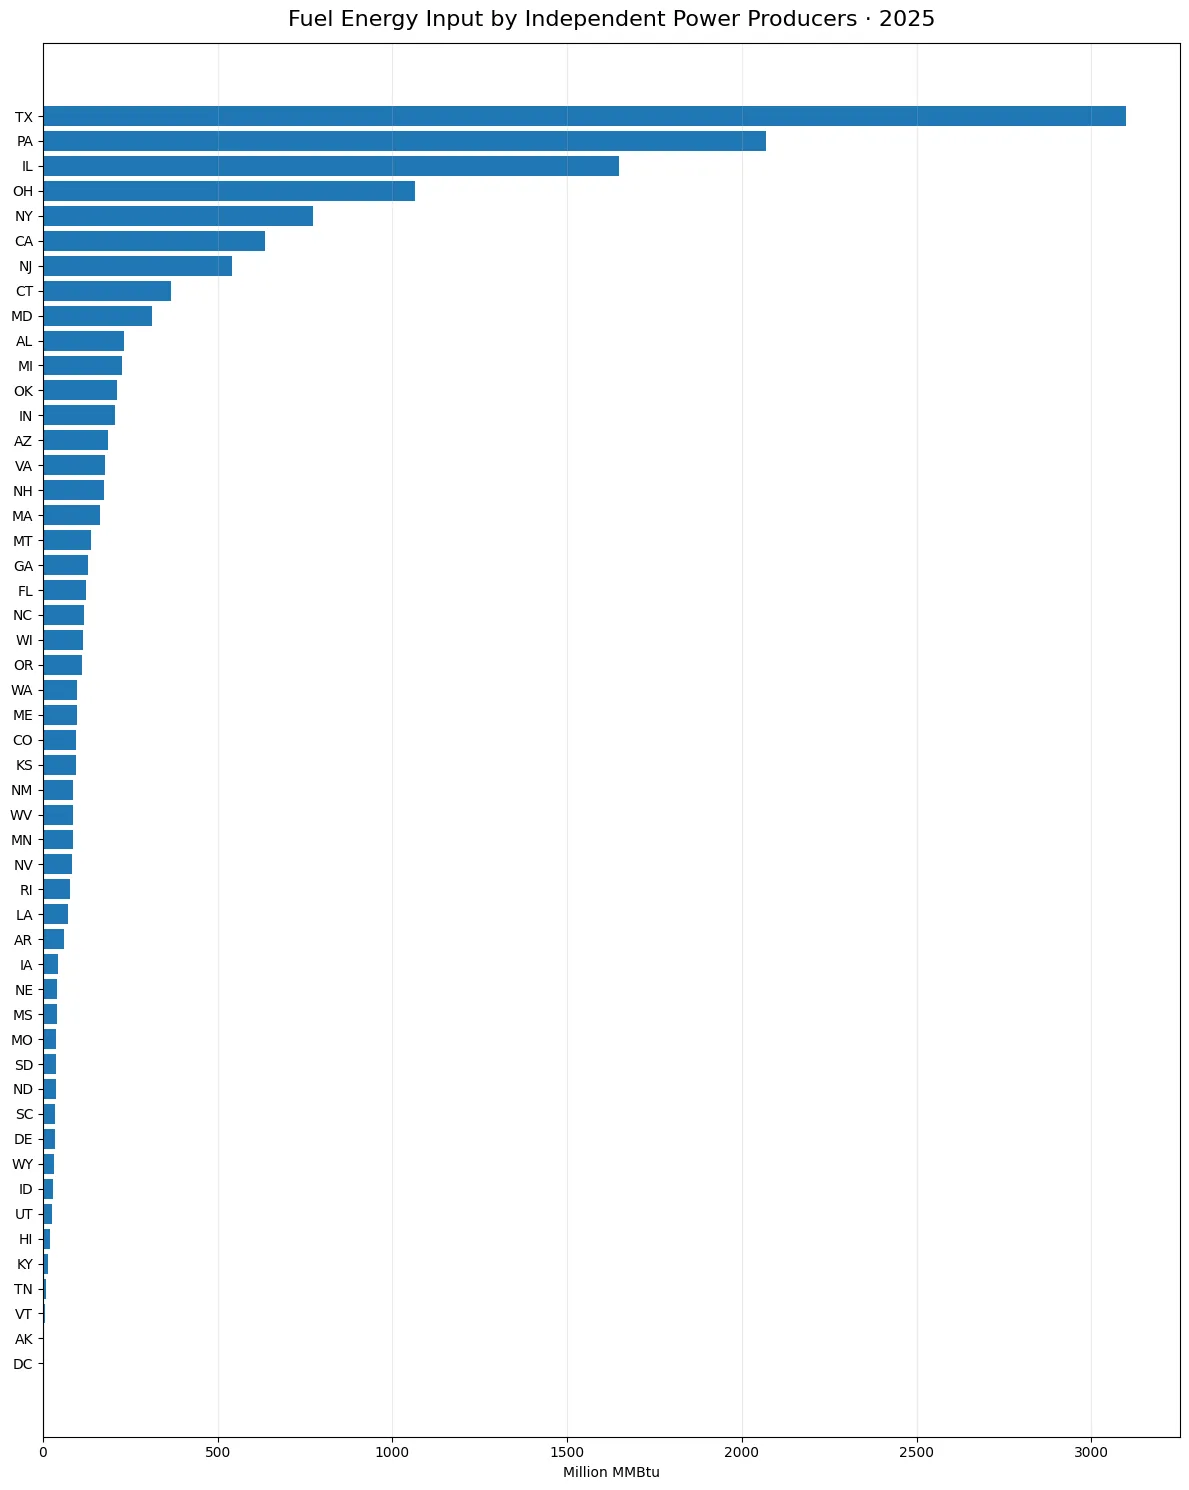
Texas recorded the largest 2025 fuel-energy input among independent power producers in the EIA state-level observations, at 3,098.919 million MMBtu. Pennsylvania followed at 2,068.733, and Illinois at 1,647.881. The 51 observations for the 50 states and the District of Columbia sum to 14,188.640 million MMBtu, making the Texas value 21.84% of that comparable sum. This measure is fuel energy input, not electricity output in MWh.
The source is the U.S. Energy Information Administration Electric Power Operational Data. The comparison fixes the annual frequency, year 2025, fueltypeid=ALL, sectorid=94, and the field total-consumption-btu. All 51 jurisdictions have positive published values. There are no source-missing observations and no reported zeros, so no imputation or zero substitution is needed for the ranking.
Table of Contents
What total-consumption-btu measures
The total-consumption-btu field expresses the energy content of fuels consumed for electricity generation and useful thermal output on a common Btu basis. It is not the same as net generation, which describes electricity produced, and it is not a physical fuel volume such as barrels, short tons, or cubic feet. Using million MMBtu allows different fuel types to be represented on one energy scale.
The ALL fuel facet combines the fuel categories represented in this EIA operational series. Sector 94 identifies Independent Power Producers. Those boundaries matter. The values should not be read as total energy consumption by each state, nor as all fuel consumed by the entire U.S. electric power sector. They describe a specific producer category and a specific EIA operational measure for 2025.
Texas, Pennsylvania, and Illinois make up nearly half
Texas represented 21.84% of the 51-jurisdiction sum. Pennsylvania represented 14.58% and Illinois 11.61%. Together, the three leading jurisdictions accounted for 48.04%. The gap between Texas and Pennsylvania was 1,030.186 million MMBtu. Ohio ranked fourth at 1,064.916, while New York ranked fifth at 771.485 million MMBtu.
These rankings describe where fuel-energy input was largest within the IPP category. They do not, by themselves, explain why one state is higher than another. Plant mix, operating levels, generation technology, combined heat and power activity, and fuel mix can all matter, but the state totals alone do not separate those influences. The most defensible use of this comparison is to describe concentration and scale rather than assign a single cause.
Top 10 state-level values
| Jurisdiction | Code | Million MMBtu | Share of 51-value sum |
|---|---|---|---|
| Texas | TX | 3,098.919 | 21.84% |
| Pennsylvania | PA | 2,068.733 | 14.58% |
| Illinois | IL | 1,647.881 | 11.61% |
| Ohio | OH | 1,064.916 | 7.51% |
| New York | NY | 771.485 | 5.44% |
| California | CA | 635.147 | 4.48% |
| New Jersey | NJ | 539.703 | 3.80% |
| Connecticut | CT | 366.629 | 2.58% |
| Maryland | MD | 311.012 | 2.19% |
| Alabama | AL | 232.890 | 1.64% |
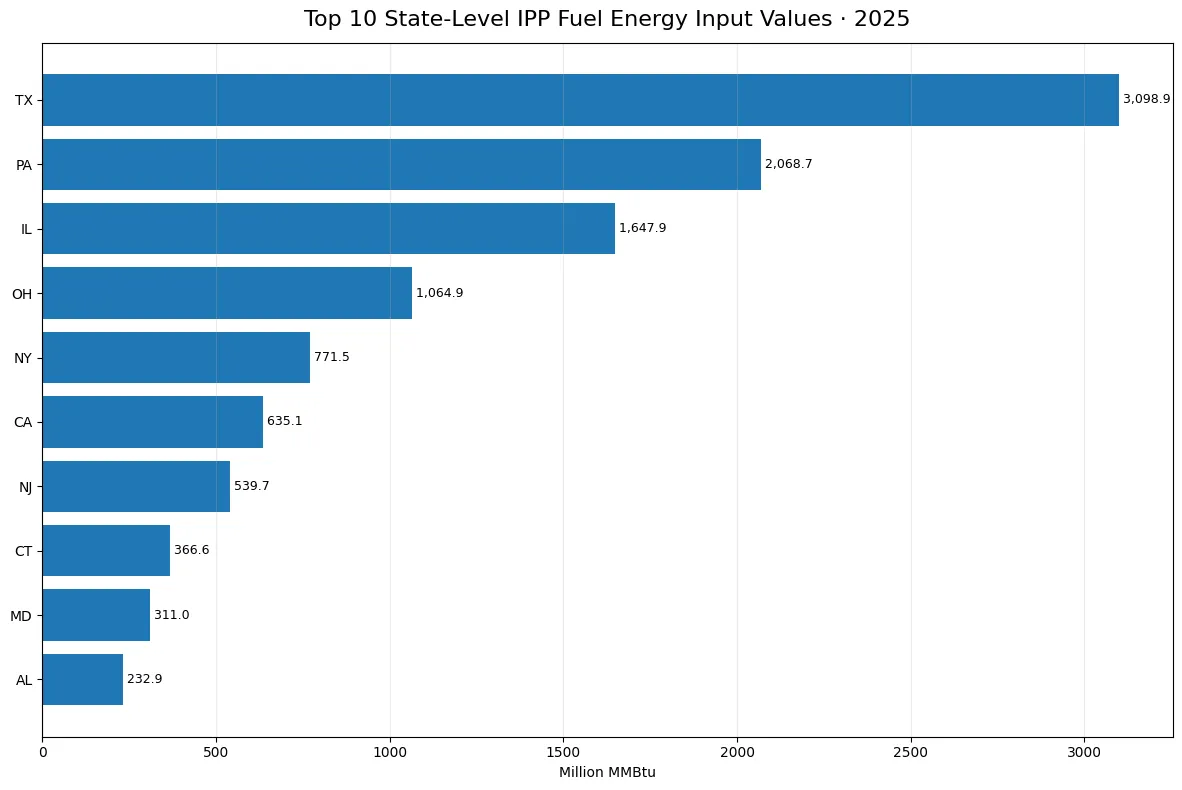
The top 10 jurisdictions account for 75.68% of the comparable total. The median observation is 95.324 million MMBtu, while the mean is 278.209. The large distance between those two summary measures is consistent with a right-skewed distribution in which several very large state values pull the average upward. The first quartile is 37.012 and the third quartile is 197.268 million MMBtu.
Small values are still reported observations
The District of Columbia has the smallest published value at 0.16539 million MMBtu. Alaska is next at 2.399, followed by Vermont at 6.523 and Tennessee at 7.562. None of those observations is missing. Treating a small value as no data would change both the ordering and the distribution, so the published values are retained exactly as reported for the comparison.
A low value should also not be turned into a broader statement that a jurisdiction has no independent power producers or no electricity activity. It means that the EIA value for this particular sector, fuel facet, field, and year is small. Counts of plants, installed capacity, net generation, and individual fuel use are separate measures and can tell different stories.
Why this is different from other EIA fuel-consumption measures
Closely related fields can look almost identical in a title while measuring different things. consumption-for-eg-btu focuses on fuel energy used for electricity generation. consumption-uto-btu focuses on fuel energy used for useful thermal output. total-consumption-btu combines the relevant fuel energy used for electricity generation and useful thermal output. Because this article uses total-consumption-btu, it should not be substituted for either component field.
Sector definitions are equally important. Sector 94 covers Independent Power Producers, while a series using sector 99 would be the All Sectors facet within the same operational system. A state can therefore have a different rank or share when the sector changes even if the fuel facet and year remain the same. Careful comparisons keep the field, sector, fuel facet, time period, and unit fixed.
How concentrated is the 2025 distribution?
The 2025 distribution is highly concentrated at the top. Texas, Pennsylvania, and Illinois together make up 48.04% of the 51-observation sum, and the top 10 reach 75.68%. At the same time, half of the jurisdictions are at or below the median of 95.324 million MMBtu. That combination shows that IPP fuel-energy input is far from evenly distributed across states.
Concentration does not measure efficiency or environmental performance. A state with a large energy input may also have large generation, a different fuel mix, or a different balance between electricity and useful thermal output. To evaluate efficiency, emissions, or cost, the fuel-input data would need to be paired with other measures such as generation, fuel-specific consumption, emissions, capacity, or plant-level operating information.
A practical way to read the numbers
Start with the producer scope: Independent Power Producers. Then confirm that the unit is million MMBtu, not MWh. Next, note that total-consumption-btu includes fuel energy associated with both electricity generation and useful thermal output. Finally, interpret state shares as shares of the sum of these 51 comparable observations, not as shares of all final energy use in the United States. Keeping those distinctions visible makes the metric much easier to compare with neighboring EIA series without mixing different concepts.
Frequently Asked Questions
Which jurisdiction had the largest 2025 independent power producer fuel-energy input?
Texas was highest at 3,098.919 million MMBtu, equal to 21.84% of the sum of the 51 observations.
What does total-consumption-btu measure?
It measures the energy content of fuels consumed for electricity generation and useful thermal output within the specified EIA sector.
Is this the same as electricity generation?
No. Electricity generation is an output measure commonly reported in MWh, while this series measures fuel energy input in million MMBtu.
Were missing values replaced with zero?
No. All 51 jurisdictions have positive reported 2025 values, with no source-missing observations and no reported zeros.
Related Articles
Green Map creates custom-edited map images using open geographic data sources such as geoBoundaries, Natural Earth, OpenStreetMap, and government open data. These maps are edited visual materials, not raw data files, and are provided for education, documents, presentations, and graphic reference.