UNESCO Institute for Statistics (UIS) data for 2023 show where internationally mobile tertiary students whose origin region is North America and Western Europe were reported. The United Kingdom is the largest observed destination with 107,336 students, followed by Germany with 93,329 and the United States with about 80,171. Together, the three account for roughly 38.7% of the sum across 84 reported destinations.
The 84 observations add to approximately 724,805 students. That number is used as the denominator for this observed destination set, not as an automatically complete worldwide total. Destinations absent from the dataset are not assigned zero, and the analysis does not estimate missing country flows.
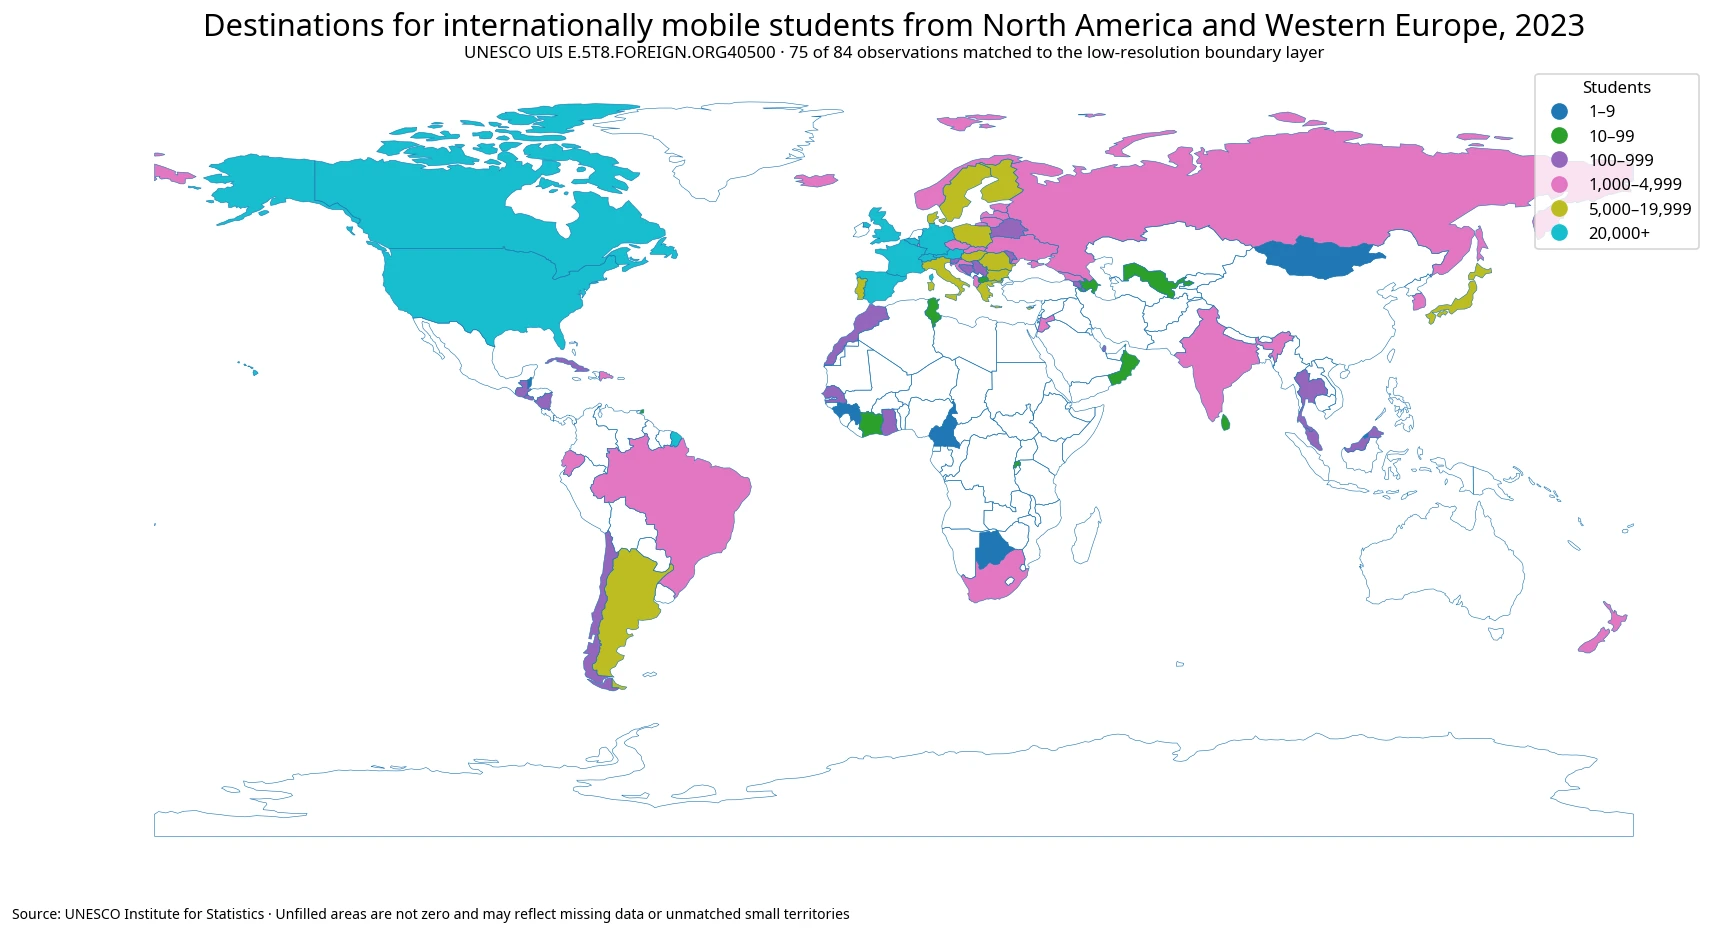
Table of Contents
The United Kingdom, Germany and the United States account for 38.7% of the observed sum
The United Kingdom alone represents 14.8% of the 84-destination observed sum. The top two reach 27.7%, and adding the United States brings the top three to 38.7%. The top five destinations account for 52.4% and the top ten for 73.9%.
Two of the top three destinations are themselves in Western Europe, while the United States is in North America. That does not mean domestic students are being counted. The origin group contains multiple countries, and internationally mobile students must cross an international border to a destination different from their own origin country.
For example, the United Kingdom destination value can include students from other countries within the North America and Western Europe origin region who moved to the United Kingdom for tertiary education. The regional indicator aggregates those origin-country flows, so it cannot tell us which individual origin countries contributed most to the U.K. total.
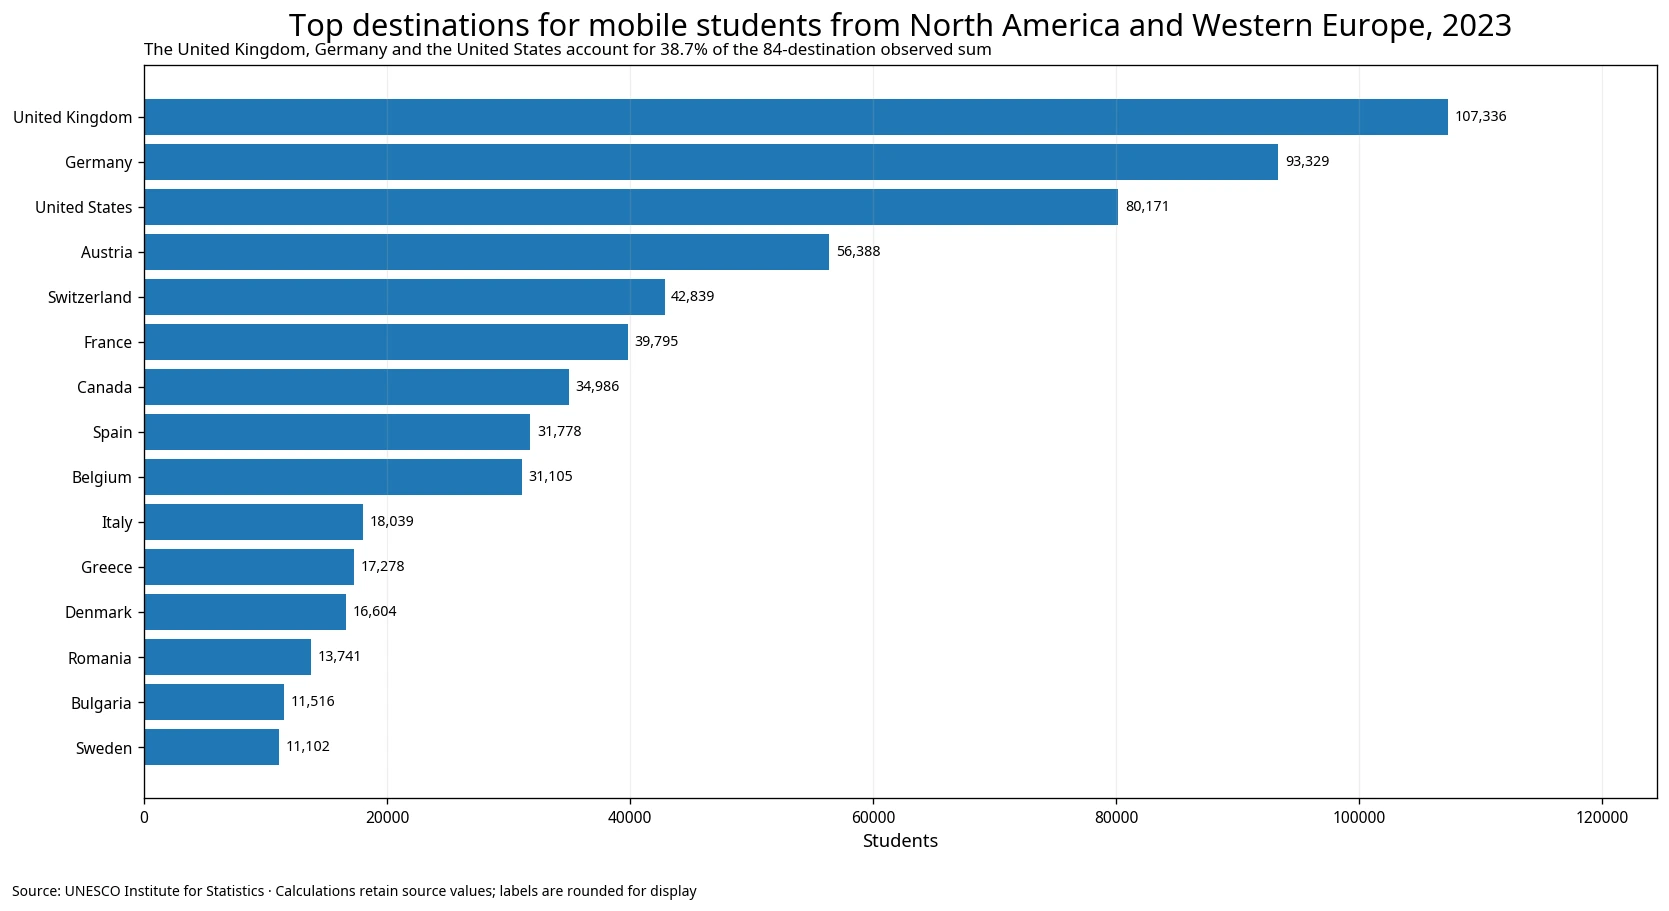
The top 15 are heavily European, with North American and other destinations also present
Europe dominates the upper part of the table. Austria reports about 56,388 students, Switzerland 42,839, France about 39,795, Spain 31,778 and Belgium 31,105. Italy, Greece, Denmark, Romania, Bulgaria and Sweden also appear in the top 15.
| Rank | Destination | Students in 2023 | Share of 84-row sum |
|---|---|---|---|
| 1 | United Kingdom | 107,336 | 14.8% |
| 2 | Germany | 93,329 | 12.9% |
| 3 | United States | 80,171 | 11.1% |
| 4 | Austria | 56,388 | 7.8% |
| 5 | Switzerland | 42,839 | 5.9% |
| 6 | France | 39,795 | 5.5% |
| 7 | Canada | 34,986 | 4.8% |
| 8 | Spain | 31,778 | 4.4% |
| 9 | Belgium | 31,105 | 4.3% |
| 10 | Italy | 18,039 | 2.5% |
| 11 | Greece | 17,278 | 2.4% |
| 12 | Denmark | 16,604 | 2.3% |
| 13 | Romania | 13,741 | 1.9% |
| 14 | Bulgaria | 11,516 | 1.6% |
| 15 | Sweden | 11,102 | 1.5% |
Canada reports 34,986 and ranks seventh, making it one of the largest North American destinations in the extract. The United States ranks third. Because the origin group spans several countries, these observations represent cross-border movements into the United States and Canada from other origin countries in the regional grouping.
Argentina, with 5,956 students, ranks 19th and is the largest South American destination in the upper part of the table. The distribution therefore extends beyond Europe and North America even though the largest volumes are concentrated in those regions.
The mean of 8,629 is far above the median of 1,336.5
The simple mean across 84 destinations is about 8,629 students, while the median is only 1,336.5. The mean is about 6.5 times the median because the largest destination observations pull the arithmetic average sharply upward.
The first quartile is 198 students and the third quartile is 5,119. Forty-four destinations have at least 1,000 students, while 18 fall below 100 and 8 are below 10. The observed distribution therefore combines several major destination systems with a long tail of small flows.
Small rank changes at the bottom should not be interpreted with the same weight as gaps among the largest destinations. A difference between one and four students can move a low-end rank but has almost no effect on the overall distribution. The top ten containing nearly three quarters of the observed sum is a much more consequential pattern.
North America and Western Europe is a regional origin aggregate, not a single nationality
The UIS indicator groups several origin countries into one regional category: North America and Western Europe. The United Kingdom’s 107,336 therefore cannot be reassigned to U.S. students, Canadian students or any other single origin country using this dataset alone.
The same limitation applies to Germany, Austria and every other destination. Country-specific origin composition requires a different series that fixes the origin as an individual country, such as Canada-origin or Netherlands-origin mobility indicators.
The regional aggregate is useful for describing broad destination structure, but it deliberately hides bilateral origin-destination detail. This analysis therefore stays at the regional-origin level rather than inferring individual country contributions.
Internationally mobile students are not simply all foreign citizens
UIS defines internationally mobile students around physical educational movement across an international border. The destination country differs from the country of origin, and the student moved for the purpose of education.
For tertiary students, the preferred origin criterion is the country where the student obtained the upper-secondary qualification used before tertiary entry. If that cannot be used, usual or permanent residence may be substituted, and citizenship is recommended only as a last-resort proxy.
That means the North America and Western Europe origin group is not automatically identical to a citizenship-based count of all foreign passport holders from those regions. Remote study without physical cross-border movement also does not qualify on that basis alone.
The 84-destination sum should remain an observed-set total
The dataset contains 84 destination observations for 2023. An omitted country cannot safely be assumed to have zero students, because host-system reporting, data availability and classification can differ.
The approximately 724,805-student sum is therefore used only for internal concentration measures within the observed set. It supports statements such as the United Kingdom at 14.8%, the top three at 38.7% and the top ten at 73.9% of the 84-row sum.
It should not be relabeled as an official global total without a separate aggregate that establishes complete destination coverage. Missing destinations are not zero-filled.
Unfilled areas on the map are not zero
75 of the 84 statistical observations match independent polygons in the low-resolution world boundary layer. The unmatched observations are mostly small states, islands or separately reported territories that are difficult to show at this map resolution.
Those values remain in the tables, mean, median and concentration calculations. A missing map polygon is a visualization limitation, not evidence of zero students or missing statistical data.
The map uses count bands rather than one continuous linear scale because the largest values exceed 90,000 while many destinations are below 1,000. Banding keeps middle-sized observations visible instead of allowing a few very large destinations to dominate the entire color range.
A mid-sized peer destination
The Republic of Korea reports 2,514 students, ranking 34th among the 84 observations and representing about 0.3% of the observed sum. It is one peer destination within the global distribution rather than an organizing focus of the analysis.
A 2023 cross-section compares destination size, not change over time
All observations use the same 2023 reference year, which gives the cross-country comparison a consistent time basis. The United Kingdom, Germany, the United States and the other destinations are not being compared with different historical years.
A single-year cross-section cannot show whether the U.K. share is rising, whether Germany is gaining students, or whether changes in policy altered the destination pattern. Those questions require comparable observations across multiple years.
Large destination counts also do not directly measure education quality, affordability or student satisfaction. The indicator reports where students were observed, not why they chose those destinations.
Data source and calculation method
Country values come from UNESCO Institute for Statistics indicator E.5T8.FOREIGN.ORG40500, “Inbound internationally mobile students from North America and Western Europe, both sexes (UIS estimate) (number),” using the 2023 NATIONAL observations in this comparison. Both sexes means male and female students are combined.
- UNESCO UIS official API — E.5T8.FOREIGN.ORG40500
- UNESCO UIS Data Browser Glossary — internationally mobile students
The observed sum, mean 8,629, median 1,336.5, quartiles and destination concentration shares are calculated directly from the 84 non-missing observations. Source decimals are retained during calculation and rounded only for displayed student labels. Missing destinations are not assigned zero, and individual origin-country shares are not inferred.
The strongest conclusion supported by this dataset is that the 2023 destination distribution for students from the North America and Western Europe origin group is highly concentrated in a relatively small set of major destinations. Bilateral origin-country flows, a complete worldwide total, long-term trends and causal explanations require additional data.
Frequently Asked Questions
Are the country rows destinations for students from North America and Western Europe?
Yes. The origin is fixed as the North America and Western Europe region, and each row is a destination reporting internationally mobile students from that origin group.
If the United Kingdom or United States appears as a destination, are domestic students included?
No. Internationally mobile students must cross an international border to a destination different from their own origin country. A destination can still lie inside the broader origin region.
Is the 84-destination sum the complete worldwide total?
Not necessarily. It is the sum of the 84 observations in this extract. Destinations without an observation are not treated as zero.
Can this dataset separate U.S.-origin or Canadian-origin student destinations?
No. It aggregates multiple origin countries into one regional origin group. Country-specific origin series are required for bilateral destination patterns.
Related Articles
- Canada-Origin Mobile Tertiary Students 2023 | Top 3 Destinations 80.1%
- Students from the Netherlands Abroad 2021 | Top Destinations
- Russian Student Destinations in 2023 | 70 Reported Destinations
Green Map creates custom-edited map images using open geographic data sources such as geoBoundaries, Natural Earth, OpenStreetMap, and government open data.
These maps are edited visual materials, not raw data files, and are provided for education, documents, presentations, and graphic reference.