GNI per capita and GDP per capita are often shown side by side, but they measure different economic concepts. This article uses World Bank indicator NY.GNP.PCAP.CD: GNI per capita, Atlas method (current US$). Gross national income starts from income generated by residents and incorporates net primary income flows with the rest of the world. Economies with substantial cross-border labor, investment, or corporate income can therefore show a different GNI-per-person position from their GDP-per-person position.
The Atlas method also changes how national-currency income is converted to U.S. dollars. Instead of relying only on the exchange rate of one year, the World Bank uses a conversion factor based on the current year and the two preceding years, adjusted for inflation differences. The aim is to reduce the effect of abrupt exchange-rate movements on cross-country income comparisons. The resulting figure is still expressed in current U.S. dollars; it is not a constant-price series and it is not a purchasing-power-parity measure.
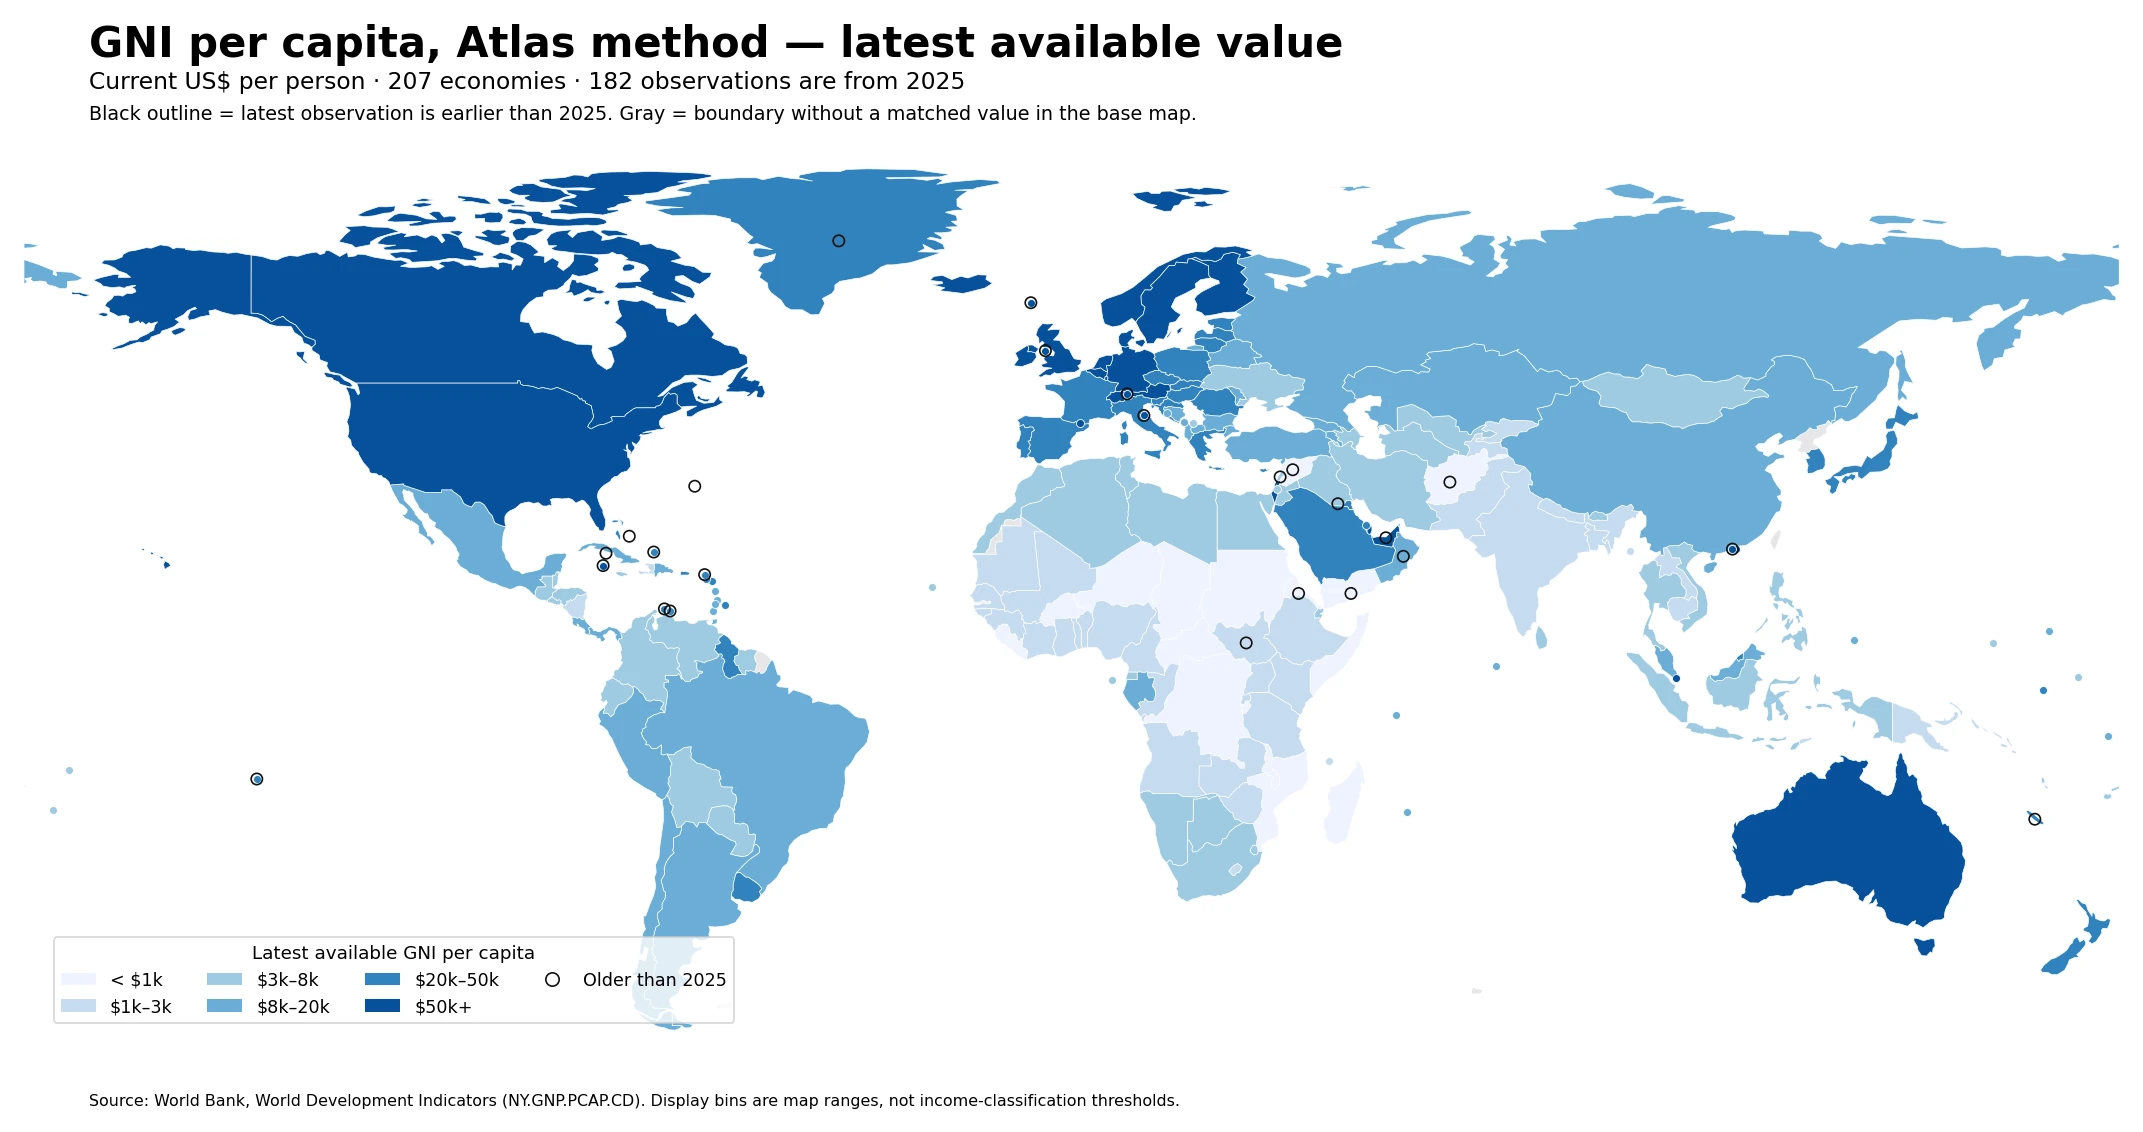
The latest-available dataset contains 207 economies. 182 observations are from 2025, 16 from 2024, and nine from 2023 or earlier. The map uses the latest available value for coverage, while older observations are outlined so they are not mistaken for a fully synchronized 2025 cross-section.
Table of Contents
Why the Atlas conversion matters
A market exchange rate can change sharply even when domestic incomes move much less. A one-year dollar conversion can therefore make an economy appear to jump or fall because of currency movements rather than a similarly large change in underlying income. The Atlas approach smooths part of that volatility by looking across three years and adjusting for relative inflation. This makes the indicator useful for broad international comparisons of nominal income levels.
The method should not be confused with PPP conversion. Purchasing-power-parity measures explicitly adjust for differences in price levels across economies and are expressed in international dollars. Atlas-method GNI remains a current-U.S.-dollar measure built from exchange-rate conversion. The two answer related but different questions, so their rankings can diverge.
The 2025 median is $7,460 per person
Among the 182 economies with a 2025 observation, the median Atlas-method GNI per capita is $7,460 and the mean is $17,804. The first quartile is about $2,810, while the third quartile is about $24,402. The mean is much higher than the median because a relatively small group of very high-income economies stretches the upper tail of the distribution.
| 2025 GNI per capita range | Economies |
|---|---|
| < $1k | 14 |
| $1k–3k | 36 |
| $3k–8k | 46 |
| $8k–20k | 35 |
| $20k–50k | 30 |
| $50k+ | 21 |
Fourteen 2025 observations are below $1,000 per person, while 21 are at or above $50,000. The map shows broad geographic clustering, with many high values in northern and western Europe, North America, and several Gulf and Asian economies. Much of Sub-Saharan Africa falls into the lower ranges, although the map should be read as a country-level income indicator rather than a direct measure of household living standards.
Switzerland leads the 2025 observations
Switzerland records the highest 2025 value at $110,330 per person, followed by Norway at $97,310 and Luxembourg at $95,720. Iceland, the United States, Ireland, Singapore, and Denmark are also above $75,000. These figures describe national income per resident; they are not average salaries and they do not reveal how income is distributed across households.
| Economy | 2025 GNI per capita, Atlas method |
|---|---|
| Switzerland | $110,330 |
| Norway | $97,310 |
| Luxembourg | $95,720 |
| Iceland | $89,220 |
| United States | $88,810 |
| Ireland | $87,360 |
| Singapore | $81,760 |
| Denmark | $77,190 |
| Qatar | $74,330 |
| Netherlands | $68,530 |
Cross-border income flows are especially relevant when interpreting some of these economies. GNI adjusts GDP for primary income received from and paid to the rest of the world, so economies with large multinational-company activity, investment income, or commuter flows can differ materially from a GDP-per-capita ranking.
The lowest 2025 values are concentrated in Sub-Saharan Africa
Burundi has the lowest 2025 observation at $240 per person. The Central African Republic and Madagascar are both at $560, Mozambique is at $570, and Malawi is at $600. Somalia is at $640 and the Democratic Republic of the Congo at $720. These figures signal very low national income per resident in nominal dollar terms, but they should not be converted directly into a poverty rate or an estimate of what the typical household earns.
| Economy | 2025 GNI per capita, Atlas method |
|---|---|
| Burundi | $240 |
| Central African Republic | $560 |
| Madagascar | $560 |
| Mozambique | $570 |
| Malawi | $600 |
| Somalia, Fed. Rep. | $640 |
| Congo, Dem. Rep. | $720 |
| Niger | $750 |
| Liberia | $830 |
| Sierra Leone | $830 |
A fuller assessment of living standards needs additional measures such as median household income, consumption, poverty rates, employment, health, education, and local prices. GNI per capita is valuable as a broad macroeconomic benchmark, but it does not describe distribution within a country.
How GNI differs from GDP
GDP measures production taking place within an economy. GNI adjusts that concept for net primary income from abroad: compensation of employees, investment income, and related flows received by residents minus comparable income paid to nonresidents. When those cross-border flows are large, GNI per capita can sit noticeably above or below GDP per capita. That is why this Atlas-method map is not a duplicate of a current-dollar GDP-per-capita map.
The “current US$” label is another important limitation. The series is not adjusted to hold purchasing power constant over time. A value of $20,000 in an earlier year does not represent the same real purchasing power as $20,000 today. For long-run growth analysis, constant-price or real-growth indicators are more appropriate.
Twenty-five latest observations are earlier than 2025
Of the 207 economies, 25 do not have a 2025 observation in the supplied latest-available series. Sixteen are from 2024 and nine are from 2023 or earlier. The oldest values include Greenland in 2007, Liechtenstein in 2009, Eritrea in 2011, South Sudan in 2015, Yemen in 2018, Cuba in 2019, and the Syrian Arab Republic in 2022. San Marino and the Isle of Man have 2023 values.
| Economy | Latest year | GNI per capita, Atlas method |
|---|---|---|
| Greenland | 2007 | $34,800 |
| Liechtenstein | 2009 | $116,380 |
| Eritrea | 2011 | $650 |
| South Sudan | 2015 | $1,050 |
| Yemen, Rep. | 2018 | $740 |
| Cuba | 2019 | $9,010 |
| Syrian Arab Republic | 2022 | $720 |
| Isle of Man | 2023 | $87,030 |
| San Marino | 2023 | $53,910 |
Those older observations remain useful for showing where the latest available value sits, but they should not be treated as if they were measured under 2025 conditions. For strict cross-sectional ranking, the 182 economies observed in 2025 form the more consistent comparison set.
Three cautions when reading the map
- The color ranges are display bins for this map; they are not the World Bank’s official income-group classification thresholds.
- Black outlines mark latest observations earlier than 2025, so equal colors can still refer to different reference years.
- The Atlas method smooths exchange-rate effects but does not make the series a PPP or constant-price measure.
Source: World Bank World Development Indicators, NY.GNP.PCAP.CD. The indicator is GNI converted to U.S. dollars using the Atlas method and divided by midyear population. This article uses the most recent non-empty observation supplied for each economy.
Frequently Asked Questions
What is GNI per capita using the Atlas method?
It is gross national income converted to current U.S. dollars with the World Bank Atlas conversion factor and divided by midyear population. The conversion uses a three-year exchange-rate framework adjusted for inflation differences.
Why can GNI per capita differ from GDP per capita?
GDP measures production within an economy, while GNI adjusts for net primary income flows between residents and the rest of the world. Large cross-border labor or investment income can create meaningful differences.
Is Atlas-method GNI a PPP measure?
No. Atlas-method GNI remains a current-U.S.-dollar measure designed to smooth exchange-rate effects. PPP measures adjust for differences in price levels and are expressed in international dollars.
Related Articles
Green Map creates custom-edited map images using open geographic data sources such as geoBoundaries, Natural Earth, OpenStreetMap, and government open data.
These maps are edited visual materials, not raw data files, and are provided for education, documents, presentations, and graphic reference.