Government expenditure on tertiary education in US dollars answers a simple but easily misread question: how large is the public spending total for tertiary education when national-currency expenditure is converted into a common currency? UNESCO Institute for Statistics (UIS) indicator X.US.5T8.FSGOV reports general-government expenditure on tertiary education in millions of US dollars. General government is broader than a central education ministry; it can include central, regional and local government. The spending concept covers current expenditure, capital expenditure and transfers, and funding transferred from international sources to government can be included when it is spent on tertiary education.
The verified 2022 comparison set contains 77 country or area observations. That does not make the series a simple ranking of which government “cares most” about higher education. The amounts are nominal US-dollar values. They reflect the scale of each economy and tertiary system, and they also reflect the exchange rate used to convert national-currency expenditure into US dollars. A large country can have a very large total while devoting a modest share of its economy to tertiary education; a small country can devote a high share of public resources while still recording a much smaller dollar total.
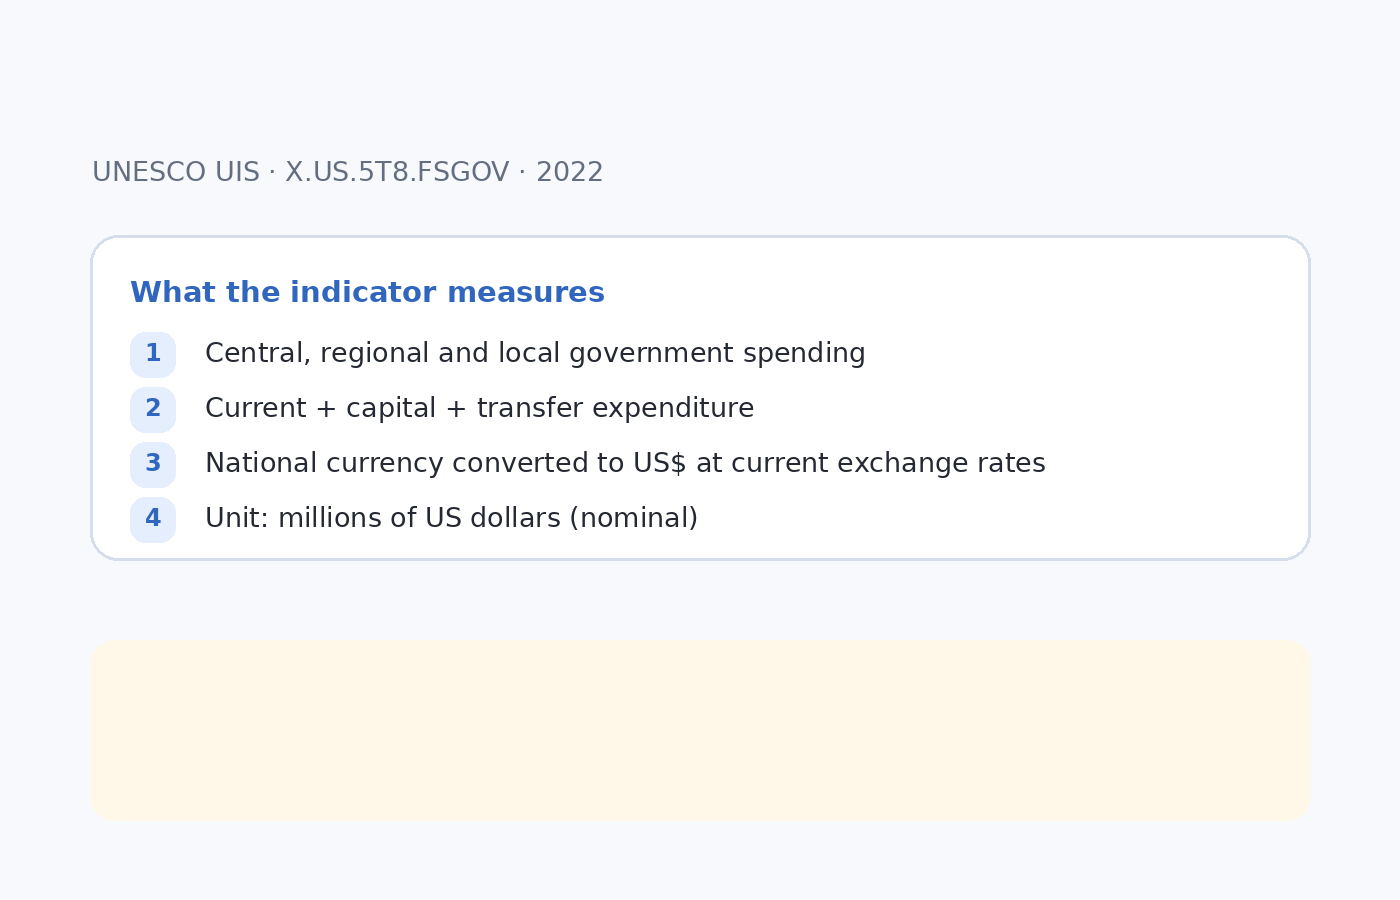
Table of Contents
The spending concept is broader than a central education-ministry budget
UIS education-finance statistics use a general-government concept. Depending on national institutions, tertiary-education spending can be recorded by central, state or regional, and local authorities. The indicator is not limited to routine university operating grants. Current spending such as compensation and administration, capital spending on buildings or equipment, and qualifying transfers can be part of the total. Transfers from international sources to government can also be included if they finance expenditure within the indicator’s scope.
This broad concept matters because tertiary education is financed differently across countries. Some systems are highly centralized, while others rely heavily on states, provinces or municipalities. Using general government is intended to make these structures more comparable, but reporting coverage can still differ. A known limitation in education-finance statistics is that some country data can be concentrated in the ministry of education and may not fully capture education-related spending by other ministries. Small differences in reported totals should therefore not be treated as perfectly precise measures of fiscal effort without checking national metadata.
Tertiary education corresponds to ISCED levels 5 through 8
The 5T8 component of the indicator code refers to tertiary education across ISCED levels 5, 6, 7 and 8. In broad terms, this includes short-cycle tertiary programmes, bachelor’s or equivalent programmes, master’s or equivalent programmes, and doctoral or equivalent programmes. National institution names do not map perfectly across countries, which is why international statistics use ISCED rather than assuming that every “university,” “college,” or professional institute has the same role.
The indicator should therefore not be relabelled as spending only on four-year universities. It also should not be confused with government expenditure on all education, which includes pre-primary, primary and secondary levels. Tertiary expenditure is one part of the overall public-education financing picture. Comparing the tertiary amount with total education spending can be informative, but only when the reference year and coverage are aligned.
The US-dollar series is nominal, so inflation and exchange rates matter
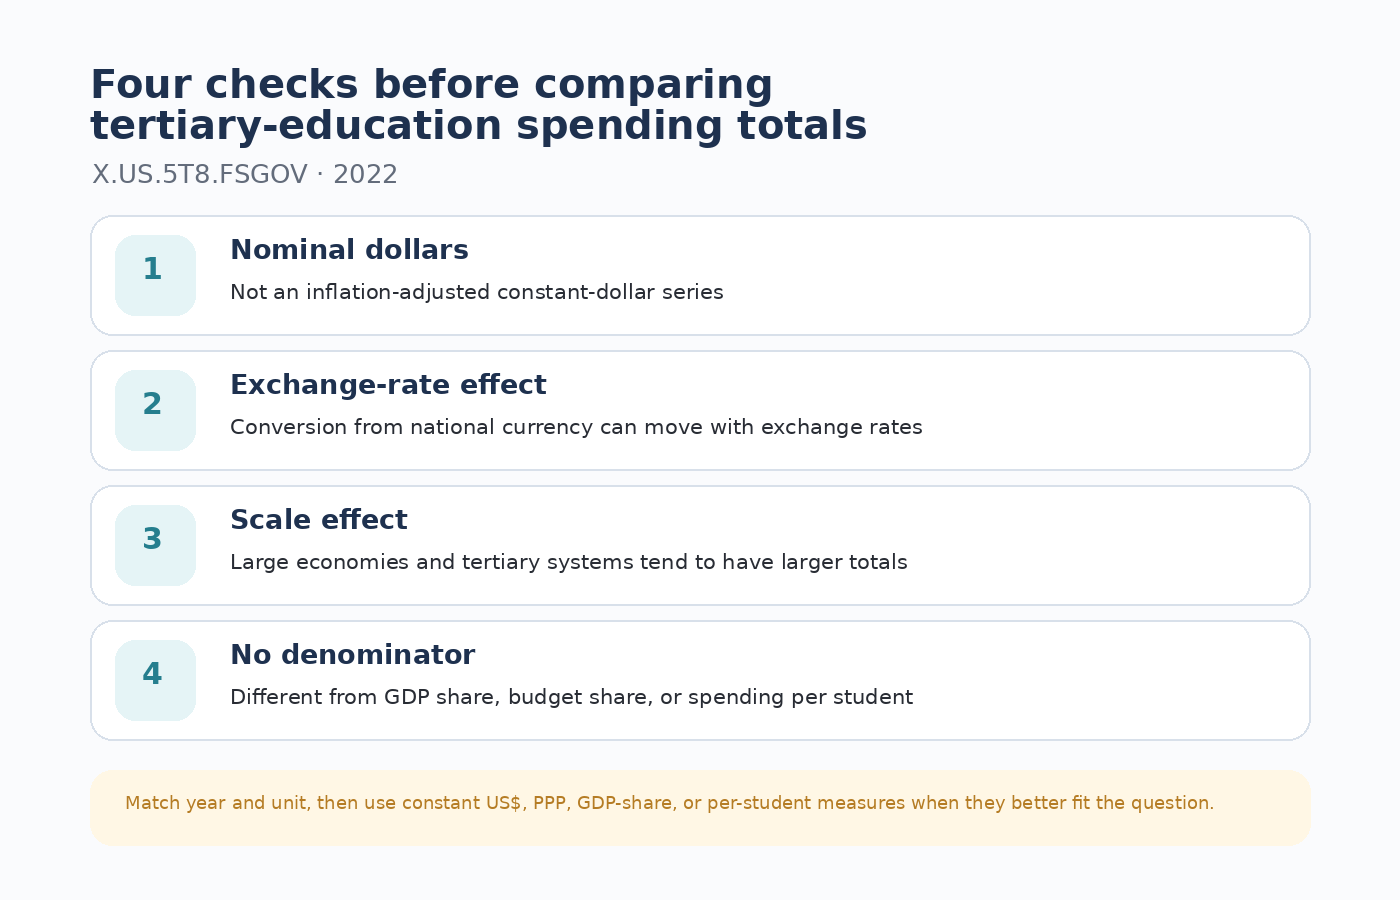
X.US.5T8.FSGOV is a current or nominal US-dollar series rather than a constant-dollar series. Government spending is first measured in national currency and then converted to US dollars. If the national currency weakens against the dollar, the dollar value can fall even if the domestic-currency budget changes little. If the currency strengthens, the converted dollar amount can rise. That means a year-to-year change in the US-dollar series combines fiscal decisions with price and currency effects.
For a time-series question such as “did real public spending on tertiary education increase?”, a constant-US-dollar indicator can be more suitable because it adjusts for inflation according to the relevant deflator convention. For cross-country purchasing-power comparisons, a PPP-dollar series can reduce differences caused by price levels. Neither alternative is universally better: the right unit depends on whether the question is about nominal fiscal scale, real change over time, or purchasing power.
A larger total does not automatically mean a higher policy priority
Absolute expenditure totals are strongly related to scale. Countries with large populations, large economies and large tertiary systems often need much larger budgets simply to operate those systems. A small economy can spend a high percentage of GDP or of the government budget on tertiary education while still recording a small US-dollar total. The statement “country A spends more dollars than country B” therefore answers a different question from “country A gives tertiary education a higher fiscal priority.”
To compare fiscal effort relative to economic size, expenditure as a share of GDP is more informative. To compare the place of education within the public budget, expenditure as a share of total government expenditure is useful. To compare resources with the number of learners, expenditure per student is more relevant. The nominal dollar total remains valuable, but it should be treated as one dimension of education finance rather than a universal score.
| Measure | Main question | Main caution |
|---|---|---|
| Nominal US$ total | How large is the spending total after conversion to dollars? | Strongly affected by scale, inflation and exchange rates |
| Constant US$ total | How has spending changed after adjusting for inflation? | Check the constant-price base and deflator convention |
| PPP$ total | How large is the spending total after accounting for purchasing-power differences? | Not the same as a market-exchange-rate dollar amount |
| Share of GDP | How large is spending relative to the economy? | Changes in GDP can move the ratio |
| Per-student spending | How much public resource is associated with each student? | Student population and coverage definitions matter |
The 77 observations in 2022 define the reporting set, not a complete world total
The 2022 series contains 77 country or area observations in the verified set. A missing observation is not a zero. It can indicate that a comparable value was not reported or was not available for the same reference year. Mapping missing countries into a zero-dollar class would turn absence of data into a false statistical statement. The same principle applies to global totals: adding the 77 available values would produce the total for the reporting set, not necessarily total government tertiary-education expenditure for the entire world.
Summary statistics also need careful labels. An unweighted country mean gives each reporting country one equal observation regardless of population, GDP or tertiary enrolment. Absolute spending distributions are often highly skewed because a small number of large economies can account for a large share of the total. Medians can describe a typical reporting-country value, but they still do not answer what the average student or the average person experiences.
Time comparisons should separate nominal growth from real resource growth
A 10% increase in a nominal dollar spending series does not mean that universities received 10% more real resources. Domestic inflation can increase salaries, construction costs, energy bills and equipment prices. Exchange-rate movements can amplify or offset those domestic changes after conversion to dollars. A government may need a much larger nominal budget simply to maintain the same volume of services. Constant-price indicators are therefore useful when the purpose is to study real changes through time.
Nominal US-dollar totals still have an important role. They provide an intuitive common-currency measure of fiscal scale for a specific period and can be useful when comparing countries with similar economic structures or when discussing the size of international financing. Their limitation is not that they are “wrong,” but that they answer a narrower question than many readers assume.
Spending inputs do not directly measure educational outcomes or efficiency
Government expenditure is an input measure. It does not directly measure graduation, attainment, access, research quality, employment outcomes or learning. Two countries can spend similar amounts but operate systems with very different enrolment, wage levels, geographic costs, research intensity and public-private mixes. A high spending total does not prove that resources are used efficiently, and a lower total does not prove that a system performs poorly.
A stronger analysis combines finance indicators with measures of participation and outcomes. Tertiary enrolment shows the scale of current participation, graduation indicators describe educational output, attainment measures the stock of qualifications among adults, and private-enrolment shares help describe the institutional mix. Per-student spending connects public expenditure to system size. Aligning these measures by year and coverage can reveal more than any single spending figure.
Source and comparison notes
The indicator is UNESCO UIS X.US.5T8.FSGOV, government expenditure on tertiary education in millions of nominal US dollars. UIS education-finance definitions describe the amount as general-government current, capital and transfer expenditure on tertiary education converted from national currency into US dollars. Related World Bank education-statistics products also distribute UIS finance indicators. When comparing countries, match the reference year, keep missing values separate from zero, and consider whether a denominator-based measure better answers the question. For example, Green Map’s government education spending as a share of GDP article shows how a ratio answers a different question from an absolute dollar total.
Frequently Asked Questions
Is government tertiary-education expenditure in US dollars inflation-adjusted?
No. X.US.5T8.FSGOV is a nominal US-dollar series. A constant-US-dollar series is more suitable for comparing real changes over time.
Does a larger US-dollar total mean a country gives tertiary education a higher priority?
Not necessarily. Absolute totals are strongly affected by population, economic size and the size of the tertiary system. GDP-share or government-budget-share measures answer the priority question more directly.
Do countries with missing data have zero government spending?
No. Missing data must remain distinct from zero. A missing 2022 observation can mean that a comparable value was not reported or available.
What education levels are included in tertiary education here?
The 5T8 scope corresponds to ISCED levels 5 through 8: short-cycle tertiary, bachelor or equivalent, master or equivalent, and doctoral or equivalent programmes.
Related Articles
- Government Education Spending as % of GDP | World Map
- Private Tertiary Enrolment Share by Country
- Education-Field Share Among Tertiary Graduates by Country
Green Map creates custom-edited map images using open geographic data sources such as geoBoundaries, Natural Earth, OpenStreetMap, and government open data.
These maps are edited visual materials, not raw data files, and are provided for education, documents, presentations, and graphic reference.