Comparing household consumption across countries with market exchange rates leaves large price-level differences in the numbers. World Bank indicator NE.CON.PCAP.PP.CD approaches the comparison differently: it takes final consumption expenditure by households and nonprofit institutions serving households (NPISHs), divides it by population, and expresses the result in purchasing-power-parity (PPP) current international dollars. The 186 latest available country and area observations in the supplied data range from about $474 to $61,250 per person.
Those 186 observations are not a synchronized 2025 cross-section. There are 124 observations dated 2025 and 28 dated 2024, while 34 are older. The oldest retained observation is from 2004. The first map therefore shows the latest available value for each economy, not a single-year world ranking. For tighter like-for-like comparisons, the 2025 subset is analyzed separately below.
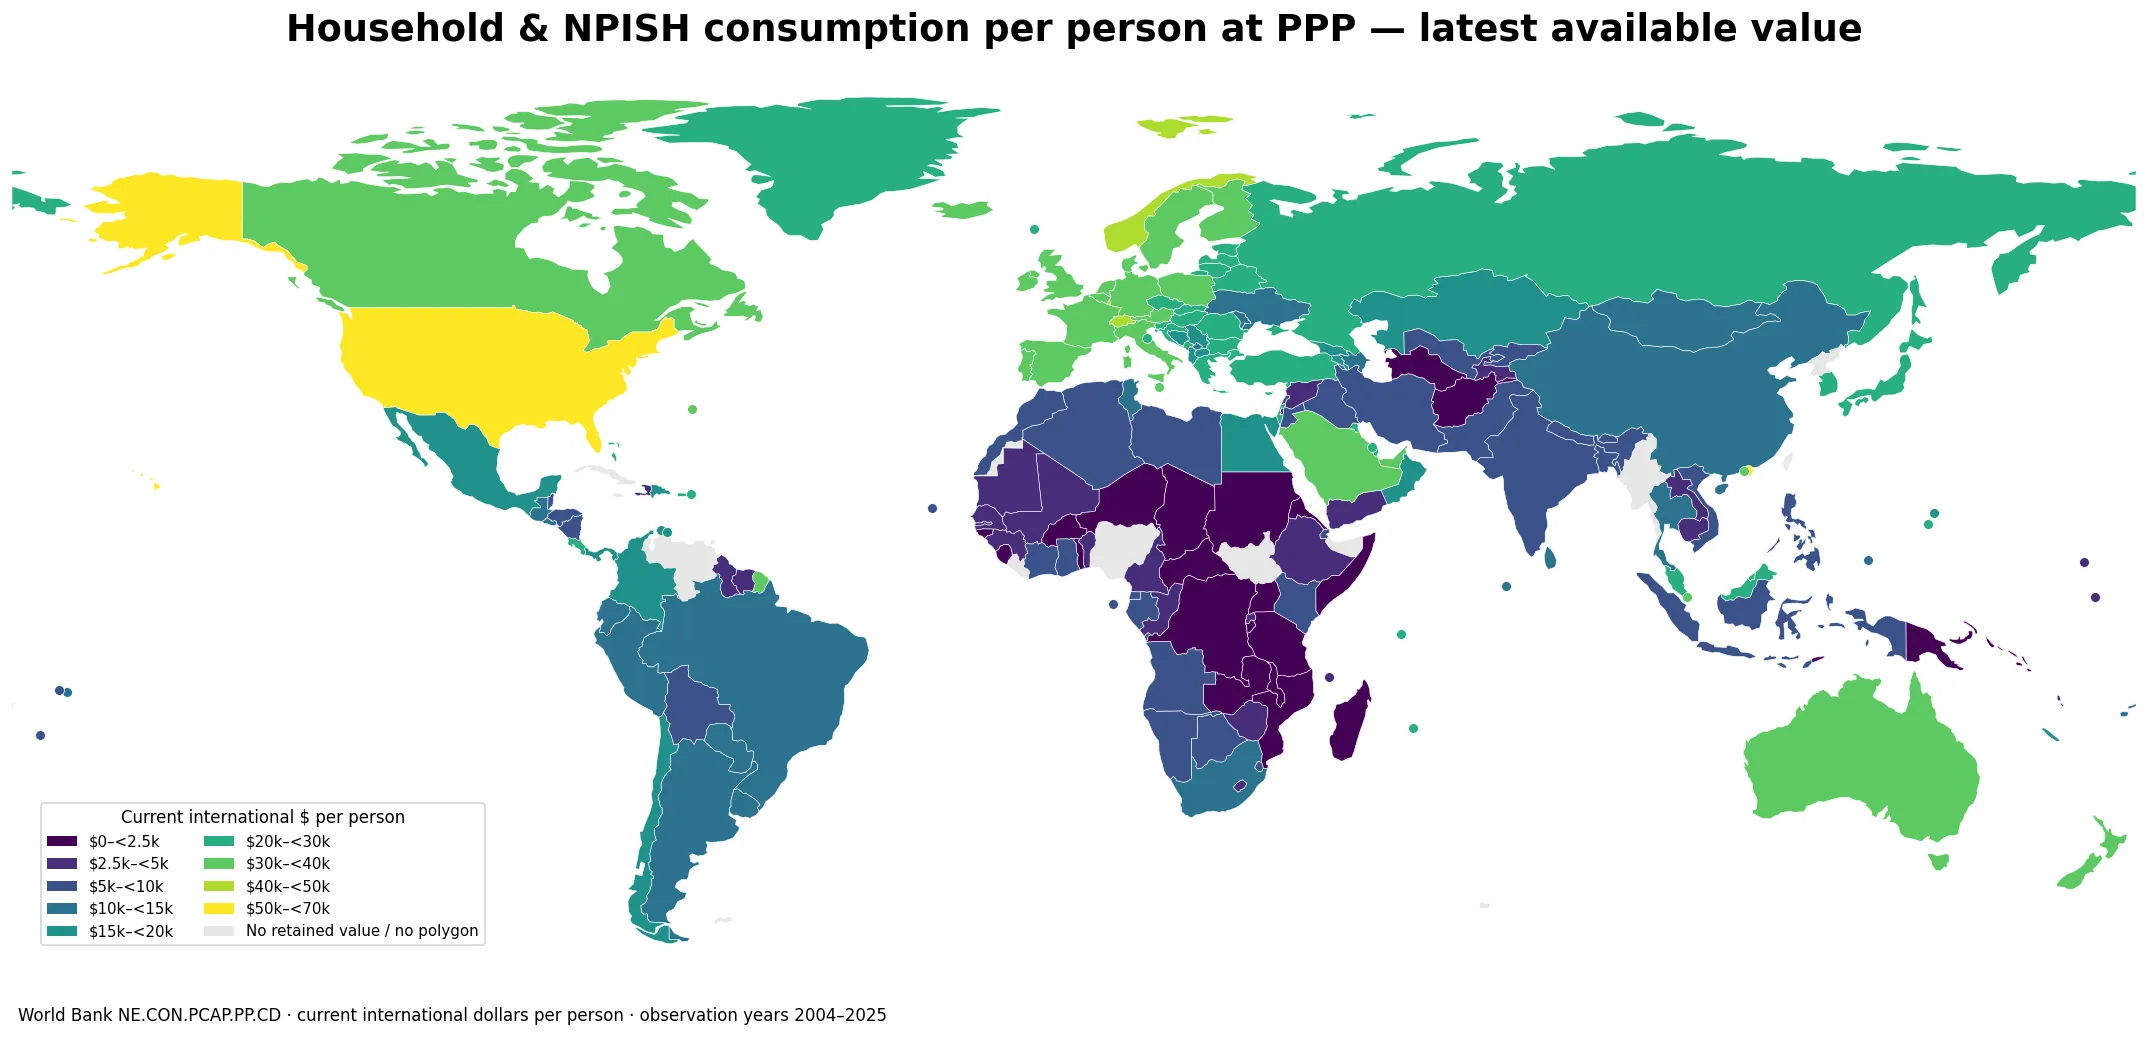
Table of Contents
The indicator measures final consumption per person, not household income
The numerator covers goods and services used by the household and NPISH sectors for the direct satisfaction of human needs or wants. Because NPISHs are included, the concept is broader than purchases made directly by individual households at shops or through payment cards. Dividing the national-accounts total by population gives a per-person measure, and PPP conversion reduces the distortion created by cross-country differences in price levels.
The word “current” matters. Current international dollars are not a constant-price time series. They are useful for comparing levels across economies around the same period, but changes across distant years can reflect both changes in real consumption and changes in prices or PPP conversion factors. A constant-PPP series or survey-based real consumption measure is more appropriate when the question is long-run real growth.
Most observations are recent, but “latest available” still spans 2004–2025
Of the 186 retained values, 124 are from 2025 and 28 from 2024. Together that is 152 observations, or about 81.7% of the dataset. The remaining 34 are from 2023 or earlier. Papua New Guinea is dated 2004, Eritrea 2011, and Turkmenistan 2012, illustrating why a latest-value dataset can still contain observations that are poor proxies for current conditions.
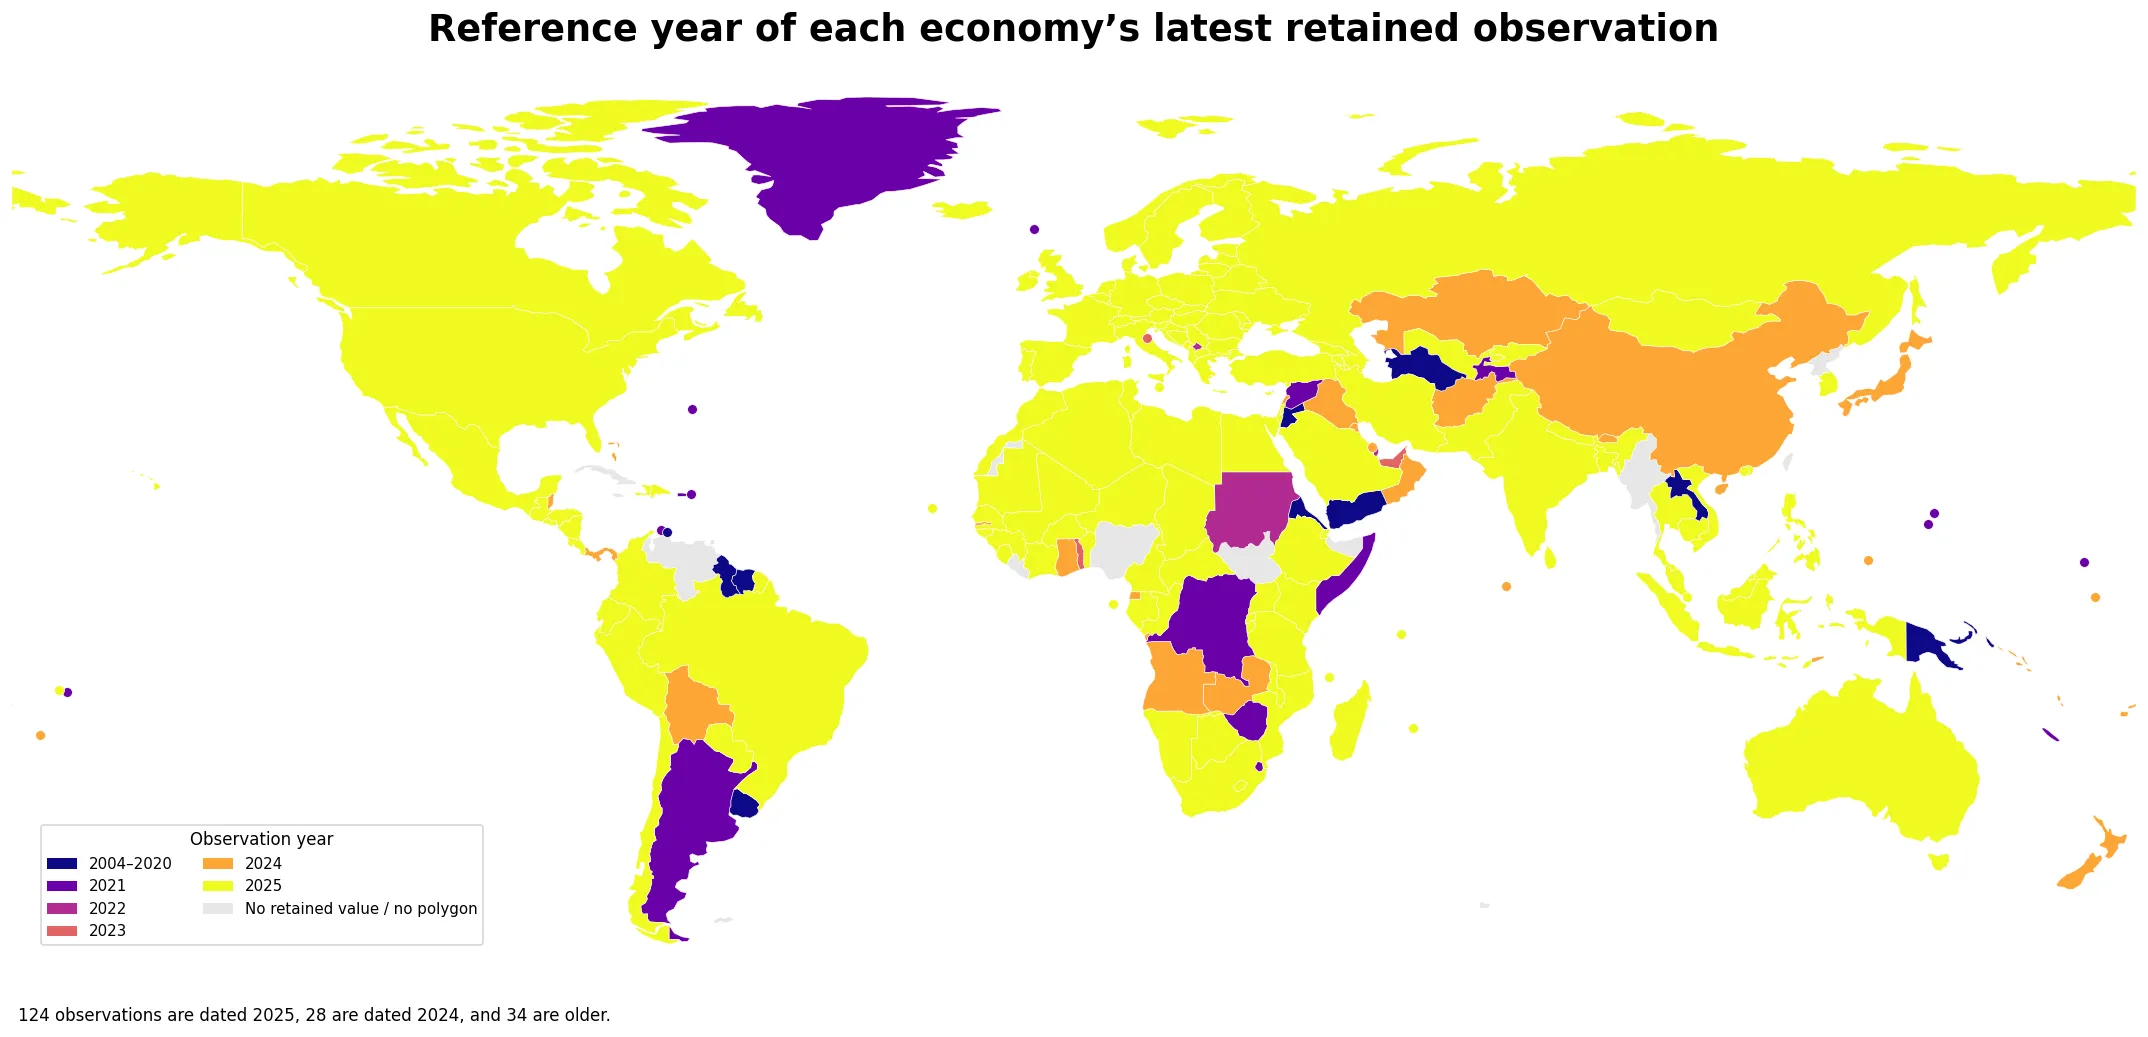
The year map is a comparability check, not an explanation for high or low consumption. Older observations should not be silently treated as current. A country can appear low on the latest-value map simply because its most recent retained national-accounts observation is much older than the observations for neighboring countries.
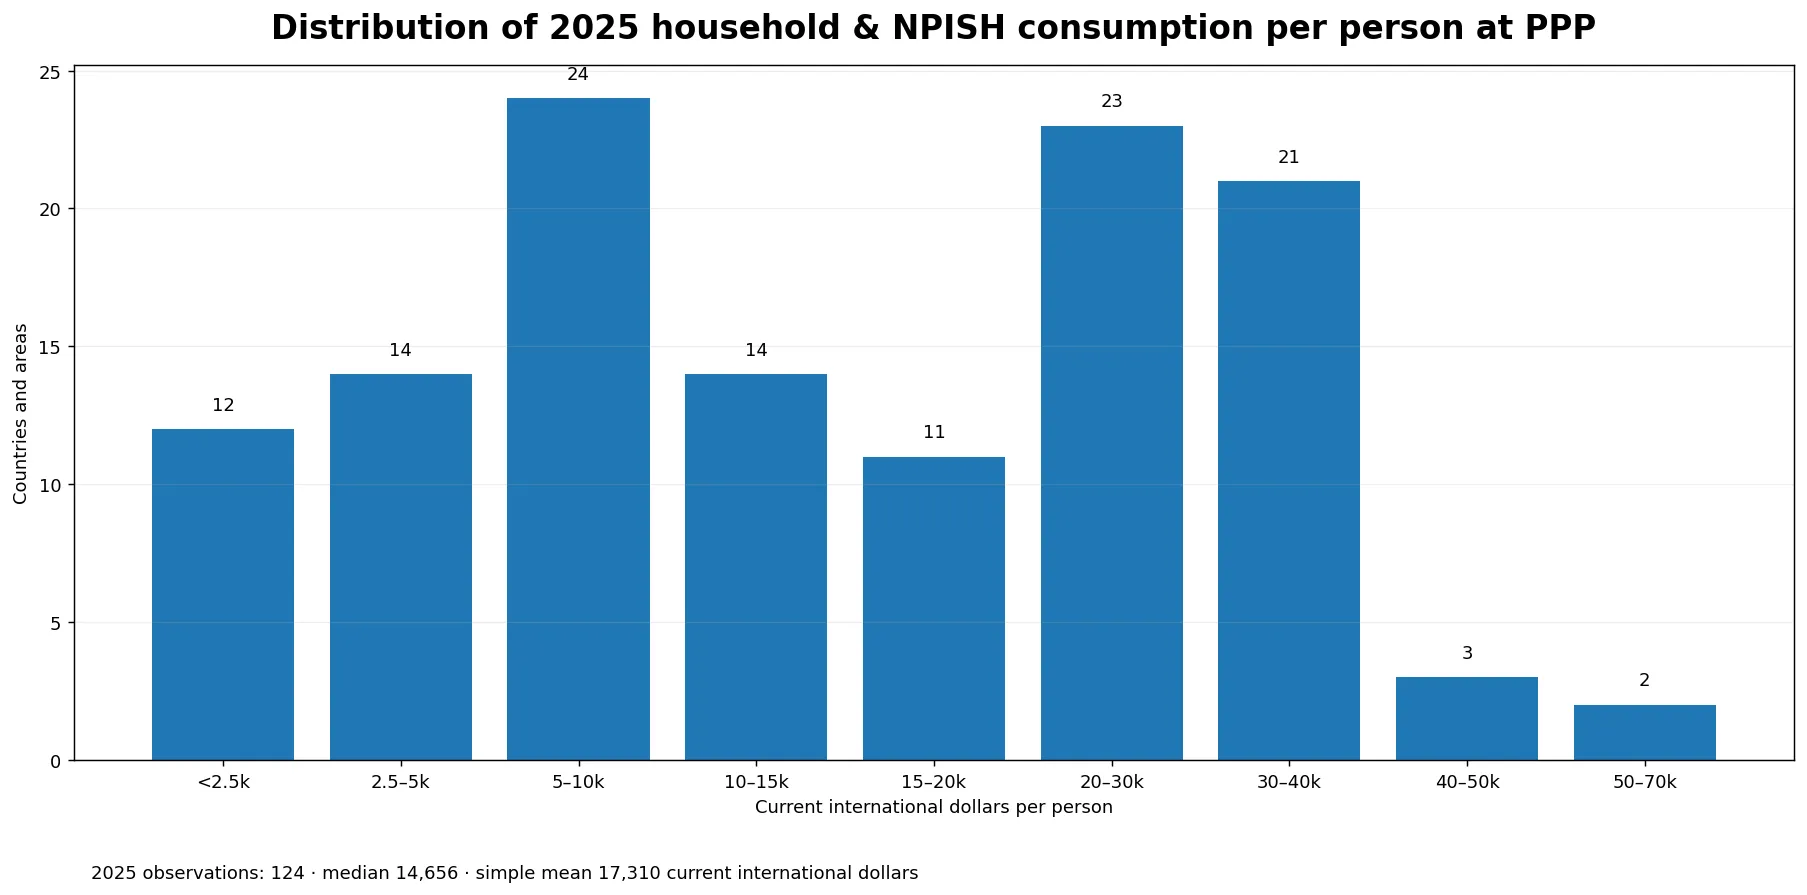
Across 124 same-year 2025 observations, the median is about $14,656 per person
Restricting the data to 2025 leaves 124 countries and areas. Their country-equal median is $14,656 per person and their simple mean is $17,310. The 25th percentile is $5,854 and the 75th percentile $27,775, so the middle half of the 2025 observations lies roughly between those two values. The higher mean reflects a long upper tail of high-consumption economies.
The United States leads the 2025 subset, followed by several high-income Asian and European economies
The United States records the highest 2025 observation at about $61,250 per person. Hong Kong follows at roughly $51,005 and Luxembourg at $49,995. Switzerland is about $44,348 and Norway $41,813. Germany, Singapore, Austria, the United Kingdom, and Iceland also fall in the roughly $37,000–$40,000 range. Spatially, the upper bands are concentrated in North America, Western and Northern Europe, Australia, and a smaller group of high-income Asian economies.
| Rank | Country / area | 2025 value per person |
|---|---|---|
| 1 | United States | $61,250 |
| 2 | Hong Kong SAR, China | $51,005 |
| 3 | Luxembourg | $49,995 |
| 4 | Switzerland | $44,348 |
| 5 | Norway | $41,813 |
| 6 | Germany | $39,617 |
| 7 | Singapore | $39,231 |
| 8 | Austria | $38,480 |
| 9 | United Kingdom | $37,689 |
| 10 | Iceland | $37,615 |
This is not a ranking of average salaries or disposable income. Final consumption expenditure is a national-accounts use-of-goods-and-services measure, and international dollars are a PPP conversion unit. The indicator also says nothing directly about household wealth, saving, housing-cost pressure, or the distribution of consumption within a country.
The lowest 2025 values are concentrated in Sub-Saharan Africa
Burundi has the smallest 2025 value at about $474 per person. Mozambique is about $1,117, the Central African Republic $1,182, Madagascar $1,503, and Chad $1,524. Niger and Malawi are also below $1,600. The map shows a broad cluster of low values across much of Sub-Saharan Africa, but the indicator by itself cannot identify a single cause for that pattern.
| Lowest rank | Country / area | 2025 value per person |
|---|---|---|
| 1 | Burundi | $474 |
| 2 | Mozambique | $1,117 |
| 3 | Central African Republic | $1,182 |
| 4 | Madagascar | $1,503 |
| 5 | Chad | $1,524 |
| 6 | Niger | $1,541 |
| 7 | Malawi | $1,577 |
| 8 | Burkina Faso | $2,075 |
| 9 | Guinea-Bissau | $2,090 |
| 10 | Uganda | $2,163 |
PPP adjustment makes cross-country level comparisons more meaningful than a simple market-exchange-rate conversion, but many factors can be associated with final consumption per person: income levels, public-service provision, saving and investment patterns, demographics, and national-accounts measurement, among others. The dataset does not provide enough evidence to assign the cross-country gaps to one mechanism.
Major economies show why level measures and GDP-share measures answer different questions
Among 2025 observations, Germany is about $39,617 per person, the United Kingdom $37,689, Australia $35,629, Canada $34,462, France $32,021, and Saudi Arabia $31,974. Korea, Rep. is about $28,117, the Russian Federation $24,887, Türkiye $22,624, Mexico $16,594, Brazil $14,710, South Africa $10,039, Indonesia $9,089, and India $6,741. China at $10,770 and Japan at $27,317 are latest 2024 observations in this dataset, so they should not be inserted into a 2025-only rank without making the year difference explicit.
| Country / area | Observation year | Value per person |
|---|---|---|
| United States | 2025 | $61,250 |
| Germany | 2025 | $39,617 |
| United Kingdom | 2025 | $37,689 |
| Australia | 2025 | $35,629 |
| Canada | 2025 | $34,462 |
| France | 2025 | $32,021 |
| Saudi Arabia | 2025 | $31,974 |
| Korea, Rep. | 2025 | $28,117 |
| Russian Federation | 2025 | $24,887 |
| Turkiye | 2025 | $22,624 |
| Mexico | 2025 | $16,594 |
| Brazil | 2025 | $14,710 |
| South Africa | 2025 | $10,039 |
| Indonesia | 2025 | $9,089 |
| India | 2025 | $6,741 |
| China | 2024 | $10,770 |
| Japan | 2024 | $27,317 |
A companion household-consumption-share-of-GDP indicator asks a different question. Per-capita PPP consumption compares the level of household-oriented final consumption per resident. The GDP-share measure compares the same broad consumption component with the size of domestic production. A country can have high consumption per person but a moderate GDP share, or a high GDP share but a much lower level per person.
PPP international dollars are not a cost-of-living ranking or a wage measure
A PPP is both a currency conversion factor and a spatial price deflator. It converts currencies into a common unit while reducing differences in national price levels. That is why PPP-adjusted consumption is often more informative for cross-country volume comparisons than market-dollar values. Still, this series is an average national-accounts measure. It does not describe what the median household spends, what a particular basket costs, or how consumption is distributed across income groups.
Current international dollars should also not be used as if they were constant-price units across time. If a country’s current-PPP value rises by 20% over several years, that does not establish a 20% increase in real consumption. For that question, a constant-PPP series or another explicitly real measure is needed.
Source and mapping method
The statistical source is World Bank World Development Indicators series NE.CON.PCAP.PP.CD, Households and NPISHs Final consumption expenditure per capita, PPP (current international $). All maps, tables, ranks, medians, quartiles, and counts here are calculated from the 186 latest non-missing country and area observations supplied for this topic. World Bank regional and income aggregates are not treated as country rows.
The maps use a low-resolution Natural Earth country boundary layer. 161 observations join directly to polygons, while 25 small countries and territories without separate polygons at this scale are shown with representative point markers so every one of the 186 statistical rows is visualized. Missing values are not converted to zero. The value map uses discrete bands because the range from hundreds to more than $60,000 per person is too wide for a simple linear color ramp to remain legible.
Frequently Asked Questions
Is PPP consumption per capita the same as average salary?
No. It is a national-accounts measure of household and NPISH final consumption divided by population. It is different from wages, disposable income, and median household income.
Can all 186 values be treated as a 2025 country ranking?
No. Only 124 observations are dated 2025, 28 are from 2024, and 34 are older. The 2025 subset is the cleaner same-year comparison.
What is an international dollar at PPP?
It is a common unit produced with purchasing-power-parity conversion, which reduces cross-country differences in price levels. It is not the same as converting local currency at market exchange rates.
Can current international dollars be used to measure long-run real growth?
Not directly. Current-price PPP values can change with prices and conversion factors. Constant-PPP or another explicitly real series is better for long-run real growth.
Related Articles
- Household consumption as a share of GDP by country
- Private-consumption PPP conversion factors by country
- Real consumption or income growth per capita
Green Map creates custom-edited map images using open geographic data sources such as geoBoundaries, Natural Earth, OpenStreetMap, and government open data.
These maps are edited visual materials, not raw data files, and are provided for education, documents, presentations, and graphic reference.