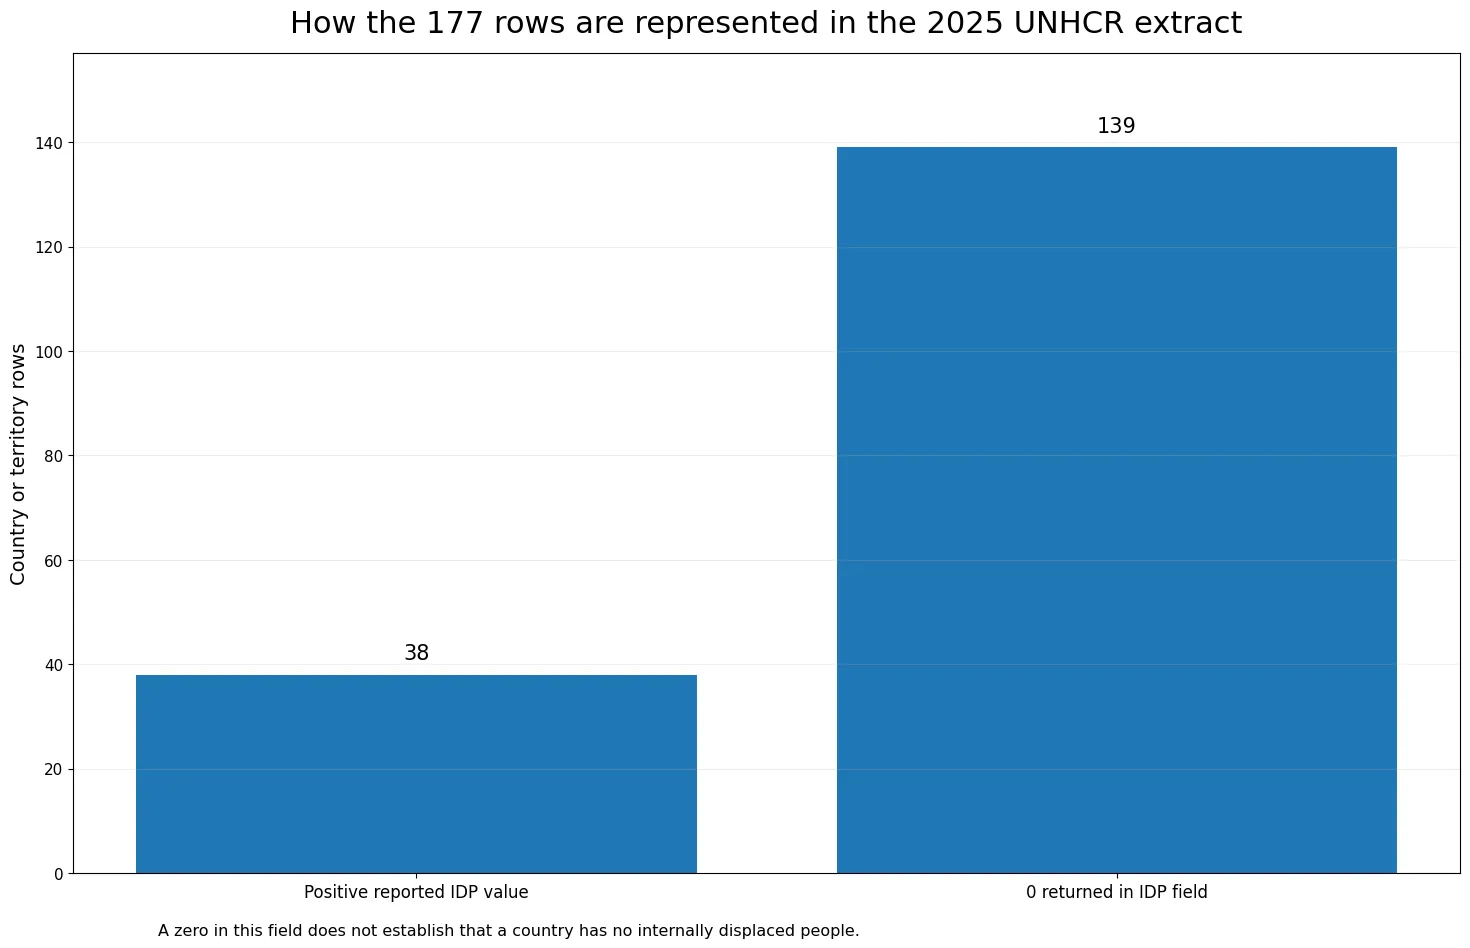
Internally displaced people, or IDPs, are people forced to leave their homes or habitual places of residence but who remain within an internationally recognized state border. The 2025 UNHCR Refugee Statistics extract used here contains 177 country or territory rows. Thirty-eight rows have a positive IDP value and 139 return zero. The sum of the extracted values is 64,239,352 people. Sudan has the largest reported value at 9,139,309, followed by Colombia at 7,157,716, the Democratic Republic of the Congo at 5,669,479, the Syrian Arab Republic at 5,542,227 and Yemen at 4,795,983.
That 64.2 million figure should not be treated as the complete number of internally displaced people worldwide. UNHCR states that its IDP statistics cover conflict-generated IDPs to whom the agency extends protection and/or assistance. It does not provide a complete picture of all internal displacement, and disaster displacement is outside the scope of this particular UNHCR IDP series. The country values below are therefore best read as the 2025 UNHCR-reported IDP stock, not as a universal census of every person displaced within their own country.
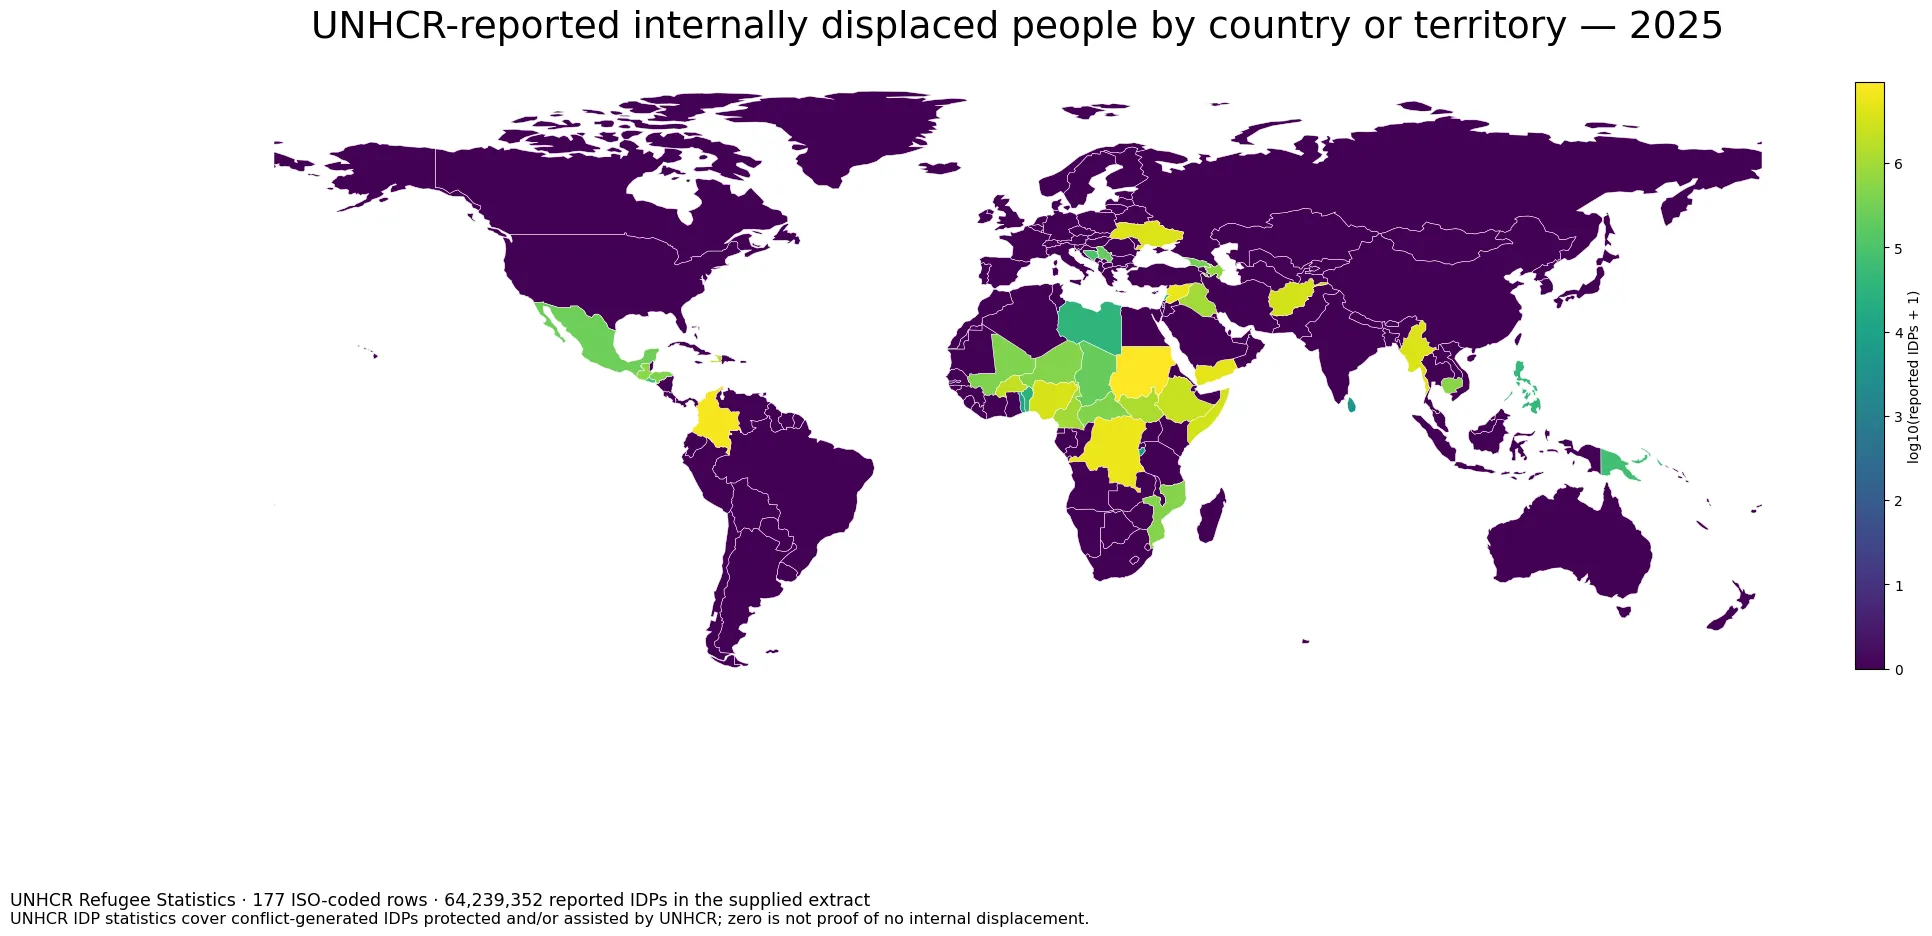
Table of Contents
What this IDP series actually measures
UNHCR’s statistical definition describes IDPs as people or groups forced or obliged to flee or leave their homes or habitual residence, especially because of armed conflict, generalized violence, human rights violations, or natural or human-made disasters, without crossing an internationally recognized state border. For UNHCR statistics, however, the reported population is narrower: it includes conflict-generated IDPs to whom UNHCR extends protection and/or assistance, and may also include people in an IDP-like situation.
The Refugee Data Finder methodology explicitly warns that UNHCR statistics are not a complete overview of global internal displacement. The Internal Displacement Monitoring Centre, or IDMC, maintains a broader database covering displacement due to conflict and violence as well as disasters. That distinction is essential when comparing national zeros, global totals or different websites that all use the term “IDP.”
UNHCR’s forced-displacement statistics explainer reports that at the end of 2025 IDMC counted 82.3 million IDPs in total: 68.7 million displaced by conflict and violence and 13.6 million by disasters. In the 40 countries where UNHCR reported on conflict-related internal displacement, the number of IDPs protected and/or assisted by UNHCR was 64.2 million. The sum of the values in this extract, 64,239,352, closely matches that UNHCR-specific total.
Five country rows account for half of the extracted total
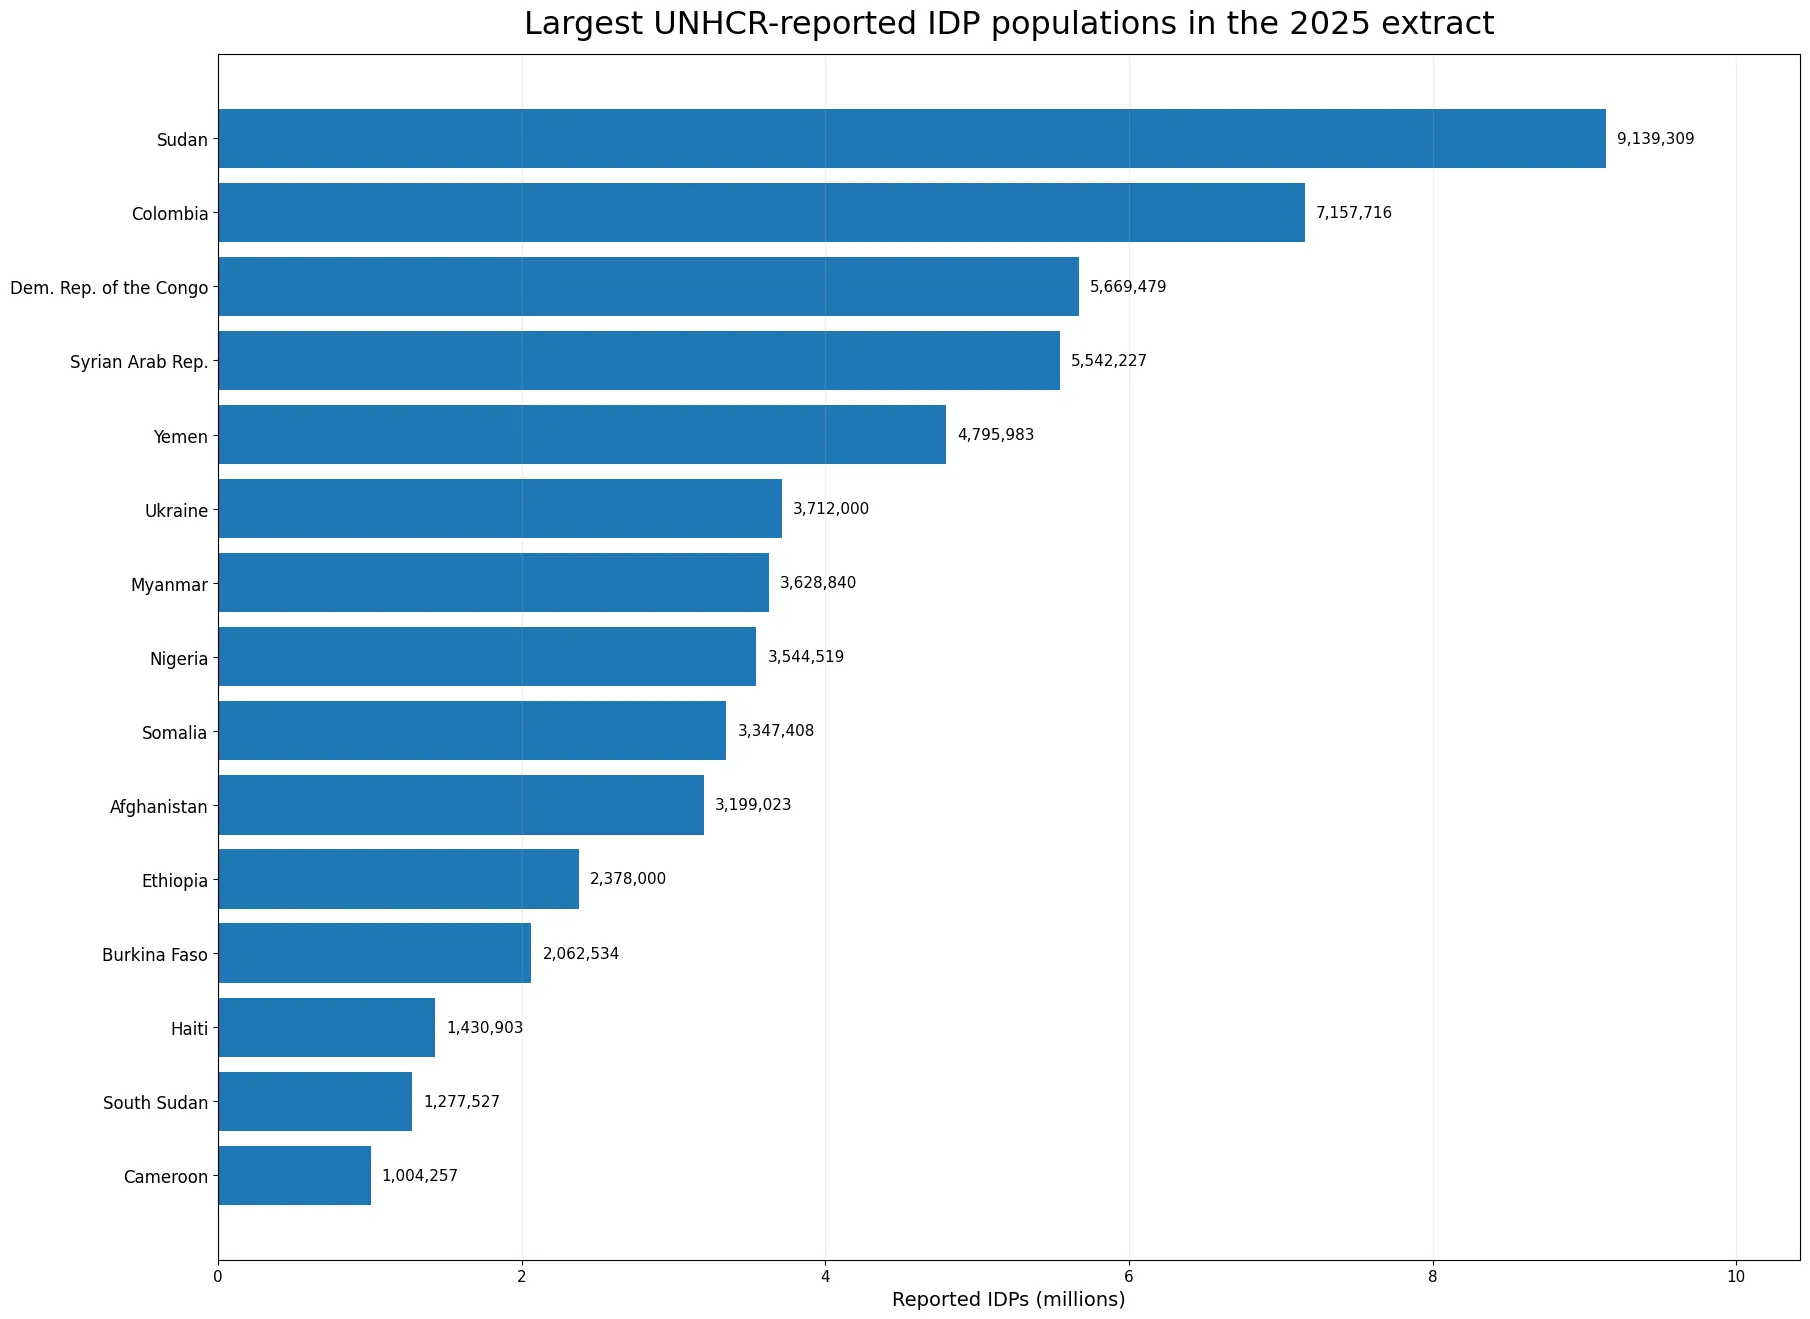
The five largest rows — Sudan, Colombia, the Democratic Republic of the Congo, the Syrian Arab Republic and Yemen — sum to 32,304,714, or about 50.3% of the extracted total. The ten largest rows account for about 77.4%, and the top fifteen for roughly 90.1%. The distribution is therefore highly concentrated in a relatively small number of major displacement crises.
Sudan’s 9,139,309 is the largest country value in the extract. Colombia follows at 7,157,716. The Democratic Republic of the Congo and the Syrian Arab Republic each exceed 5.5 million, while Yemen is close to 4.8 million. Ukraine reports 3,712,000, Myanmar 3,628,840, Nigeria 3,544,519, Somalia 3,347,408 and Afghanistan 3,199,023. These figures describe the size of the remaining IDP stock at a point in time; they are not a ranking of governments, humanitarian responses or conflict severity.
Why 139 zero values do not mean 139 countries have no IDPs
A striking feature of the extract is that 139 of 177 rows return zero. Those zeros are part of the source data; they were not created by replacing missing values during analysis. Even so, “zero in this UNHCR field” and “no internal displacement exists” are different statements. UNHCR reported on internal displacement situations in 40 countries in 2025, while this specific country-level IDP extract has 38 positive rows. Differences in statistical scope, reporting arrangements and population categories mean that a zero should not be expanded into a claim of complete absence.
Disaster displacement is a particularly important example. A country can experience large floods, storms, earthquakes or other events that displace people internally while still returning zero in this conflict-focused UNHCR IDP series. Access, registration systems, changes in methodology and the timing of a stock measurement can also affect what is visible in a country-level dataset. The safest interpretation is simply that the API returned zero for the IDP field in that row.
The overall median is zero, but positive rows tell a different story
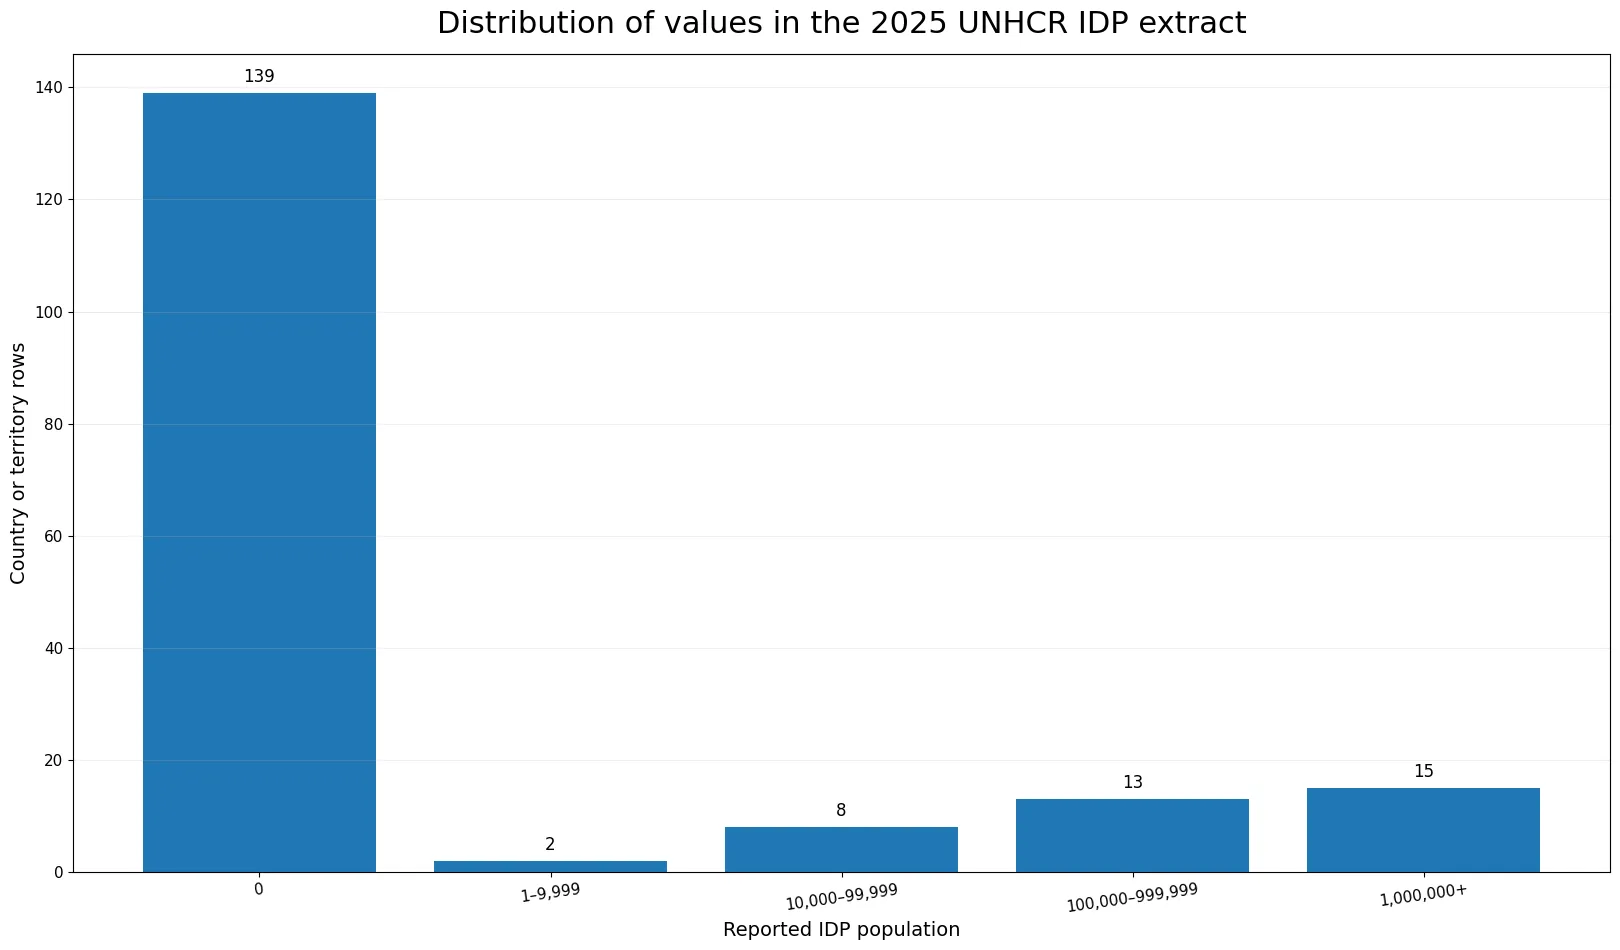
Because 139 rows are zero, the median across all 177 rows is 0. The arithmetic mean is about 362,934, but this average is pulled upward by a small number of very large crises. Looking only at the 38 positive rows, the median rises to 489,650 and the mean to about 1,690,509. This is a strongly skewed distribution, so a single average does not describe a “typical” country well.
By broad bands, 139 rows are zero, two are between 1 and 9,999, eight are between 10,000 and 99,999, thirteen are between 100,000 and 999,999, and fifteen are at one million or more. In other words, nearly two-fifths of the positive rows exceed one million reported IDPs. The map therefore uses a logarithmic scale so that the variation among smaller positive values remains visible instead of being compressed by the 9.1 million maximum.
Stock figures are different from new displacement movements
Internal-displacement statistics commonly use two different measures. A stock is the number of people who remain displaced at a particular point in time, such as the end of the year. A flow measure of new internal displacements counts displacement movements during a period. The same person can be displaced more than once during a year and therefore contribute more than once to a movement total, while an end-year stock aims to count people who are still displaced at that point. This dataset is a stock measure.
That distinction changes how trends should be interpreted. A lower end-year stock does not necessarily mean that few new displacements occurred during the year: new displacement and returns can both be large. Likewise, many displacement movements can occur without producing an equally large increase in the stock if substantial numbers of people return or otherwise leave displacement. To understand how a crisis changed during 2025, country-specific analysis should combine stock, new displacement, returns and time-series evidence rather than infer the story from one end-year value.
Why the UNHCR total differs from the global IDP headline
UNHCR Global Trends 2025 presents 68.7 million people as remaining internally displaced by conflict or violence at the end of 2025, drawing on IDMC for the global total. UNHCR’s own operational/statistical coverage in the countries where it reports internal displacement is about 64.2 million. The two numbers do not contradict each other; they refer to different data sources and coverage.
The same caution applies to the broader 82.3 million IDMC figure that also includes 13.6 million people displaced by disasters at the end of 2025. The 64,239,352 sum in this extract is useful because it allows a consistent country comparison within UNHCR’s reporting system. It is not a replacement for the broader global estimate. When the question is “where are UNHCR-reported conflict-related IDP populations concentrated?” this dataset is appropriate; when the question is “how many people are internally displaced worldwide for all tracked causes?” the broader IDMC framework is needed.
All 177 country and territory rows for 2025
The table below lists every row in the supplied 2025 extract, ordered from the largest reported IDP value to the smallest. Source country names are retained and zero values are not removed. The table is useful for locating the countries with the largest UNHCR-reported stocks, but it cannot by itself explain conflict dynamics, protection conditions, return prospects, disaster displacement or gaps in registration. Country-level UNHCR and IDMC material should be consulted before drawing detailed conclusions about a particular situation.
| Country or territory | Year | UNHCR-reported IDPs |
|---|---|---|
| Sudan | 2025 | 9,139,309 |
| Colombia | 2025 | 7,157,716 |
| Dem. Rep. of the Congo | 2025 | 5,669,479 |
| Syrian Arab Rep. | 2025 | 5,542,227 |
| Yemen | 2025 | 4,795,983 |
| Ukraine | 2025 | 3,712,000 |
| Myanmar | 2025 | 3,628,840 |
| Nigeria | 2025 | 3,544,519 |
| Somalia | 2025 | 3,347,408 |
| Afghanistan | 2025 | 3,199,023 |
| Ethiopia | 2025 | 2,378,000 |
| Burkina Faso | 2025 | 2,062,534 |
| Haiti | 2025 | 1,430,903 |
| South Sudan | 2025 | 1,277,527 |
| Cameroon | 2025 | 1,004,257 |
| Iraq | 2025 | 997,334 |
| Azerbaijan | 2025 | 657,155 |
| Guatemala | 2025 | 573,000 |
| Cambodia | 2025 | 517,555 |
| Mozambique | 2025 | 461,745 |
| Niger | 2025 | 459,585 |
| Central African Rep. | 2025 | 427,479 |
| Honduras | 2025 | 423,845 |
| Mali | 2025 | 414,524 |
| Georgia | 2025 | 300,439 |
| Mexico | 2025 | 262,411 |
| Chad | 2025 | 219,595 |
| Serbia and Kosovo: S/RES/1244 (1999) | 2025 | 209,453 |
| Bosnia and Herzegovina | 2025 | 94,796 |
| El Salvador | 2025 | 71,500 |
| Papua New Guinea | 2025 | 70,124 |
| Lebanon | 2025 | 64,417 |
| Philippines | 2025 | 43,500 |
| Libya | 2025 | 32,791 |
| Benin | 2025 | 27,294 |
| Togo | 2025 | 10,171 |
| Burundi | 2025 | 6,815 |
| Sri Lanka | 2025 | 4,099 |
| Albania | 2025 | 0 |
| Algeria | 2025 | 0 |
| Angola | 2025 | 0 |
| Argentina | 2025 | 0 |
| Armenia | 2025 | 0 |
| Aruba | 2025 | 0 |
| Australia | 2025 | 0 |
| Austria | 2025 | 0 |
| Bahamas | 2025 | 0 |
| Bahrain | 2025 | 0 |
| Bangladesh | 2025 | 0 |
| Barbados | 2025 | 0 |
| Belarus | 2025 | 0 |
| Belgium | 2025 | 0 |
| Belize | 2025 | 0 |
| Bolivia (Plurinational State of) | 2025 | 0 |
| Botswana | 2025 | 0 |
| Brazil | 2025 | 0 |
| British Virgin Islands | 2025 | 0 |
| Brunei Darussalam | 2025 | 0 |
| Bulgaria | 2025 | 0 |
| Cabo Verde | 2025 | 0 |
| Canada | 2025 | 0 |
| Cayman Islands | 2025 | 0 |
| Chile | 2025 | 0 |
| China | 2025 | 0 |
| China, Hong Kong SAR | 2025 | 0 |
| Comoros | 2025 | 0 |
| Congo | 2025 | 0 |
| Costa Rica | 2025 | 0 |
| Cote d'Ivoire | 2025 | 0 |
| Croatia | 2025 | 0 |
| Cuba | 2025 | 0 |
| Curacao | 2025 | 0 |
| Cyprus | 2025 | 0 |
| Czechia | 2025 | 0 |
| Denmark | 2025 | 0 |
| Djibouti | 2025 | 0 |
| Dominica | 2025 | 0 |
| Dominican Rep. | 2025 | 0 |
| Ecuador | 2025 | 0 |
| Egypt | 2025 | 0 |
| Eritrea | 2025 | 0 |
| Estonia | 2025 | 0 |
| Eswatini | 2025 | 0 |
| Fiji | 2025 | 0 |
| Finland | 2025 | 0 |
| France | 2025 | 0 |
| Gabon | 2025 | 0 |
| Gambia | 2025 | 0 |
| Germany | 2025 | 0 |
| Ghana | 2025 | 0 |
| Greece | 2025 | 0 |
| Guinea | 2025 | 0 |
| Guinea-Bissau | 2025 | 0 |
| Guyana | 2025 | 0 |
| Hungary | 2025 | 0 |
| Iceland | 2025 | 0 |
| India | 2025 | 0 |
| Indonesia | 2025 | 0 |
| Iran (Islamic Rep. of) | 2025 | 0 |
| Ireland | 2025 | 0 |
| Israel | 2025 | 0 |
| Italy | 2025 | 0 |
| Japan | 2025 | 0 |
| Jordan | 2025 | 0 |
| Kazakhstan | 2025 | 0 |
| Kenya | 2025 | 0 |
| Kuwait | 2025 | 0 |
| Kyrgyzstan | 2025 | 0 |
| Latvia | 2025 | 0 |
| Lesotho | 2025 | 0 |
| Liberia | 2025 | 0 |
| Liechtenstein | 2025 | 0 |
| Lithuania | 2025 | 0 |
| Luxembourg | 2025 | 0 |
| Madagascar | 2025 | 0 |
| Malawi | 2025 | 0 |
| Malaysia | 2025 | 0 |
| Malta | 2025 | 0 |
| Mauritania | 2025 | 0 |
| Mauritius | 2025 | 0 |
| Monaco | 2025 | 0 |
| Mongolia | 2025 | 0 |
| Montenegro | 2025 | 0 |
| Morocco | 2025 | 0 |
| Namibia | 2025 | 0 |
| Nauru | 2025 | 0 |
| Nepal | 2025 | 0 |
| Netherlands (Kingdom of the) | 2025 | 0 |
| New Zealand | 2025 | 0 |
| North Macedonia | 2025 | 0 |
| Norway | 2025 | 0 |
| Oman | 2025 | 0 |
| Pakistan | 2025 | 0 |
| Panama | 2025 | 0 |
| Paraguay | 2025 | 0 |
| Peru | 2025 | 0 |
| Poland | 2025 | 0 |
| Portugal | 2025 | 0 |
| Qatar | 2025 | 0 |
| Rep. of Korea | 2025 | 0 |
| Rep. of Moldova | 2025 | 0 |
| Romania | 2025 | 0 |
| Russian Federation | 2025 | 0 |
| Rwanda | 2025 | 0 |
| Saint Kitts and Nevis | 2025 | 0 |
| Saint Lucia | 2025 | 0 |
| Saudi Arabia | 2025 | 0 |
| Senegal | 2025 | 0 |
| Sierra Leone | 2025 | 0 |
| Singapore | 2025 | 0 |
| Sint Maarten (Dutch part) | 2025 | 0 |
| Slovakia | 2025 | 0 |
| Slovenia | 2025 | 0 |
| South Africa | 2025 | 0 |
| Spain | 2025 | 0 |
| Suriname | 2025 | 0 |
| Sweden | 2025 | 0 |
| Switzerland | 2025 | 0 |
| Tajikistan | 2025 | 0 |
| Thailand | 2025 | 0 |
| Trinidad and Tobago | 2025 | 0 |
| Tunisia | 2025 | 0 |
| Turkmenistan | 2025 | 0 |
| Turks and Caicos Islands | 2025 | 0 |
| Türkiye | 2025 | 0 |
| Uganda | 2025 | 0 |
| United Arab Emirates | 2025 | 0 |
| United Kingdom of Great Britain and Northern Ireland | 2025 | 0 |
| United Rep. of Tanzania | 2025 | 0 |
| United States of America | 2025 | 0 |
| Uruguay | 2025 | 0 |
| Uzbekistan | 2025 | 0 |
| Vanuatu | 2025 | 0 |
| Venezuela (Bolivarian Republic of) | 2025 | 0 |
| Viet Nam | 2025 | 0 |
| Zambia | 2025 | 0 |
| Zimbabwe | 2025 | 0 |
Source and interpretation limits
The values come from the UNHCR Refugee Statistics 2025 population API and the IDP population field. UNHCR compiles population statistics primarily from governments and its own operations. End-year statistics for the previous year are normally released in June; the annual 2025 statistics and Global Trends report were released on 11 June 2026.
This comparison is designed to show the scale and geographic concentration of UNHCR-reported IDP stocks. It should not be used to treat zero as confirmed absence, substitute for the broader global IDP total, or infer the causes and quality of national responses from one count. The definition, source scope and measurement date are part of the data and should travel with every comparison.
Frequently Asked Questions
Who is an internally displaced person?
An IDP is someone forced to leave home who remains within an internationally recognized state border. UNHCR statistics mainly cover conflict-generated IDPs whom the agency protects and/or assists.
Which country has the largest IDP value in this 2025 extract?
Sudan has the largest value at 9,139,309, followed by Colombia, the Democratic Republic of the Congo, the Syrian Arab Republic and Yemen.
Does a zero mean a country has no internally displaced people?
No. It is the value returned in this UNHCR IDP field. Disaster displacement and internal displacement outside UNHCR reporting scope may still exist.
Why is the UNHCR total about 64.2 million while the global conflict IDP total is 68.7 million?
They use different coverage. About 64.2 million refers to conflict-related IDPs protected and/or assisted within UNHCR reporting, while the 68.7 million global conflict-and-violence stock uses IDMC data.
Related Articles
Green Map creates custom-edited map images using open geographic data sources such as geoBoundaries, Natural Earth, OpenStreetMap, and government open data. These maps are edited visual materials, not raw data files, and are provided for education, documents, presentations, and graphic reference.