The World Bank indicator NY.GDP.COAL.RT.ZS expresses estimated coal rents as a share of gross domestic product. Coal rents are not coal-company revenue, tax receipts, or the share of electricity generated from coal. The concept measures the economic surplus associated with hard and soft coal production: the value of production at world prices minus total production costs, then expressed relative to GDP. That definition makes this a resource-rent indicator rather than a general measure of coal use.
The source table contains the latest non-empty observation for 200 economies. 188 observations are from 2021 and 12 come from 2011–2020, so this is not a perfectly synchronized 2021 cross-section. It is better described as the latest available country comparison through 2021, dominated by 2021 data. Across all 200 observations, the median is 0% and the mean is 0.203%. Exactly 131 economies have a reported value of zero, while 69 have a positive value.
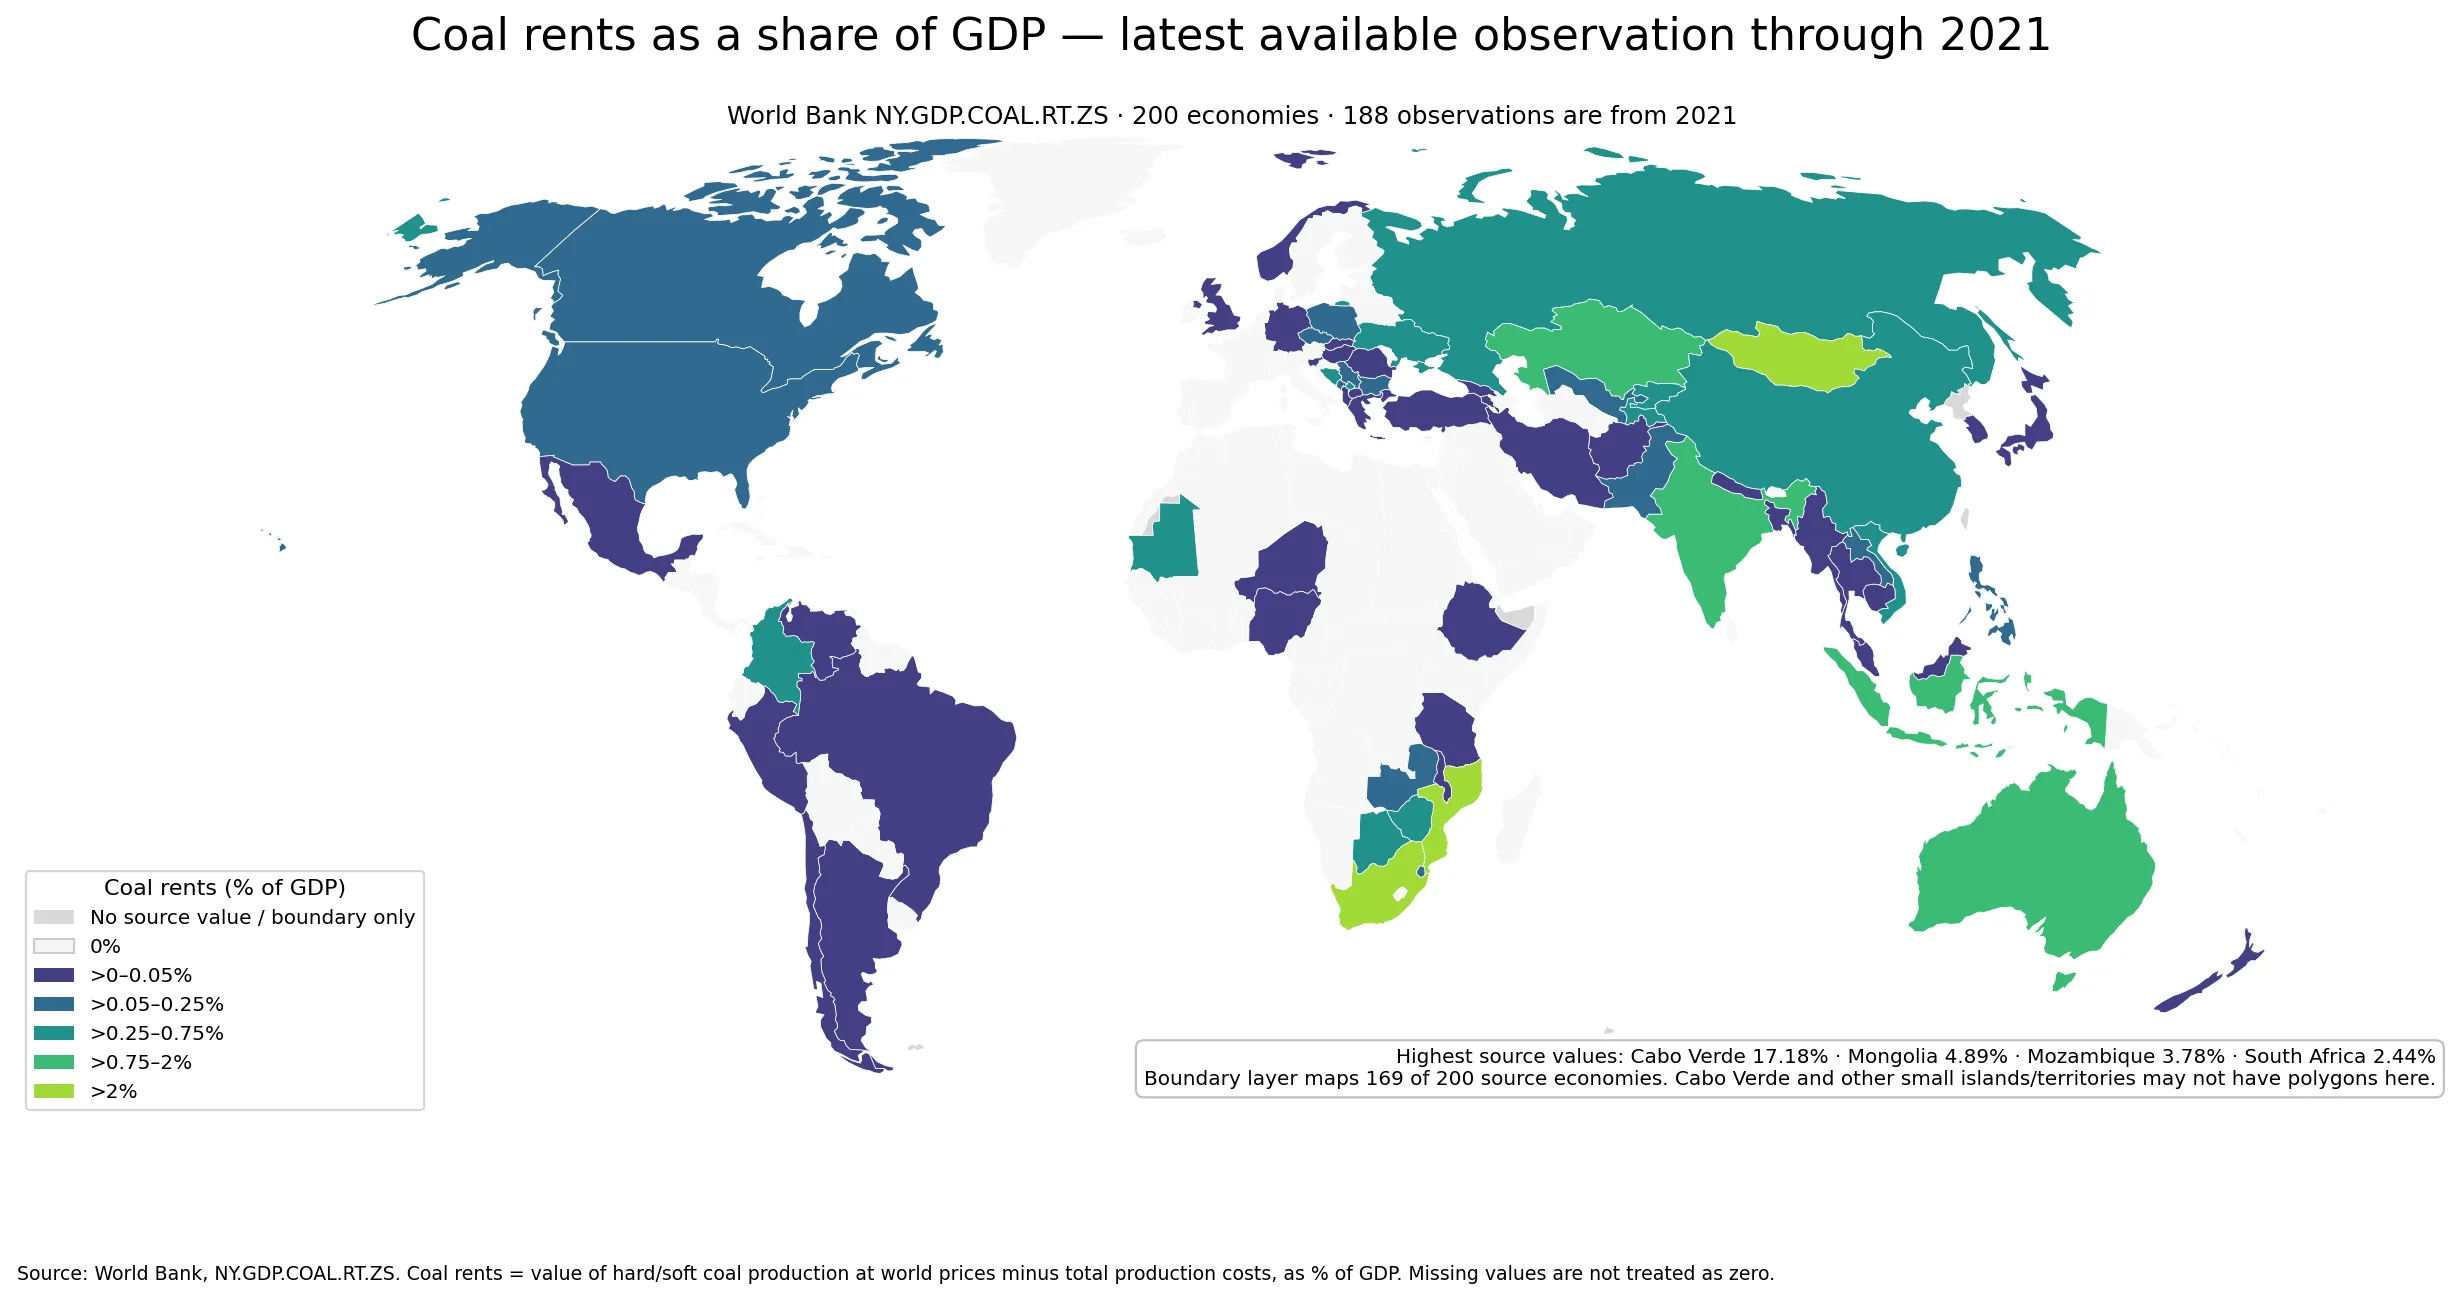
Table of Contents
What coal rents as a share of GDP measure
Natural-resource rent is an economic concept intended to isolate the surplus associated with a resource after accounting for production costs. For coal, the World Bank definition uses the value of hard and soft coal production at world prices and subtracts the total cost of production. The resulting estimate is then divided by GDP. A reading of 1% therefore means the estimated coal resource rent was roughly equivalent to 1% of that economy’s GDP in the observation year. It does not mean the government collected 1% of GDP in coal taxes or royalties, and it is not the same as accounting profit reported by coal producers.
The denominator also matters. Two economies can produce substantial amounts of coal but have very different rent shares because their GDP sizes, extraction costs, production mix, and price conditions differ. A smaller economy can record a high percentage even when its absolute coal sector is not among the world’s largest. Conversely, a very large economy can produce large volumes while showing a modest rent-to-GDP ratio. The indicator is therefore most useful for comparing the relative economic weight of the estimated resource surplus, not for ranking physical coal output.
The distribution across 200 economies
The distribution is highly concentrated near zero. 131 of 200 economies, or about 65.5%, have a value of exactly 0%. Only 69 observations are positive. Among positive observations alone, the median is about 0.049%. For the full set, both the first quartile and the median are zero, while the third quartile is only about 0.014%. This shape makes the mean much less representative of a typical economy than the median or the category counts.
| Coal rents as a share of GDP | Number of economies |
|---|---|
| 0% | 131 |
| >0–0.05% | 35 |
| >0.05–0.25% | 14 |
| >0.25–0.75% | 12 |
| >0.75–2% | 4 |
| >2% | 4 |
Only 6 economies exceed 1% and only 4 exceed 2%. By contrast, 35 economies sit between a positive value and 0.05%. The overall mean is 0.203%, but it falls to about 0.118% if the single Cabo Verde observation is removed. That difference illustrates how strongly one extreme observation can pull the arithmetic average upward. For this dataset, reporting the median, the zero count, and the upper tail is more informative than relying on the mean alone.
A small number of economies dominate the upper tail
Cabo Verde has the highest latest available observation at 17.180%. Mongolia follows at 4.893%, Mozambique at 3.781%, South Africa at 2.441%, India at 1.280%, and Indonesia at 1.223%. Those are the six observations above 1%. Kazakhstan and Australia are just under 0.9%, while Colombia, Mauritania, the Russian Federation, and China are in the 0.6–0.7% range. Again, these are rankings of resource rent relative to GDP, not rankings of coal output, reserves, exports, or consumption.
| Economy | Observation year | Coal rents (% of GDP) |
|---|---|---|
| Cabo Verde | 2021 | 17.180% |
| Mongolia | 2021 | 4.893% |
| Mozambique | 2021 | 3.781% |
| South Africa | 2021 | 2.441% |
| India | 2021 | 1.280% |
| Indonesia | 2021 | 1.223% |
| Kazakhstan | 2021 | 0.849% |
| Australia | 2021 | 0.786% |
| Colombia | 2021 | 0.726% |
| Mauritania | 2021 | 0.670% |
| Russian Federation | 2021 | 0.613% |
| China | 2021 | 0.608% |
| Botswana | 2021 | 0.500% |
| Tajikistan | 2021 | 0.486% |
| Kosovo | 2021 | 0.379% |
Cabo Verde is a particularly large outlier in this cross-section. The indicator itself does not identify why the estimate is so high, and it would be unsafe to turn the observation into a causal claim about policy, industrial performance, or energy dependence. The percentage can be affected by the production value, estimated costs, GDP denominator, and conditions specific to the observation year. It is best presented as an unusually high reported resource-rent value that warrants additional context rather than as a complete description of the economy.
Geographic patterns visible on the map
Several relatively high values appear in southern Africa and across parts of Asia. Mozambique and South Africa stand out in southern Africa, with positive readings also visible in Botswana, Zimbabwe, Zambia, and Eswatini. Across Central and East Asia, Mongolia is the clearest high-value polygon, while Kazakhstan, China, Tajikistan, and the Kyrgyz Republic also have positive observations. India and Indonesia exceed 1%, and Viet Nam and Pakistan are also above zero. These concentrations are consistent with a geographically uneven distribution of coal-related economic rent, but the map by itself cannot establish why those differences occur.
Europe and the broader Eurasian area also show positive values in the Russian Federation, Ukraine, Bosnia and Herzegovina, Poland, Serbia, Bulgaria, Montenegro, and Kosovo. In the Americas, Colombia is relatively elevated and the United States has a smaller positive value. Neighboring economies can fall into very different classes because the rent calculation reflects production, costs, prices, and GDP at the same time. A regional cluster can therefore be described as a visual pattern, but it should not be treated as evidence that one single geographic or policy factor caused the values.
The boundary layer used for the map contains polygons for 169 of the 200 source economies. Small islands and territories are the main omissions, including Cabo Verde, which happens to have the largest source value. Those omitted economies are not assigned a zero. They remain in the article statistics and ranking tables, while the map simply cannot shade a polygon that is absent from the low-resolution geography file. This distinction prevents a cartographic limitation from becoming a data error.
Why a reported 0% does not mean zero coal use
A reported value of 0% means coal resource rent is recorded as zero in this indicator. It does not mean coal consumption is zero, coal-fired power generation is zero, or coal imports are zero. An economy can burn imported coal while generating little or no domestic coal resource rent. It can also have domestic production but a very small estimated surplus relative to GDP. Questions about energy use require different measures such as coal consumption, power-generation mix, production tonnage, or imports.
Zero must also be distinguished from missing data. Every one of the 200 rows in the source table has a numeric observation; the 131 zeros are therefore actual reported zeros in this extracted latest-value dataset. On the map, however, some Natural Earth polygons have no matching World Bank row and are shown as no data rather than zero. Keeping those states separate is essential because “0%” and “no matched observation” are statistically different conditions.
Observation-year differences matter
The comparison is close to a 2021 snapshot because 188 of 200 observations are from that year, but 12 are older. Lao PDR, for example, has a positive 0.230% observation from 2012, the U.S. Virgin Islands has 0.205% from 2020, and Venezuela has 0.007% from 2014. Several other older observations are zeros. Comparing values from different years introduces differences in coal prices, production costs, output, and GDP conditions, so small rank gaps should not be read as precise present-day differences.
The major upper-tail observations are all from 2021, which makes the broad high-value pattern easier to interpret. Even so, the dataset should be described as “latest available through 2021,” not as “2021 data for 200 economies.” For trend analysis, a better method would be to retrieve a common multi-year series for each economy and compare the same calendar years. A latest-value map is useful for coverage, but it is not a substitute for a synchronized time series.
What this GDP share cannot tell you
Coal rents as a share of GDP do not directly measure employment, fiscal revenue, export dependence, reserves, carbon emissions, local environmental damage, or the share of electricity generated from coal. A high value does not automatically mean higher living standards or stronger public finances, and a low value does not demonstrate that an economy has completed a transition away from coal. The strength of the indicator is narrower: it puts estimated coal resource rent on a common GDP denominator so the relative economic weight of the resource surplus can be compared across economies.
For a fuller country interpretation, the rent share can be paired with physical coal production, trade, electricity generation, energy consumption, other resource-rent indicators, and GDP measures. Even when two World Bank rent indicators use similar concepts, they refer to different resources and should not be combined casually. The indicator definition, observation year, and denominator should stay visible throughout the comparison so the map remains an economic-resource map rather than a general statement about energy policy.
Frequently Asked Questions
What does coal rents mean in this indicator?
It is the estimated value of hard and soft coal production at world prices minus total production costs. This indicator expresses that resource rent as a percentage of GDP.
Are all 200 observations from 2021?
No. 188 observations are from 2021 and 12 are the latest available values from 2011–2020. The comparison is therefore latest available through 2021 rather than a fully synchronized 2021 snapshot.
Which economy has the highest coal-rent share of GDP?
Cabo Verde has the highest latest available observation at 17.180%, followed by Mongolia at 4.893%, Mozambique at 3.781%, and South Africa at 2.441%.
Does a 0% coal-rent value mean an economy uses no coal?
No. A zero refers only to estimated coal resource rent in this indicator. Coal consumption, imports, and coal-fired power generation require separate energy data.
Related Articles
Green Map creates custom-edited map images using open geographic data sources such as geoBoundaries, Natural Earth, OpenStreetMap, and government open data.
These maps are edited visual materials, not raw data files, and are provided for education, documents, presentations, and graphic reference.