The gender pattern of public pre-primary enrolment can differ even when overall participation in early childhood education looks similar. UNESCO Institute for Statistics indicator ETOIP.02.PU.GPIA provides 84 country and territory observations for 2024. It is an adjusted gender parity index comparing the female and male percentages of pre-primary enrolment that are in public institutions. The index is centered on 1: values close to 1 indicate that the public-institution share is similar for girls and boys. The median is 0.95544 and the mean is 0.95370.
This is not a percentage of girls enrolled in public pre-primary education. The underlying female and male indicators are percentages, but GPIA compares those two values. On the below-1 side, the index points to a lower female public-institution share. On the above-1 side, it points to a higher female share. The adjustment is designed so that departures on either side of 1 can be compared more symmetrically.
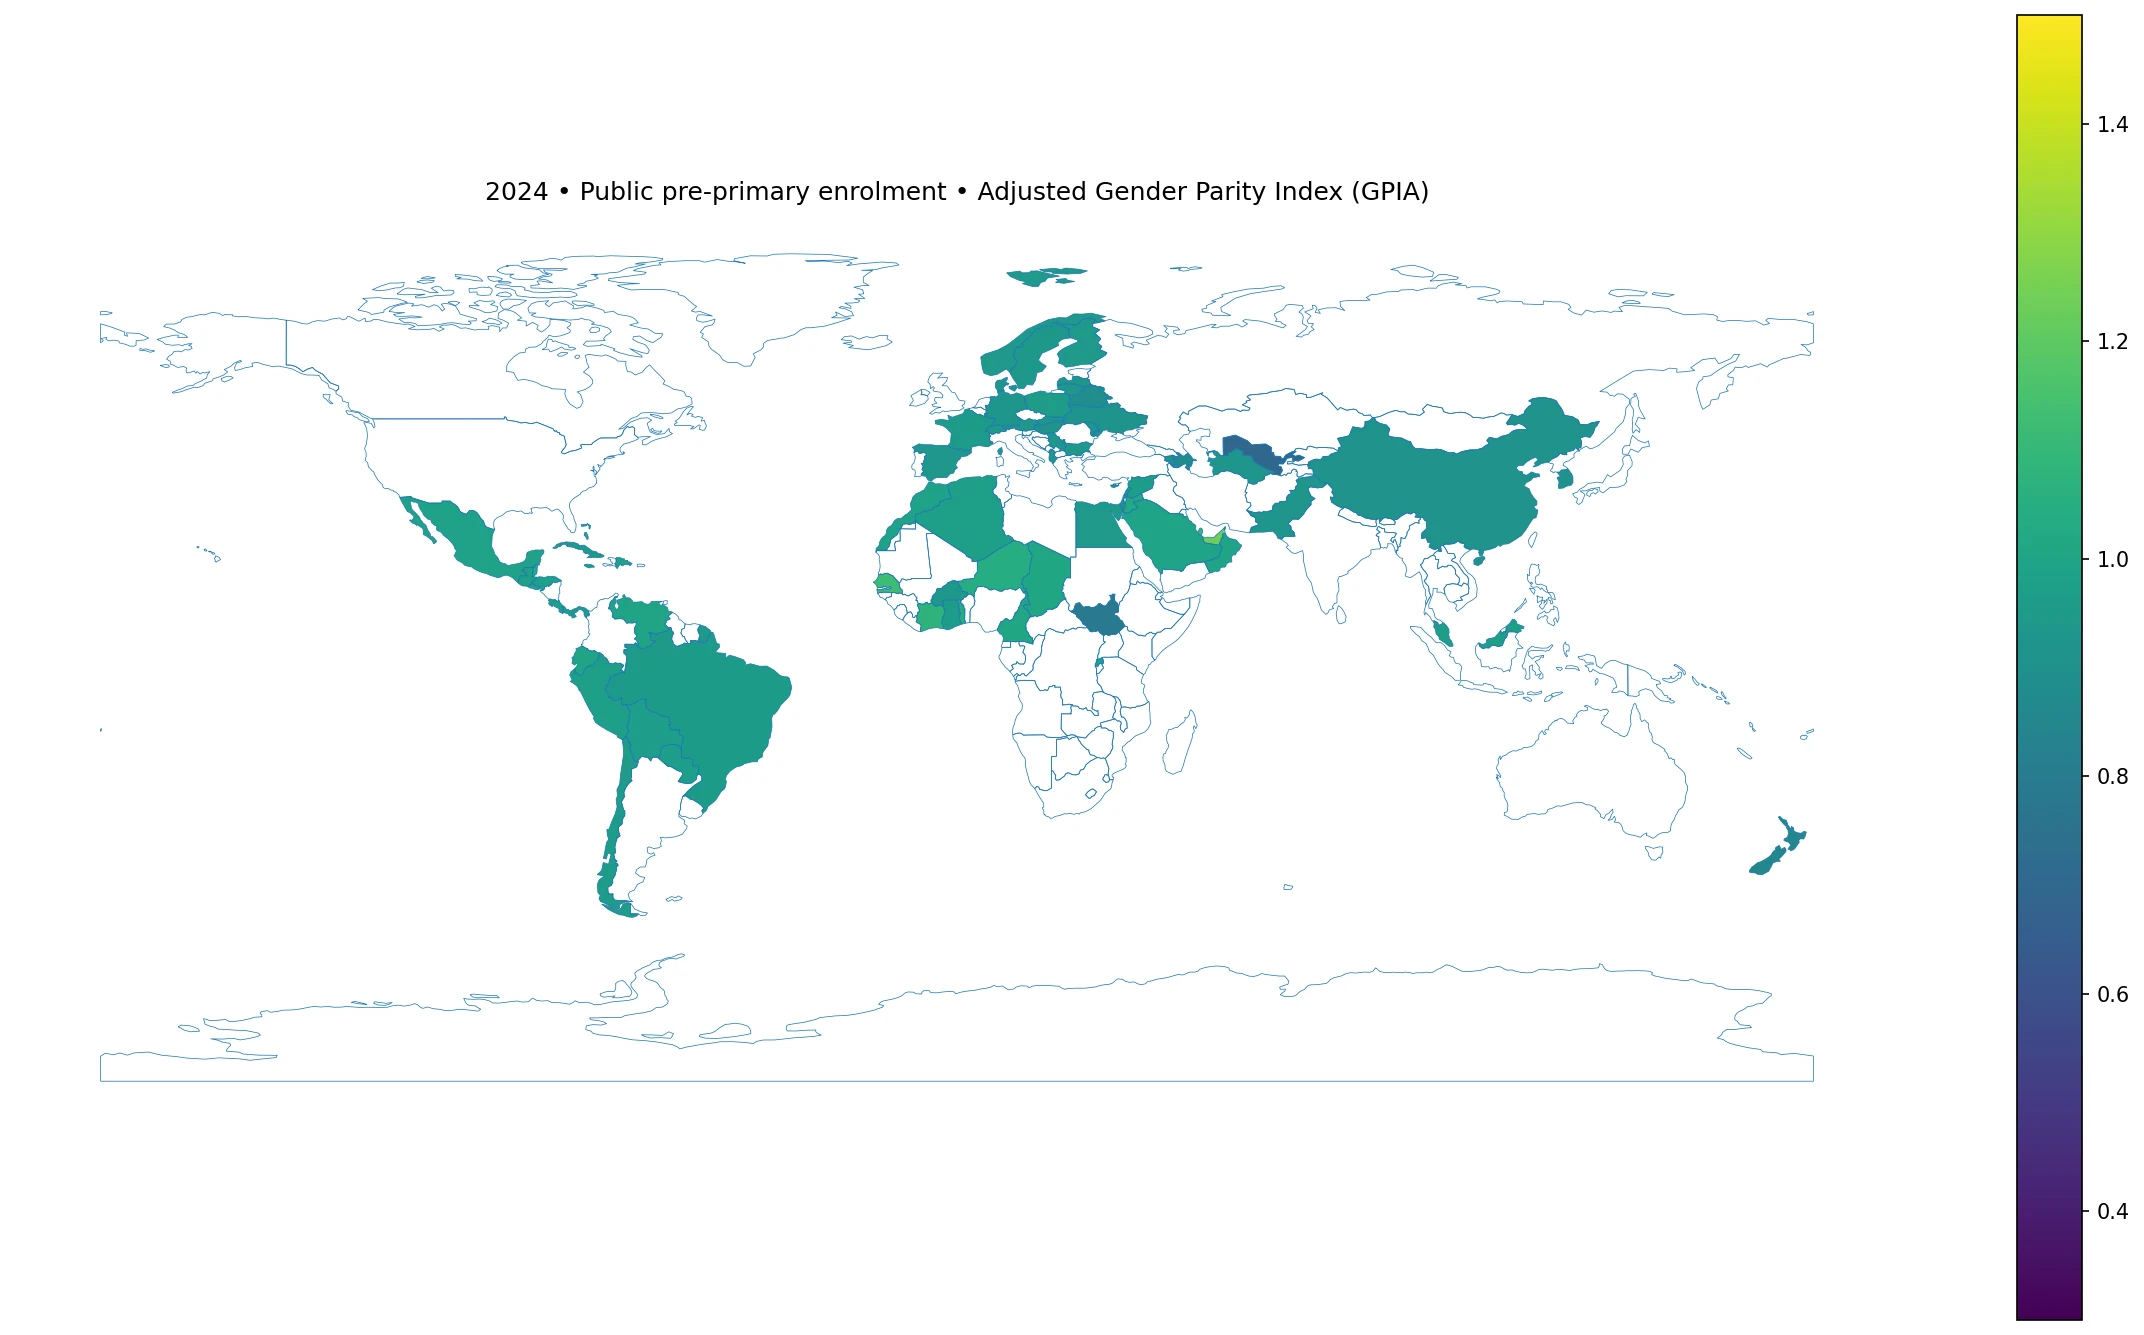
Table of Contents
Values near 1 indicate a similar public-institution share for girls and boys
UNESCO commonly uses 0.97 to 1.03 as the range associated with gender parity. Twenty-three of the 84 observations fall inside that interval. Fifty-two are below 0.97 and nine are above 1.03. The strict parity band is narrow, however. Thirty-nine countries are within 0.05 of 1 and 68 are within 0.10, so most observed systems are relatively close to the center even though many fall outside the formal parity interval.
A value below 0.97 should not automatically be described as a broad educational disadvantage for girls. The indicator is specifically about the percentage of enrolled pre-primary children attending public institutions. Girls and boys could have similar overall pre-primary participation but different public-private distributions. Conversely, both sexes could have low participation and still produce a GPIA close to 1 if their public-institution shares are similar.
The center of the 2024 distribution is around 0.95
The observed range runs from 0.34743 to 1.50000. The first quartile is 0.92938 and the third quartile is 0.98599, placing the middle half of the observations roughly between 0.929 and 0.986. The mean and median are almost identical and both lie slightly below 1. This indicates a broad concentration just below parity, combined with a smaller number of countries that are much farther away.
Only six observations are below 0.8 and another five lie from 0.8 to below 0.9. By contrast, 41 are between 0.9 and 0.97. On the high side, four are above 1.03 but no higher than 1.10, while five exceed 1.10. The distribution therefore has a dense central band and a small set of notable outliers.
Countries where the female public-institution share is much lower
| Country or territory | 2024 GPIA |
|---|---|
| China, Hong Kong Special Administrative Region | 0.34743 |
| Maldives | 0.48170 |
| Uzbekistan | 0.69843 |
| Cayman Islands | 0.70270 |
| South Sudan | 0.79070 |
| Monaco | 0.79890 |
| Gibraltar | 0.84755 |
| New Zealand | 0.85309 |
| China, Macao Special Administrative Region | 0.87619 |
| Azerbaijan | 0.88024 |
Hong Kong SAR China has the lowest observed value at 0.34743, followed by Maldives at 0.48170. Uzbekistan is at 0.69843, Cayman Islands at 0.70270, and South Sudan at 0.79070. Monaco records 0.79890, Gibraltar 0.84755, New Zealand 0.85309, Macao SAR China 0.87619, and Azerbaijan 0.88024.
On the below-1 side of the adjusted index, the direction is consistent with a lower female public-institution percentage than the male percentage. The number should not be applied to student counts. A GPIA of 0.35 does not mean there are 35 girls for every 100 boys in pre-primary education. It compares percentages calculated separately within the female and male enrolment populations.
Countries where the female public-institution share is higher
| Country or territory | 2024 GPIA |
|---|---|
| Niue | 1.50000 |
| Cook Islands | 1.39865 |
| United Arab Emirates | 1.23176 |
| Senegal | 1.12211 |
| Qatar | 1.10122 |
| Côte d'Ivoire | 1.07660 |
| Niger | 1.04607 |
| Togo | 1.03571 |
| Belize | 1.03314 |
| Jordan | 1.02556 |
Niue has the highest value at 1.50000 and Cook Islands follows at 1.39865. The United Arab Emirates records 1.23176, Senegal 1.12211, Qatar 1.10122, and Côte d’Ivoire 1.07660. Niger, Togo, Belize, and Jordan are also above 1, although much closer to the parity point.
Values above 1 are adjusted rather than raw female-to-male ratios. A GPIA of 1.50 should therefore not be translated into a statement that the female public share is exactly 50% higher. The most reliable interpretation is to identify the direction and the distance from the parity point.
Countries closest to parity
| Country or territory | 2024 GPIA |
|---|---|
| Mauritius | 0.99913 |
| Ecuador | 1.00230 |
| Venezuela (Bolivarian Republic of) | 1.00270 |
| Saudi Arabia | 0.99666 |
| El Salvador | 0.99660 |
| Bahamas | 1.00342 |
| Barbados | 0.99634 |
| Oman | 0.99533 |
| Cameroon | 1.00824 |
| Mexico | 0.98946 |
Mauritius is closest to 1 at 0.99913. Ecuador is at 1.00230, Venezuela at 1.00270, Saudi Arabia at 0.99666, El Salvador at 0.99660, Bahamas at 1.00342, Barbados at 0.99634, and Oman at 0.99533. Cameroon records 1.00824 and Mexico 0.98946.
Near parity does not tell us whether public pre-primary provision is common. A country in which 20% of female and male enrolment is public and another in which 90% is public can both have a GPIA near 1. The index answers a parity question; the underlying public-institution percentages answer a level question.
Regional medians vary, but coverage is uneven
Among the countries with 2024 observations, the simple median is about 0.985 in Africa, 0.979 in North America, 0.969 in South America, 0.936 in Europe, and 0.928 in Asia. Oceania has only three observed economies in this dataset and a median of about 1.399, so that number should not be generalized to the region as a whole.
These are descriptive medians of available country observations, not official population-weighted UNESCO regional estimates. Each continent has different coverage and a different mix of large and small systems. The map is useful for locating clusters and outliers, but regional averages cannot substitute for country-level institutional context.
Public-institution parity is different from access to pre-primary education
To understand gender differences in access, the most useful companion indicators are female and male pre-primary enrolment rates or participation rates. A GPIA close to 1 can coexist with low participation for both sexes. A GPIA away from 1 can coexist with high participation if girls and boys are distributed differently across public and private providers.
The public share is also not the same as who pays. Private institutions can receive public subsidies, and public institutions can still require families to pay for transport, meals, materials, or other services. Ownership, management, financing, and household cost are related but distinct dimensions of early childhood education.
Why provider patterns can differ by sex
Pre-primary systems are unusually diverse because they often sit at the boundary between education and childcare. Some countries rely heavily on public kindergartens or municipal centers. Others have large private, nonprofit, religious, or employer-supported sectors. Urban-rural differences, public subsidies, the availability of childcare, and parental work patterns can all shape the provider mix.
The GPIA itself does not identify which mechanism matters in a particular country. A country far from 1 should be treated as a case for follow-up rather than as evidence of a specific cause. A stronger analysis would combine the female and male public-institution percentages with overall participation, private-provider shares, public spending, and geographic access to early childhood services.
Important limits on cross-country comparison
First, the dataset contains 84 official 2024 observations rather than full global coverage. Countries without a published observation remain missing; they are not assigned zero or one. Second, the low-resolution world map matches 70 observations directly. Fourteen mostly small states and territories—including Andorra, Barbados, Cook Islands, Hong Kong, Macao, Monaco, and Niue—do not have a separate matching polygon.
Third, GPIA compares percentages rather than student counts. It does not tell us whether more girls or boys are enrolled in pre-primary education overall. Fourth, 2024 is a single-year snapshot. Multiple years would be needed to determine whether a gender gap is narrowing, widening, or fluctuating.
Data source and calculation method
The source is UNESCO Institute for Statistics indicator ETOIP.02.PU.GPIA, the adjusted gender parity index for the percentage of enrolment in pre-primary education in public institutions. The reference year is 2024. The verified dataset contains 84 country and territory observations. The mean, median, quartiles, parity-band counts, and ranking tables are calculated directly from those values.
No missing catalogue unit was converted to zero. ISO3 codes were joined to a low-resolution global administrative boundary layer for the map, with 70 direct polygon matches. All 84 official observations remain in the rankings and distribution statistics regardless of whether the country is visible as a separate polygon.
Frequently Asked Questions
What does a GPIA of 1 mean?
It means the female and male percentages of pre-primary enrolment in public institutions are equal. Values from 0.97 to 1.03 are commonly treated as the parity range.
Does a GPIA of 1.5 mean the female share is 50% higher?
No. Values above 1 are transformed by the adjusted-index formula, so they are not direct percentage differences. Read direction and distance from 1 instead.
Does this index measure overall pre-primary participation by gender?
No. It compares the public-institution share within pre-primary enrolment. Overall participation requires separate enrolment or participation indicators.
Related Articles
Green Map creates custom-edited map images using open geographic data sources such as geoBoundaries, Natural Earth, OpenStreetMap, and government open data. These maps are edited visual materials, not raw data files, and are provided for education, documents, presentations, and graphic reference.