Eurostat’s 2025 enterprise digitalisation data show a broad cross-country spread in the share of businesses that do not use any of the artificial-intelligence technologies covered by the survey. Across 32 reporting countries, the rate ranges from 57.97% in Denmark to 94.35% in Romania. Finland is at 62.18%, Sweden at 64.65%, Luxembourg at 65.38%, and Belgium at 65.46%. At the high end, Albania records 90.45%, Cyprus 90.37%, Poland 90.20%, and Montenegro 89.95%.
The unweighted mean across the 32 observations is 79.25% and the median is 79.05%. The first quartile is 72.76% and the third quartile is 88.14%, while the full range spans 36.38 percentage points. The mean and median are almost identical, so the centre of the distribution is not being pulled far to one side by a small number of observations. The large range nevertheless shows that the prevalence of non-use differs substantially among countries under a common definition.
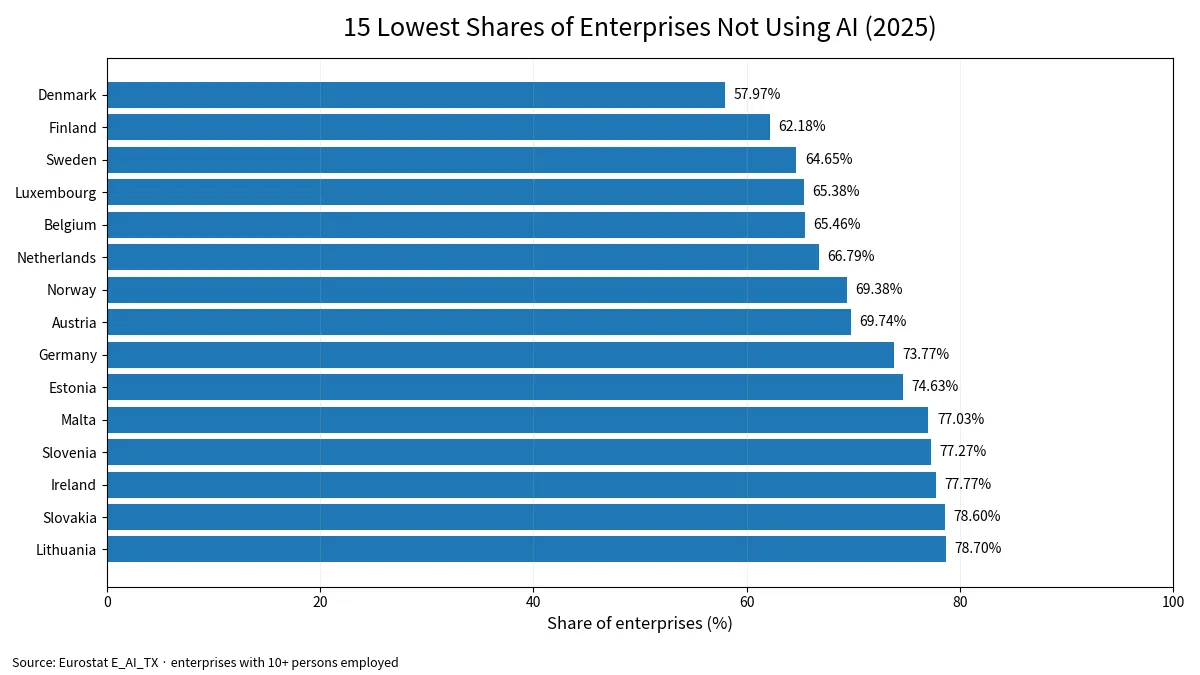
Table of Contents
E_AI_TX measures non-use, so the direction matters
E_AI_TX should not be read like a conventional AI-adoption ranking. Its numerator is enterprises that do not use the AI technologies listed in the Eurostat survey. A higher percentage therefore means that non-use is more common, whereas a lower percentage means that fewer enterprises are in the non-use group. Reversing that interpretation would reverse the meaning of the country comparison.
The enterprise-size scope is also important. The data cover enterprises with at least ten persons employed and are expressed as a percentage of enterprises, not employees. A large company and a smaller eligible company each count as one enterprise. The measure does not say how many AI tools a business uses, how many employees use them, how much is invested, or whether the technology improves productivity. It also does not measure digitalisation in general: a company can use cloud services, standard automation, databases, or e-commerce and still be classified as not using the AI technologies in this indicator.
Lower non-use shares are concentrated in several Nordic and Benelux observations
Denmark, Finland, and Sweden are the only three observations below 65%, while Norway stands at 69.38%. The simple average for Denmark, Finland, Norway, and Sweden is 63.55%, which is 15.70 percentage points below the 32-country mean. Belgium, the Netherlands, and Luxembourg are tightly grouped at 65.46%, 66.79%, and 65.38%, giving the three Benelux observations a simple average of 65.88%.
Austria at 69.74%, Germany at 73.77%, and Estonia at 74.63% are also below the overall mean. Yet geographic proximity does not guarantee similar values. Within the Baltic group, Lithuania is at 78.70% and Latvia at 87.79%, well above Estonia. The data establish these differences but do not identify their causes. Explaining them would require additional information on industry mix, firm size, digital skills, investment, regulation, and other conditions.
Half of the country observations lie between 72.76% and 88.14%
The interquartile range provides a useful view of the middle of the distribution. One quarter of the observations are below 72.76%, one quarter are above 88.14%, and the middle half lie between those two values. Ten countries are below 75%, eleven are from 75% to under 85%, and eleven are at 85% or above. Using a slightly finer split, three are below 65%, seven are from 65% to under 75%, eleven are from 75% to under 85%, and eleven are at least 85%.
The eight countries with the lowest non-use shares average about 65.25%, while the eight with the highest shares average about 90.40%. That is a gap of roughly 25.15 percentage points between the two groups. This is useful as a descriptive measure of dispersion, but it is not a performance score. The averages give every country equal weight and therefore cannot be interpreted as the share of all European enterprises in either group.
Small percentage-point differences can create several positions in the middle
A dense middle cluster illustrates why the original percentages matter more than ordinal position. Czechia is at 79.30%, Spain 78.80%, Lithuania 78.70%, Slovakia 78.60%, Ireland 77.77%, Slovenia 77.27%, and Malta 77.03%. Several of those observations are separated by only a few tenths of a percentage point. A difference of several places in an ordered table can therefore represent a very small underlying difference.
Germany, France, Italy, and Spain have a simple four-country average of 79.10%, almost identical to the 32-country mean of 79.25%. That comparison is informative about the location of those four observations, but it should not be called a weighted average for large European economies. The underlying enterprise populations differ greatly, and the table does not assign weights for the number of firms, workers, or economic output.
A high non-use rate is not the same as an absence of digital technology
Romania at 94.35%, Albania at 90.45%, Cyprus at 90.37%, and Poland at 90.20% have high E_AI_TX values. That means a large share of eligible enterprises reported using none of the AI technologies defined for this measure. It does not mean that businesses in those countries do not use digital tools. The indicator is much narrower than overall digital maturity and does not directly measure cloud computing, enterprise software, data management, online sales, or ordinary process automation.
The measure also does not reveal whether non-users have considered adopting AI, whether they face skills shortages, legal uncertainty, data constraints, cost barriers, or other obstacles. Eurostat collects related information on reasons for non-use and on enterprises that have considered AI, but those are separate indicators. This country table should therefore be used to describe the prevalence of non-use, not to infer a single cause behind it.
All 32 reporting-country values for 2025
The table below orders the 2025 E_AI_TX observations from the lowest non-use share to the highest. It is not a ranking of AI competitiveness. Lower values indicate that a smaller proportion of eligible enterprises reported using none of the listed AI technologies; higher values indicate that non-use was more common. Every observation uses the same enterprise-size, unit, year, and industry aggregation supplied with this dataset.
| Order | Country | Enterprises not using AI |
|---|---|---|
| 1 | Denmark | 57.97% |
| 2 | Finland | 62.18% |
| 3 | Sweden | 64.65% |
| 4 | Luxembourg | 65.38% |
| 5 | Belgium | 65.46% |
| 6 | Netherlands | 66.79% |
| 7 | Norway | 69.38% |
| 8 | Austria | 69.74% |
| 9 | Germany | 73.77% |
| 10 | Estonia | 74.63% |
| 11 | Malta | 77.03% |
| 12 | Slovenia | 77.27% |
| 13 | Ireland | 77.77% |
| 14 | Slovakia | 78.60% |
| 15 | Lithuania | 78.70% |
| 16 | Spain | 78.80% |
| 17 | Czechia | 79.30% |
| 18 | France | 81.53% |
| 19 | Italy | 82.29% |
| 20 | Hungary | 83.44% |
| 21 | Croatia | 84.24% |
| 22 | Portugal | 87.28% |
| 23 | Latvia | 87.79% |
| 24 | Bulgaria | 87.80% |
| 25 | Bosnia and Herzegovina | 89.16% |
| 26 | Türkiye | 89.77% |
| 27 | Serbia | 89.88% |
| 28 | Montenegro | 89.95% |
| 29 | Poland | 90.20% |
| 30 | Cyprus | 90.37% |
| 31 | Albania | 90.45% |
| 32 | Romania | 94.35% |
What this comparison can and cannot establish
The data establish the cross-country level and dispersion of AI non-use under one Eurostat definition in 2025. Denmark has the lowest observed share at 57.97%, Romania the highest at 94.35%, and both the mean and median are close to 79%. The quartiles show that the middle half of the observations still covers more than 15 percentage points, so national variation remains substantial even away from the extremes.
A single year cannot show the speed of adoption or establish why one country differs from another. It cannot measure intensity of use, investment returns, productivity effects, or the share of workers using AI. The classification also depends on the technology categories in the survey. For trend or causal analysis, the appropriate next step would be to combine E_AI_TX with earlier years, AI-technology-specific use rates, enterprise-size breakdowns, industry breakdowns, and the separate Eurostat indicators on barriers and consideration of AI adoption.
Source and definition
The source is the Eurostat isoc_eb_ai annual dataset for 2025. The indicator is E_AI_TX, enterprise size is GE10, the unit is PC_ENT, and the industry aggregate is C10-S951_X_K. The ordering, mean, median, quartiles, range, and group counts in this article are calculated directly from the 32 country observations under the same definition. No missing value is replaced with zero and the national rates are not weighted by country size.
Frequently Asked Questions
Which country has the lowest share of enterprises not using AI technologies in 2025?
Denmark is lowest among the 32 reporting countries at 57.97%, followed by Finland at 62.18% and Sweden at 64.65%.
What does a lower E_AI_TX value mean?
It means a smaller share of eligible enterprises reported using none of the AI technologies covered by the survey. This is a non-use indicator, so its direction is opposite to a conventional adoption-rate chart.
What are the mean and median across the 32 countries?
The unweighted mean is 79.25% and the median is 79.05%. The first quartile is 72.76% and the third quartile is 88.14%.
Can E_AI_TX be treated as an overall AI competitiveness score?
No. It measures the percentage of eligible enterprises not using the listed AI technologies and does not combine investment, productivity, skills, intensity of use, or broader digitalisation.
Related Articles
Green Map creates custom-edited map images using open geographic data sources such as geoBoundaries, Natural Earth, OpenStreetMap, and government open data. These maps are edited visual materials, not raw data files, and are provided for education, documents, presentations, and graphic reference.