Financial access among people ages 15–24 varies sharply across reporting economies. Using 2024 World Bank observations with reported values for 139 economies, the median share of young adults who had an account at a financial institution or personally used a mobile-money service was 62.0%, while the mean was 63.4%. The global distribution stretches from single-digit coverage to reported values of 100%.
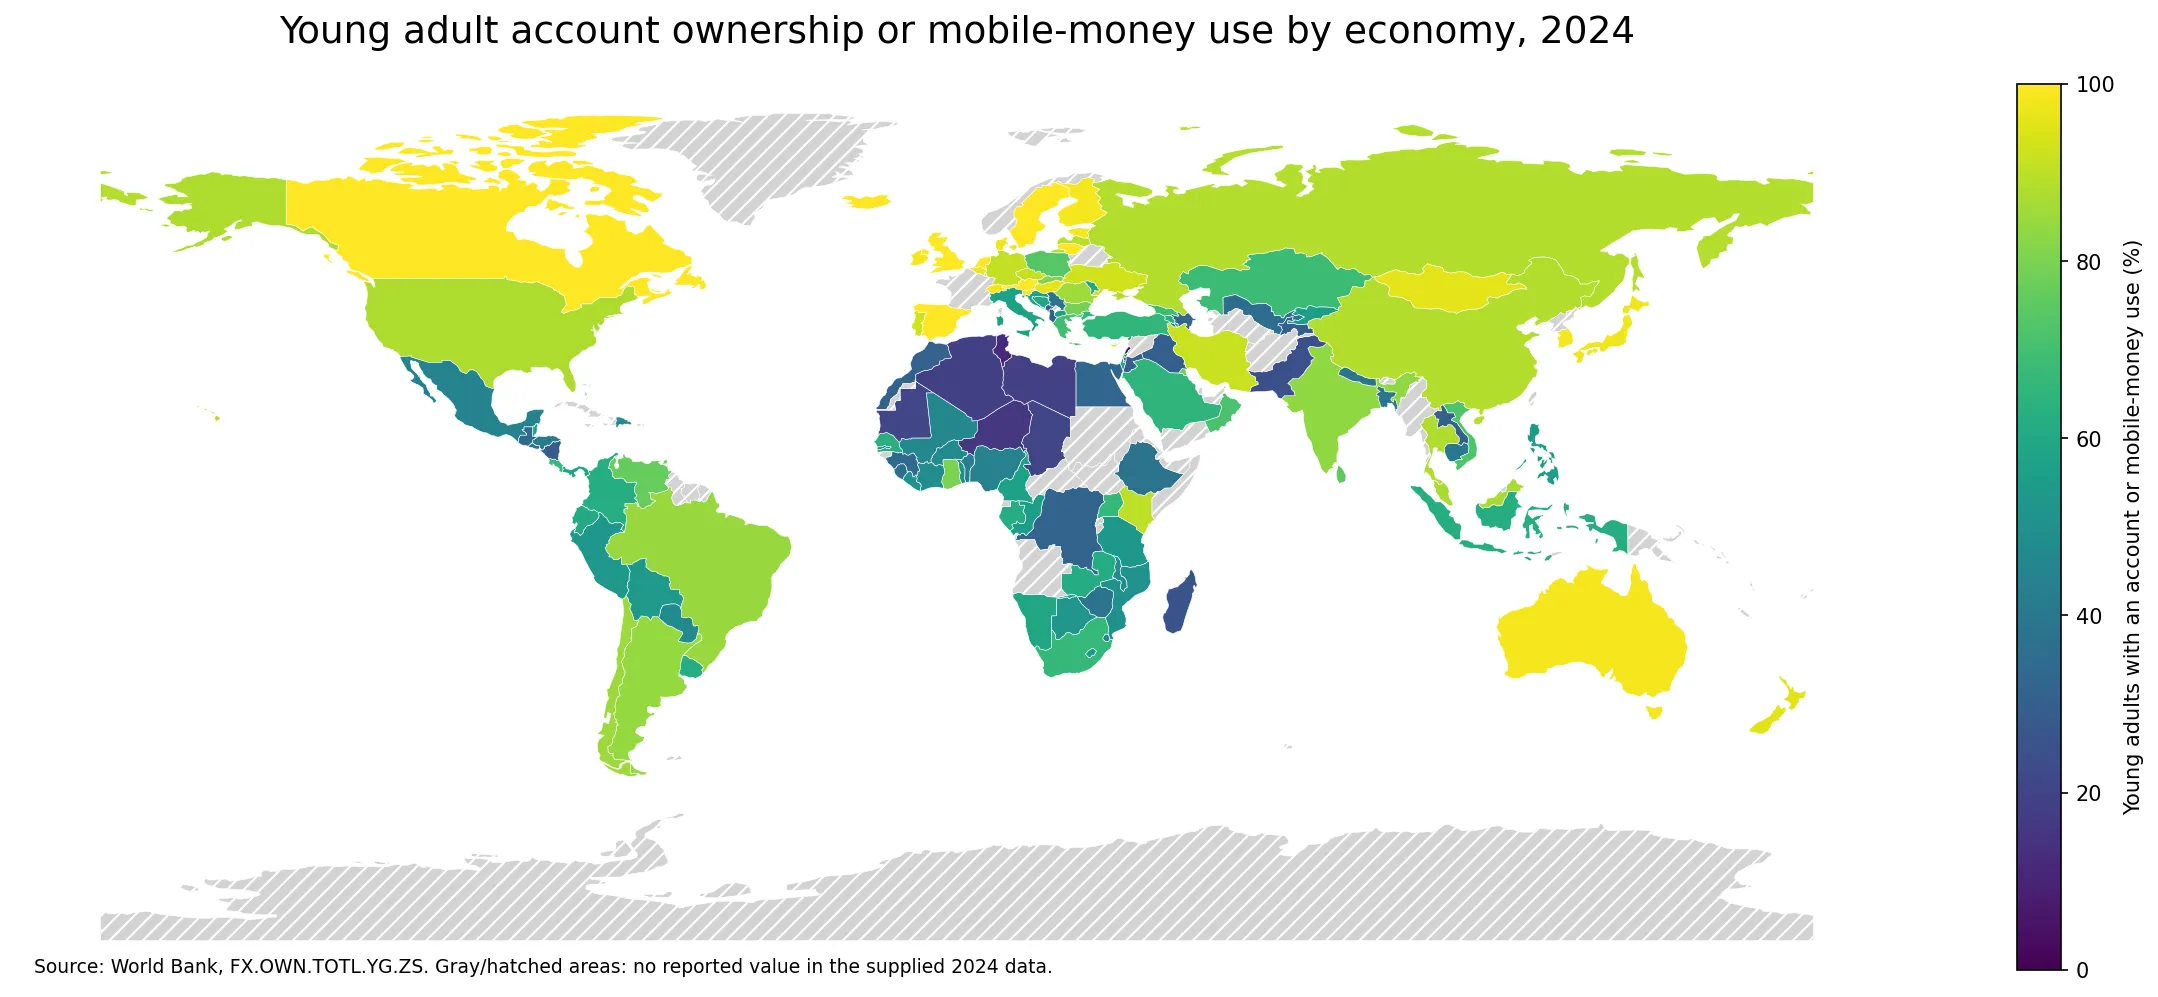
Table of Contents
How wide is the 2024 gap in young adult financial access?
The 25th percentile is 41.3% and the 75th percentile is 89.1%, so the middle half of reporting economies spans nearly 48 percentage points. That spread is large enough that a single global average hides much of the geographic pattern.
The indicator is broader than conventional bank-account ownership. It counts respondents who report having an account, alone or jointly, at a bank or another financial institution, or who personally used a mobile-money service during the previous 12 months. Mobile finance can therefore matter substantially in economies where branch-based banking is not the main route to everyday transactions.
The distance between the highest and lowest reported values
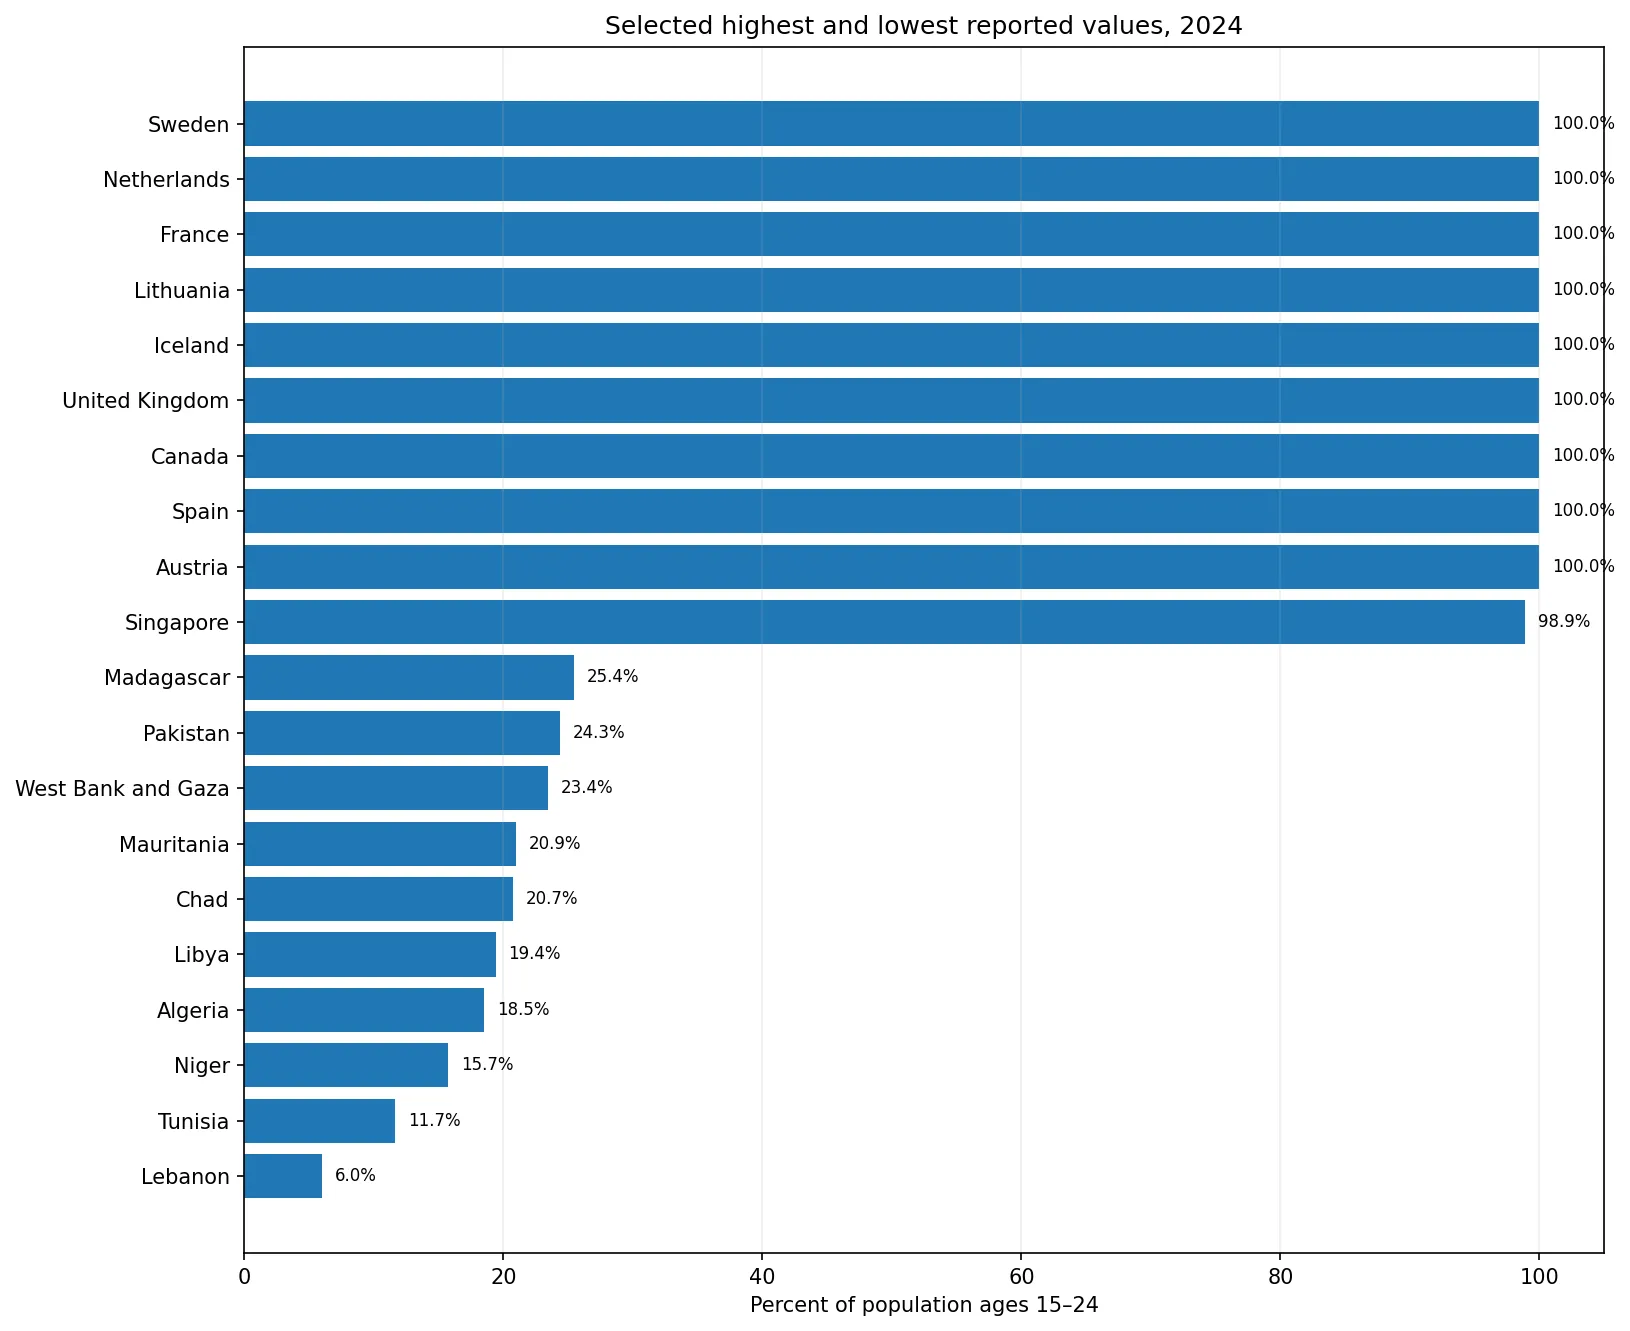
Austria, Canada, Spain, France, the United Kingdom, Iceland, Lithuania, the Netherlands and Sweden each have a reported value of 100% in the supplied observations. Singapore, Australia, Finland, Slovenia and Ireland are also above 98%. At the other end, Lebanon is about 6.0%, Tunisia 11.7%, Niger 15.7%, Algeria 18.5% and Libya 19.4%.
These differences can sit alongside variation in identification systems, banking infrastructure, mobile-payment networks, labor-market participation, household income and the cost of financial services. The indicator by itself does not establish which factor caused a particular country value, so the map is best read as a descriptive view of access rather than a causal ranking.
Geographic patterns and country contrasts
Many European economies cluster in the highest range, while lower reported values appear in parts of North Africa, West Asia and Sub-Saharan Africa. Yet neighboring economies can differ substantially. Large emerging economies also occupy different positions: China is 88.6%, India 83.3%, Brazil 84.4% and the United States 87.7%.
The map also shows why regional labels should not substitute for country-level observations. Broad clusters exist, but there are numerous exceptions and transitions within the same region. For practical comparison, the exact reported value and its survey definition matter more than assumptions based on geography alone.
Selected high and low observations
| Economy | Share of ages 15–24 |
|---|---|
| Austria | 100.0% |
| Canada | 100.0% |
| Spain | 100.0% |
| France | 100.0% |
| United Kingdom | 100.0% |
| Iceland | 100.0% |
| Lithuania | 100.0% |
| Netherlands | 100.0% |
| Lebanon | 6.0% |
| Tunisia | 11.7% |
| Niger | 15.7% |
| Algeria | 18.5% |
| Libya | 19.4% |
| Chad | 20.7% |
| Mauritania | 20.9% |
| West Bank and Gaza | 23.4% |
A reported value of 100% should be interpreted as the survey observation for this indicator, not as proof that every young person uses every type of financial product. Likewise, a low value does not directly measure service quality, account activity, balances, credit access or financial resilience.
How to interpret the indicator carefully
- The reference year is 2024, and 139 economies have reported values in the supplied data.
- Missing observations are not zeros; they remain separate from the measured distribution.
- The measure combines financial-institution account ownership with personal mobile-money use.
- Small decimal differences should not be over-interpreted when survey systems and financial structures differ across economies.
- The indicator does not cover every dimension of financial inclusion, such as borrowing, savings balances, transaction frequency or service quality.
Why focus specifically on ages 15–24?
The 15–24 age range overlaps with the transition from school to work and with the first years of independent income and spending. Access to an account or mobile-money service can support wage receipt, transfers, online payments and saving. Looking separately at young adults can reveal gaps that an all-adult average may mask.
For a fuller picture, this measure can be compared with youth employment, education participation, internet access, mobile-phone adoption and urbanization. Such comparisons should use compatible years and definitions, and correlation should not be treated as proof of causation.
Data and method
The analysis uses World Bank indicator FX.OWN.TOTL.YG.ZS. The geographic unit is country or reporting economy, the unit is percent of the population ages 15–24, and the reference year is 2024. Observations without a value were excluded from rankings and summary statistics and were not replaced with zero on the map. All descriptive statistics shown here were calculated directly from the supplied observations.
Frequently Asked Questions
Does this indicator measure only bank-account ownership?
No. It includes having an account at a financial institution or personally using a mobile-money service in the previous 12 months.
Were missing country values treated as zero?
No. Missing observations were excluded from rankings and statistics and are shown separately as no data on the map.
How many economies have a 2024 value in this comparison?
The supplied World Bank data contain reported 2024 values for 139 countries and economies.
Related Articles
Green Map creates custom-edited map images using open geographic data sources such as geoBoundaries, Natural Earth, OpenStreetMap, and government open data.
These maps are edited visual materials, not raw data files, and are provided for education, documents, presentations, and graphic reference.