World Bank indicator NV.AGR.TOTL.CN reports agriculture, forestry and fishing value added in current local currency units (LCU). The 2024 table contains 217 country/economy rows, with 187 numeric observations and 30 source-missing rows. That coverage is broad enough to look global, but the amounts should not be turned into a cross-country ranking or a conventional value choropleth. A unit of rupiah, yen, rupee, euro or another local currency is not the same measurement unit in monetary terms.
This article therefore treats the current-LCU series as a measurement and interpretation problem rather than forcing the raw numbers into a misleading league table. The map shows where a 2024 observation is available, not which country has the “largest” raw LCU number. For a common-currency comparison of monetary scale, a current-US-dollar series is more suitable; for real change through time, a constant-price series or a real growth measure is usually the better tool.
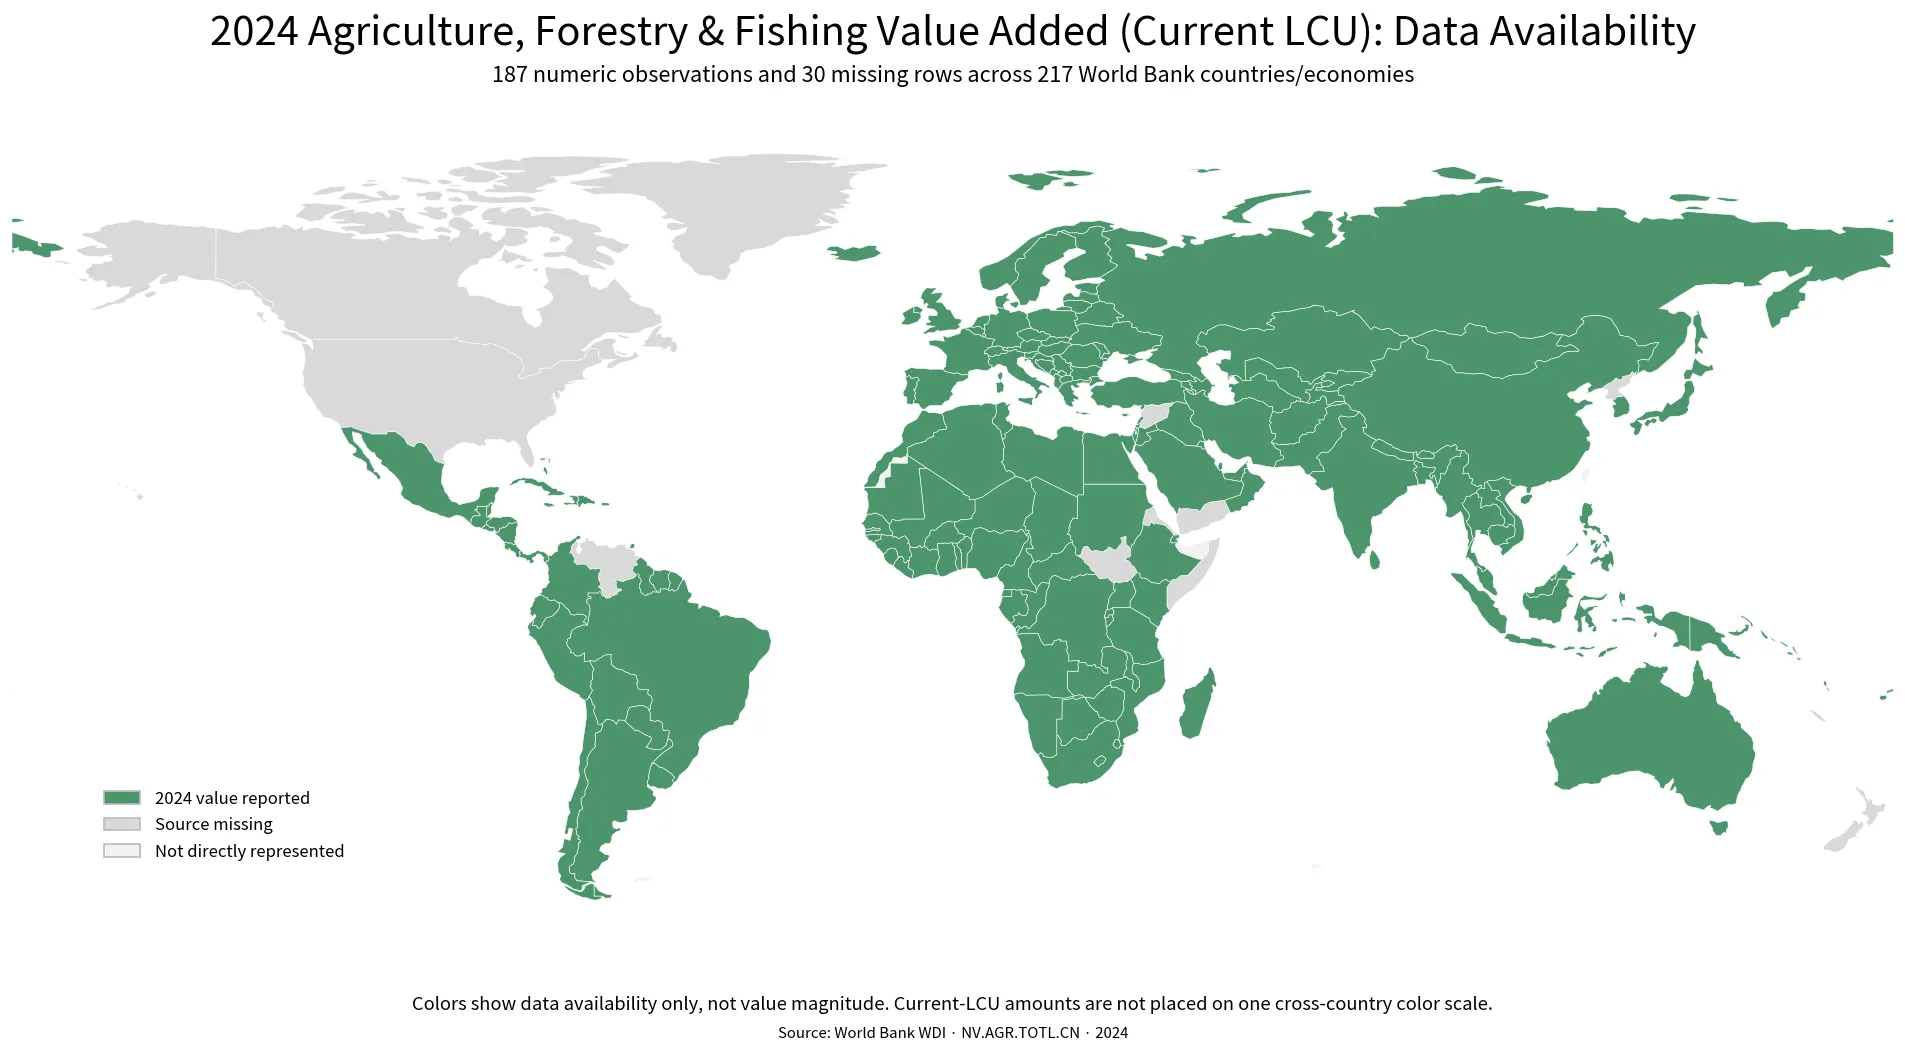
Table of Contents
What current LCU actually means
LCU stands for local currency unit. In this World Bank series, each economy is reported in its own current-price monetary unit. “Current” means the values are not adjusted to remove price changes over time. Two interpretation issues therefore exist at once: within a country, a rise can reflect both real activity and prices; across countries, the monetary units themselves differ.
The sector follows the World Bank description of agriculture, forestry and fishing corresponding to ISIC Rev. 4 divisions 01–03. Value added is the contribution generated by production after intermediate goods and services are deducted from output. It is not agricultural land area, employment, crop tonnage, productivity, or agriculture’s percentage share of GDP. Those questions require different indicators.
The 2024 file has numeric values for 187 of 217 rows
The supplied same-year table contains 217 country/economy rows. A numeric 2024 observation is present for 187, while 30 are source-missing. That is a numeric coverage rate of about 86.2%. Missing entries remain missing rather than being replaced with zero or a value from another year.
| 2024 dataset check | Result |
|---|---|
| Country/economy master rows | 217 |
| Numeric observations | 187 |
| Source-missing rows | 30 |
| Numeric coverage | 86.2% |
The simplified boundary layer used for the availability map does not contain polygons for every small island or separately reported economy in the World Bank master set. For that reason, the number of visible polygons is not the same as the 217-row statistical universe. The 187-versus-30 counts come from the official data table; the map is a supporting view of geographic availability.
Why the raw numbers are not a country ranking
The raw positive values span almost ten orders of magnitude, from millions of local units to tens of quadrillions. That enormous range is not a clean measure of differences in agricultural economic scale. Currency denomination is part of the number. A country whose currency is quoted in many units per dollar can naturally have a much larger LCU figure than a country whose local currency unit has a high monetary value, even before differences in sector size are considered.
The selected rows below are shown alphabetically rather than ranked. They illustrate what the source actually stores: a 2024 value in each economy’s own LCU. The numbers should be interpreted within their national monetary context, not compared row-to-row as though they shared one currency.
| Country/economy | 2024 raw value (current LCU) | Interpretation |
|---|---|---|
| Australia | 54,556,000,000 | Value in Australia’s local-currency unit |
| Brazil | 677,575,052,400 | Value in Brazil’s local-currency unit |
| Germany | 39,584,000,000 | Value in Germany’s local-currency unit |
| India | 55,896,828,047,600 | Value in India’s local-currency unit |
| Indonesia | 2,791,665,200,000,000 | Value in Indonesia’s local-currency unit |
| Japan | 6,077,600,000,000 | Value in Japan’s local-currency unit |
A raw figure that is ten times another country’s figure does not establish that its agriculture, forestry and fishing value added is economically ten times larger. Without a common currency or another valid normalization, “top 10,” “lowest country,” and regional high-value clusters would mainly mix economic scale with currency-unit scale. A logarithmic color scale would compress the numbers but would not solve that unit mismatch.
Better choices for cross-country comparison
If the question is the monetary size of the sector across countries in one year, the World Bank’s current-US-dollar version of the concept provides a common nominal currency. Exchange rates still affect that series, but at least every observation is expressed in the same unit. If the question is the importance of the sector inside each economy, a percentage-of-GDP measure is a better fit because it normalizes by total economic output.
For changes in real activity over time, a constant-price series or real growth rate is preferable to current LCU. A current-price local-currency increase can reflect inflation as well as changes in output and value added. Choosing among current LCU, current US dollars, constant prices, shares and growth rates should be driven by the question, not by which series produces the most dramatic map.
Where current LCU is useful
Current LCU is valuable for domestic-accounting work. It can be used to follow nominal sector value added inside one country, compare it with other national-account series expressed in the same local unit, or construct ratios when both numerator and denominator share a consistent monetary basis. It also avoids adding exchange-rate conversion to the original national-currency observation.
For long time series, however, analysts still need to check for currency redenominations, statistical revisions and methodological breaks. Current LCU is not automatically comparable across decades just because the country name is unchanged. Metadata and series continuity matter, especially when large nominal jumps appear.
Why the featured map shows availability instead of magnitude
A choropleth is useful only when its color scale represents a quantity that is meaningfully comparable across mapped areas. Current-LCU amounts fail that test across countries. Coloring the largest raw numbers darkest would create a strong visual hierarchy without a consistent monetary unit underneath it. The map therefore uses a binary status that is comparable: whether a 2024 observation exists or is missing.
This is a deliberate integrity choice rather than a lack of data. The dataset is substantial, but more data does not remove a unit problem. Showing availability makes the geographic coverage transparent while avoiding a false impression that the raw LCU values form one world ranking.
Source, definition and limits
The source is World Bank World Development Indicators, NV.AGR.TOTL.CN. The analysis uses the 2024 single-year country/economy table, excludes aggregate groups, and preserves source-missing observations. The counts of 187 reported values, 30 missing rows and 86.2% numeric coverage are calculated directly from that table.
This series alone cannot tell whether agriculture is unusually important to an economy, whether farmers are more productive, whether real output is growing, or how much land is used for agriculture. Those require ratios, productivity measures, constant-price data or land-use indicators. The safest interpretation of NV.AGR.TOTL.CN is narrow and literal: nominal agriculture, forestry and fishing value added expressed in each economy’s own current local currency unit.
Frequently Asked Questions
Can current-LCU values be used to rank countries by agriculture value added?
Not directly. Each economy is measured in a different local currency unit, so the raw magnitudes do not share one monetary scale. A common-currency series is more appropriate for cross-country monetary ranking.
Do missing 2024 rows mean the sector has zero value added?
No. Thirty of the 217 rows are source-missing and were not converted to zero. Missing means no numeric observation is available in this 2024 table.
What is current LCU useful for?
It is useful for nominal analysis within one economy and for comparisons with other domestic-account series in the same local currency unit, subject to metadata and continuity checks.
What should I use for cross-country or real-growth comparisons?
For nominal monetary scale across countries, use a common-currency series such as current US dollars. For sector importance, use a share such as percent of GDP. For real change through time, use constant-price or real-growth measures.
Related Articles
Green Map creates custom-edited map images using open geographic data sources such as geoBoundaries, Natural Earth, OpenStreetMap, and government open data.
These maps are edited visual materials, not raw data files, and are provided for education, documents, presentations, and graphic reference.