How often does a student’s first or home language match the language used for instruction by the end of lower secondary education? UNESCO Institute for Statistics (UIS) indicator FHLANGILP.LOWERSEC contains 76 country and area observations for 2022. The median is 90.95%, and the highest observation is 99.53%.
The UIS glossary defines SDG indicator 4.5.2 as the percentage of students whose first or home language is also a language of instruction at selected stages of schooling. The LOWERSEC series refers to the end of lower secondary education. A value of 90% means roughly nine in ten students are classified as learning in a language that matches their first or home language.
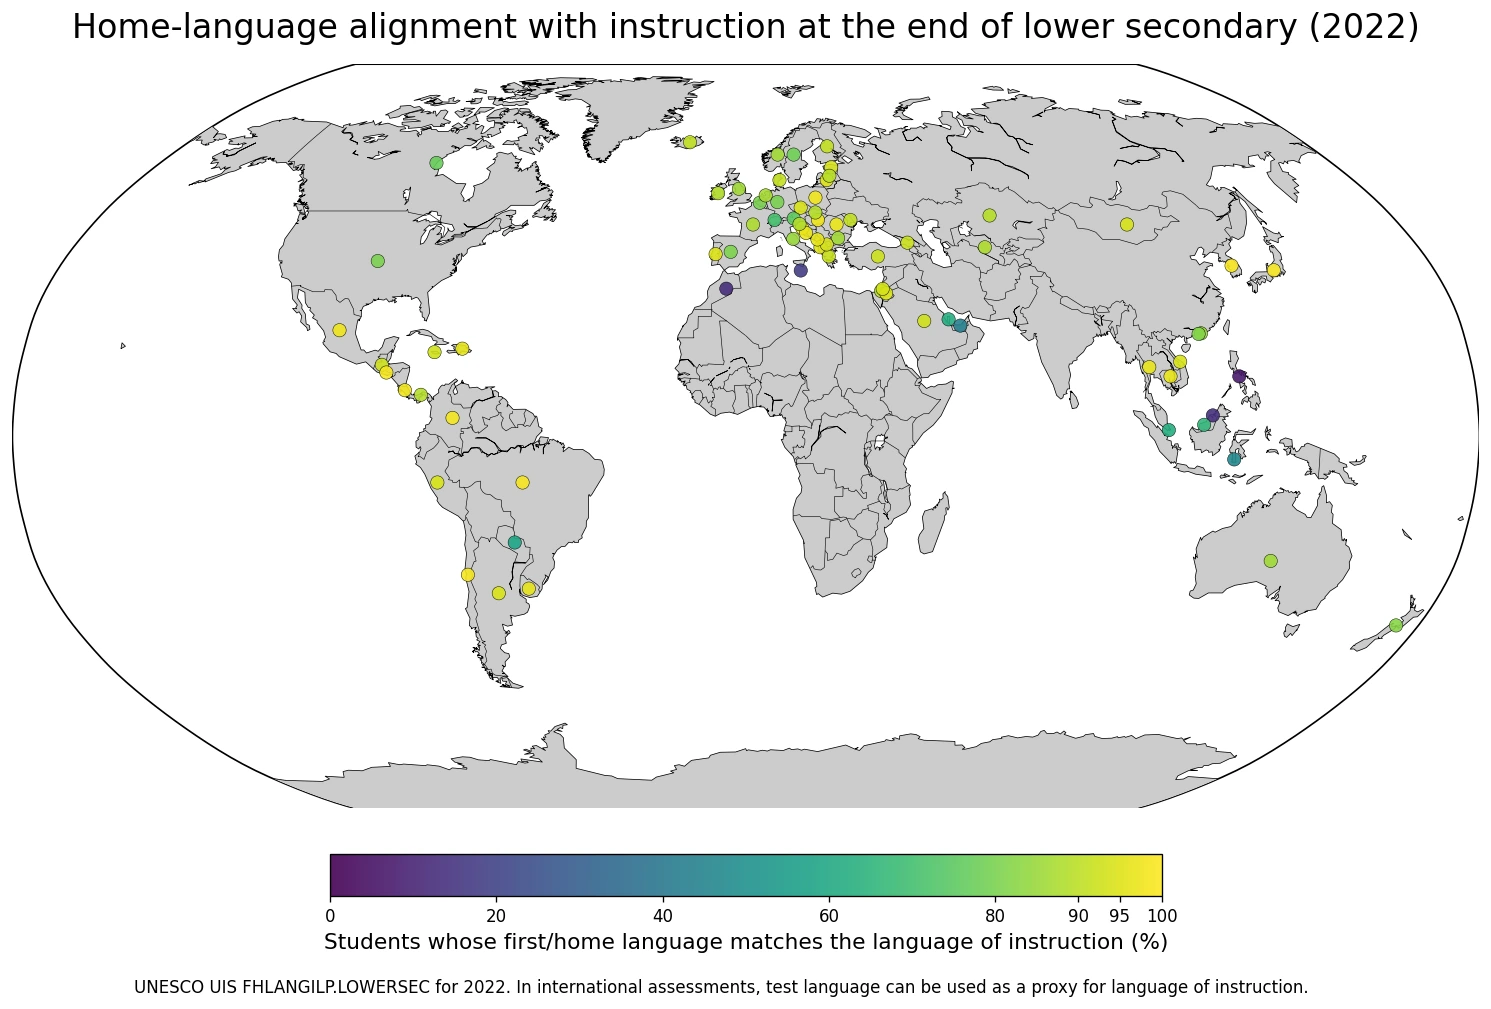
Table of Contents
The median across 76 observations is 90.95%
The median is 90.95% and the unweighted mean is 83.92%. The middle half of the observations lies between 82.07% and 94.85%. 40 observations are at or above 90%, 19 at or above 95%, and 6 at or above 98%.
| Home-language and instruction match | Countries or areas | Share of observations |
|---|---|---|
| Below 20% | 4 | 5.3% |
| 20–49.9% | 2 | 2.6% |
| 50–69.9% | 4 | 5.3% |
| 70–79.9% | 6 | 7.9% |
| 80–89.9% | 20 | 26.3% |
| 90–94.9% | 21 | 27.6% |
| 95% or more | 19 | 25.0% |
At the lower end, 16 observations are below 80%, 10 below 70%, and 6 below 50%. The range extends from 6.98% to 99.53%, so the high median does not imply that all systems are close to universal alignment.
Nineteen observations are at or above 95%
Japan records 99.08%, Brazil 98.70%, Chile 98.57%, El Salvador 98.47%, and Colombia 98.42%. Poland, Hungary, Costa Rica and Mexico are also above 97%. The table keeps the highest observation in the same global ranking.
| Rank | Country or area | 2022 language-alignment share |
|---|---|---|
| 1 | Republic of Korea | 99.53% |
| 2 | Japan | 99.08% |
| 3 | Brazil | 98.70% |
| 4 | Chile | 98.57% |
| 5 | El Salvador | 98.47% |
| 6 | Colombia | 98.42% |
| 7 | Poland | 97.99% |
| 8 | Hungary | 97.75% |
| 9 | Costa Rica | 97.72% |
| 10 | Mexico | 97.29% |
| 11 | Croatia | 97.17% |
| 12 | Romania | 96.91% |
| 13 | Thailand | 96.75% |
| 14 | Serbia | 96.65% |
| 15 | Cambodia | 96.59% |
Values near 100% mean that almost all students in the assessed population are classified as having a first or home language that matches a language of instruction. They do not rank overall education quality or learning achievement, and tiny differences near 100% should not be treated as quality gaps.
The Philippines, Morocco, Brunei and Malta are below 20%
The Philippines is lowest at 6.98%, followed by Morocco at 12.21%, Brunei Darussalam at 13.90%, and Malta at 18.05%. The United Arab Emirates is 42.92% and Indonesia 47.04%; Paraguay, Qatar, Singapore and Malaysia remain below 70%.
| Low-end order | Country or area | 2022 language-alignment share |
|---|---|---|
| 1 | Philippines | 6.98% |
| 2 | Morocco | 12.21% |
| 3 | Brunei Darussalam | 13.90% |
| 4 | Malta | 18.05% |
| 5 | United Arab Emirates | 42.92% |
| 6 | Indonesia | 47.04% |
| 7 | Paraguay | 58.54% |
| 8 | Qatar | 61.48% |
| 9 | Singapore | 61.88% |
| 10 | Malaysia | 65.80% |
| 11 | Switzerland | 70.56% |
| 12 | Austria | 75.09% |
| 13 | Canada | 77.10% |
| 14 | Sweden | 78.43% |
| 15 | Germany | 79.80% |
A low value indicates that many students are classified as learning in a language different from the language they first learned or commonly use at home. It does not automatically imply poor schooling or low learning outcomes, because multilingual systems and second-language learning can take many forms.
International assessments can use the test language as a proxy for instruction
The UIS methodological note for SDG 4.5.2 explains that international learning assessments may not directly record the classroom language of instruction. When that information is unavailable, the test language can be used as a proxy together with questions about how often students use that language at home.
The indicator should therefore not be described as a direct administrative census of every classroom language. It is a standardized international measure that can rely on assessment questionnaires, and the exact source assessment and wording can differ across reporting settings.
Multilingual education can involve more than one language of instruction
A school system can use two or more languages for instruction. If a student’s home language is one of the languages actually used for teaching, the student can still be considered to be learning in a home language even when another instructional language is also present.
Language of instruction should not be reduced to a country’s single official language. Regional, minority and multilingual education arrangements can produce high alignment even in linguistically diverse societies.
A high match rate does not mean a country is linguistically homogeneous
A country with many languages can still report a high alignment share if schools use several local or regional languages effectively. Conversely, a country with one dominant national language can have lower alignment when many students use other languages at home.
The percentage measures alignment, not the number of languages spoken in society. Separate linguistic-demography and policy data are needed to describe diversity itself or explain why a country has a particular value.
The United States, Canada, Germany and Switzerland show different patterns
The United States records 80.15%, Canada 77.10%, Germany 79.80%, and Switzerland 70.56%. Singapore is lower at 61.88% and Malaysia at 65.80%.
These contrasts show that multilingual and migration-rich contexts can produce very different outcomes. The indicator alone cannot identify whether immigration, language policy, school support or regional multilingualism is responsible; those explanations require additional subgroup and policy evidence.
Language alignment is not the same as reading or mathematics proficiency
Learning in an understandable language can matter for education, but FHLANGILP.LOWERSEC is not a test-score measure. Students learning in a familiar language can still face weak schooling, while students learning in a second language can achieve strong outcomes with sufficient support.
A direct analysis of the relationship with learning would need matched reading or mathematics proficiency indicators for the same country, year and student population. The alignment share should remain a language-access measure rather than a learning-quality score.
The common 2022 reference year improves comparability
All 76 observations are dated 2022, avoiding the mixed-year problem common in international education datasets. The synchronized reference year makes the country differences easier to interpret.
Coverage is still incomplete because the indicator depends on assessments or surveys with suitable language-background information. The simple mean of 83.92% is an average of country rows, not a student-weighted global percentage, and missing countries are not assigned zero.
Data scope and source
The analysis uses 76 national-level 2022 observations from the UNESCO Institute for Statistics official API indicator FHLANGILP.LOWERSEC. The metric is the percentage of students at the end of lower secondary education whose first or home language is a language of instruction, both sexes combined.
The observed range is 6.98% to 99.53%, with a median of 90.95% and an unweighted mean of 83.92%. Rankings, quartiles and bands are calculated directly from the supplied values, and all 76 rows were matched to representative map locations.
The main takeaway
The median 2022 home-language and instruction match is 90.95% across the 76 available observations, with 40 countries and areas at or above 90%. At the lower end, 6 observations are below 50%, and the Philippines is lowest at 6.98%.
The series measures whether students learn in a language that matches their first or home language. It does not directly measure linguistic diversity, education quality, teacher performance or reading and mathematics proficiency.
Frequently Asked Questions
What does a 90% value mean?
It means roughly 90% of students at the end of lower secondary are classified as having a first or home language that matches a language used for instruction.
Is the test language always the same as the classroom language?
Not always. When direct classroom-language data are unavailable, international assessments can use the test language as a proxy for language of instruction.
Does a high match rate prove high education quality?
No. The indicator measures language alignment, not learning proficiency, teacher quality or overall education quality.
Related Articles
Green Map creates custom-edited map images using open geographic data sources such as geoBoundaries, Natural Earth, OpenStreetMap, and government open data.
These maps are edited visual materials, not raw data files, and are provided for education, documents, presentations, and graphic reference.