World Bank indicator FX.OWN.TOTL.40.ZS measures account ownership among people ages 15 and older in the poorest 40% of each economy’s income distribution. It covers respondents who report having an account at a bank or another financial institution, alone or jointly, or personally using a mobile money service. In the 2024 dataset, 138 of 217 country-and-area rows have numeric values and 79 are source-missing.
Across the 138 reported observations, the rate ranges from 13.61% to 100.00%. A value of 70% means that about 70 of every 100 people ages 15+ in the bottom 40% of that economy’s income distribution report the qualifying account access. It is not the account-ownership rate for the total population.
The indicator combines traditional financial-institution accounts with mobile-money access under the World Bank definition. This makes it useful for financial-inclusion comparisons because access can expand through digital channels even where bank branches are limited. The measure does not, however, show account balances, savings, credit use, transaction frequency or whether an account is actively used.
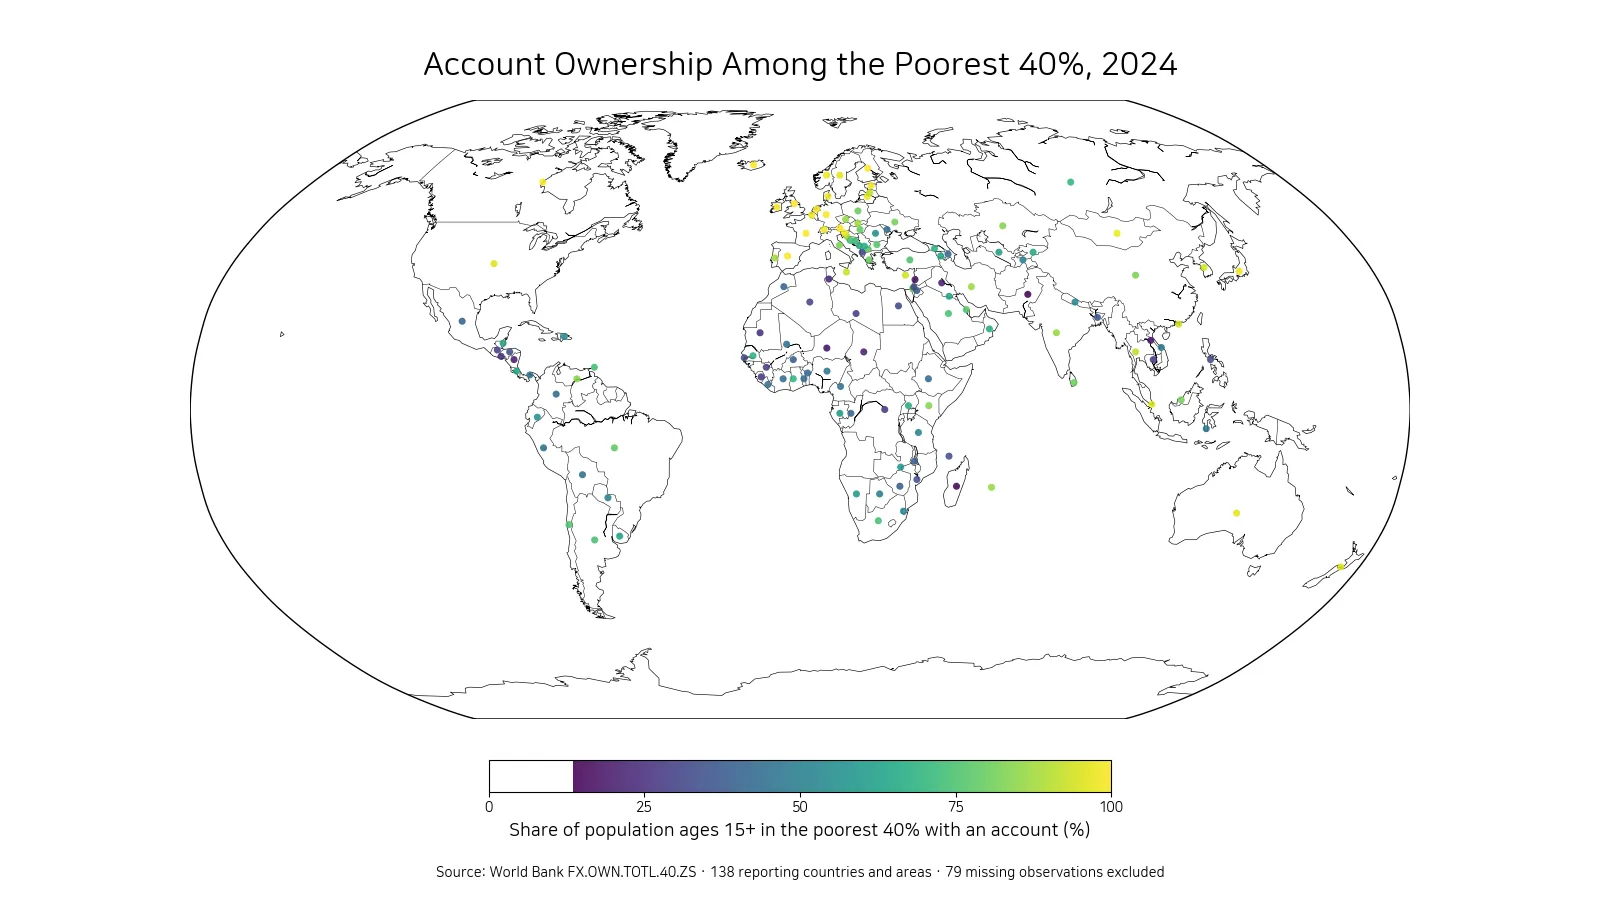
Table of Contents
The highest reported rates are essentially universal
The United Kingdom, Finland and Iceland each have a reported value of 100.00%. Austria follows at 99.19%, Ireland at 99.02%, Spain at 98.76%, Belgium at 98.72%, France at 98.71%, Canada at 98.62% and Germany at 98.55%. Every economy in the top 10 is above 98%.
| Rank | Country or area | Bottom-40% account ownership |
|---|---|---|
| 1 | United Kingdom | 100.00% |
| 2 | Finland | 100.00% |
| 3 | Iceland | 100.00% |
| 4 | Austria | 99.19% |
| 5 | Ireland | 99.02% |
| 6 | Spain | 98.76% |
| 7 | Belgium | 98.72% |
| 8 | France | 98.71% |
| 9 | Canada | 98.62% |
| 10 | Germany | 98.55% |
A reported value of 100% is best understood as the survey-based or estimated indicator reaching 100% under the source methodology. It should not be expanded into a claim that literally every individual has an account under every possible definition. It does indicate that basic account access is essentially universal within the measured group.
The upper group is concentrated in Northern and Western Europe, with Canada also appearing among the top observations. Strong payment infrastructure, identification systems, banking access and digital services can contribute to high inclusion, but this single indicator cannot isolate which factor is responsible.
At the low end, fewer than one in five may have an account
Pakistan records the lowest 2024 value at 13.61%. Madagascar is at 14.11%, Niger at 17.51%, Lebanon at 17.55%, Lao PDR at 18.27% and Nicaragua at 19.59%. Iraq, Chad, Tunisia and Mauritania complete the lowest 10.
| Rank | Country or area | Bottom-40% account ownership |
|---|---|---|
| 1 | Pakistan | 13.61% |
| 2 | Madagascar | 14.11% |
| 3 | Niger | 17.51% |
| 4 | Lebanon | 17.55% |
| 5 | Lao PDR | 18.27% |
| 6 | Nicaragua | 19.59% |
| 7 | Iraq | 20.22% |
| 8 | Chad | 21.07% |
| 9 | Tunisia | 21.66% |
| 10 | Mauritania | 24.33% |
Low account ownership can be consistent with barriers such as distance from financial institutions, identification requirements, fees, limited digital connectivity, lack of trust, irregular income or cash-based economic activity. The indicator identifies where access is low, but it cannot tell us which barrier matters most in each country.
The gap between the maximum and minimum is about 86.39 percentage points. That wide range shows how differently lower-income adults are connected to formal or mobile financial services across reporting economies.
The median is 66.14%, with a very wide middle range
The median across the 138 numeric observations is 66.14% and the simple mean is 63.40%. The first quartile is 41.55% and the third quartile is 86.33%, so half of reported economies fall between roughly 41.55% and 86.33%.
By broad bands, 11 observations are below 25%, 41 are from 25% to under 50%, 30 are from 50% to under 75%, and 56 are 75% or higher. There are 56 observations at or above 75%, but 52 are below 50%, illustrating the split between high-access and low-access environments.
The median is somewhat higher than the mean because the lower tail extends down into the teens while many high-income reporting economies cluster near the upper limit. Quartiles therefore provide a clearer picture of the distribution than a single average by itself.
The map contrasts high European coverage with lower values in several regions
High values form a broad cluster across much of Europe and appear in parts of North America. Lower rates are visible in parts of South Asia, Sub-Saharan Africa, the Middle East and North Africa. Regional patterns are useful for orientation, but within-region differences remain substantial and should not be hidden behind continental averages.
Mobile money can change the geography of financial access. In some economies, people may gain formal financial access through mobile services even when traditional banking networks are thin. In others, physical access, identification, cost or trust can remain important constraints. The map shows where outcomes differ, not which delivery channel caused the difference.
Representative geographic points are used so that small reporting economies remain visible at world scale. A marker is not a bank branch or a mobile-money outlet; it represents one country-or-area percentage for 2024.
The bottom-40% rate is not the same as the overall adult account-ownership rate
This series deliberately focuses on the poorest 40% within each reporting economy. The overall adult account-ownership rate can be higher if middle- and upper-income groups have broader access. The difference between the two measures can be informative about inequality in financial inclusion.
A direct inclusion gap cannot be calculated from this indicator alone. Doing that properly requires the corresponding total-population account-ownership measure for the same year and definition. Without it, statements such as “the poorest 40% trail the national rate by a specific number of percentage points” would not be supported.
The phrase “poorest 40%” is also relative within each economy. The absolute income level of the bottom 40% in a high-income economy can be very different from the bottom 40% in a low-income economy. The indicator compares position within national income distributions rather than a common global income threshold.
Owning an account is different from using it actively
Account ownership is a foundational financial-inclusion measure, but it does not show how frequently the account is used. People may receive wages or public transfers through an account, save regularly, make digital payments, borrow formally, or leave the account mostly inactive. Those behaviors require separate indicators.
The inclusion of mobile money also matters for interpretation. Someone without a traditional bank account may still qualify through personal use of a mobile-money service. This means the indicator captures more than branch-based banking and can reflect different national pathways toward financial access.
A deeper financial-inclusion analysis can add digital payment use, formal saving, formal borrowing, dormant-account measures, and gender or age gaps. Those variables help distinguish simple access from the depth and quality of financial participation.
Seventy-nine missing observations are not zeros
The full file contains 217 country-and-area rows, but only 138 have numeric 2024 observations. The remaining 79 rows are source-missing. They are excluded from the map, rankings and summary statistics rather than being converted to 0%.
Missing data are fundamentally different from a genuinely low rate such as Pakistan’s 13.61%. A numeric low value belongs in the comparison, while a source-missing row means the 2024 rate is unavailable. Because missing coverage is substantial, the results should be described as a comparison of 138 reporting countries and areas rather than a complete global census.
This distinction is especially important for a map. Coloring missing economies as zero would falsely suggest extreme financial exclusion where no 2024 observation was actually supplied.
Large gaps show access, not financial well-being
The contrast between rates near 100% and rates in the teens demonstrates a major difference in basic financial access among lower-income adults. Broad account access can create a platform for receiving payments, saving or transferring money, but the indicator does not measure household wealth, financial resilience, debt burden or the affordability of financial services.
Policy analysis therefore needs more than ownership alone. Costs, consumer protection, identity systems, connectivity, financial literacy and access to credit or savings products can all affect whether formal financial access translates into useful financial services.
What matters most in the 2024 comparison
Three findings stand out. First, reported account ownership among the bottom 40% ranges from 13.61% to 100%. Second, the median is 66.14%, while half of reporting economies lie between about 41.55% and 86.33%. Third, 79 country-or-area rows have no 2024 observation and must not be interpreted as zero.
A useful reading sequence is to start with the map for geographic patterns, use the high and low tables to identify the extremes, and then use quartiles to understand the middle of the distribution. Pairing this series with overall adult account ownership and digital-payment indicators can then show whether lower-income adults face a distinct financial-inclusion gap.
Frequently Asked Questions
What does a 70% account-ownership rate for the poorest 40% mean?
It means about 70% of people ages 15+ in the bottom 40% of that economy’s income distribution report a qualifying financial-institution account or personal use of a mobile-money service.
Which reporting economies have the highest and lowest 2024 values?
Among the 138 numeric observations, the United Kingdom, Finland and Iceland are at 100%, while Pakistan is lowest at 13.61%.
Were the 79 missing 2024 observations treated as zero?
No. Source-missing rows remain missing and are excluded from the map, rankings and summary statistics.
Related Articles
Green Map creates custom-edited map images using open geographic data sources such as geoBoundaries, Natural Earth, OpenStreetMap, and government open data.
These maps are edited visual materials, not raw data files, and are provided for education, documents, presentations, and graphic reference.