World Bank indicator FX.OWN.TOTL.OL.ZS measures account ownership among people ages 25 and older. It counts respondents who report having an account, alone or jointly, at a bank or another financial institution, or who report personally using a mobile-money service during the past 12 months. In the 2024 file, 139 of 217 country-and-area rows have numeric observations and 78 are source-missing.
Across the 139 reported observations, values range from 14.23% to 100.00%. A rate of 80% means that about four in five people ages 25+ meet the indicator’s account-ownership definition. It does not describe the entire adult population if the comparison series includes ages 15–24.
That age threshold matters because younger adults can have different patterns of financial access. The indicator is therefore useful for focusing on established adult age groups, but it should not be mixed casually with the more familiar 15+ account-ownership series. It also measures access rather than balances, savings, borrowing, transaction frequency or account activity.
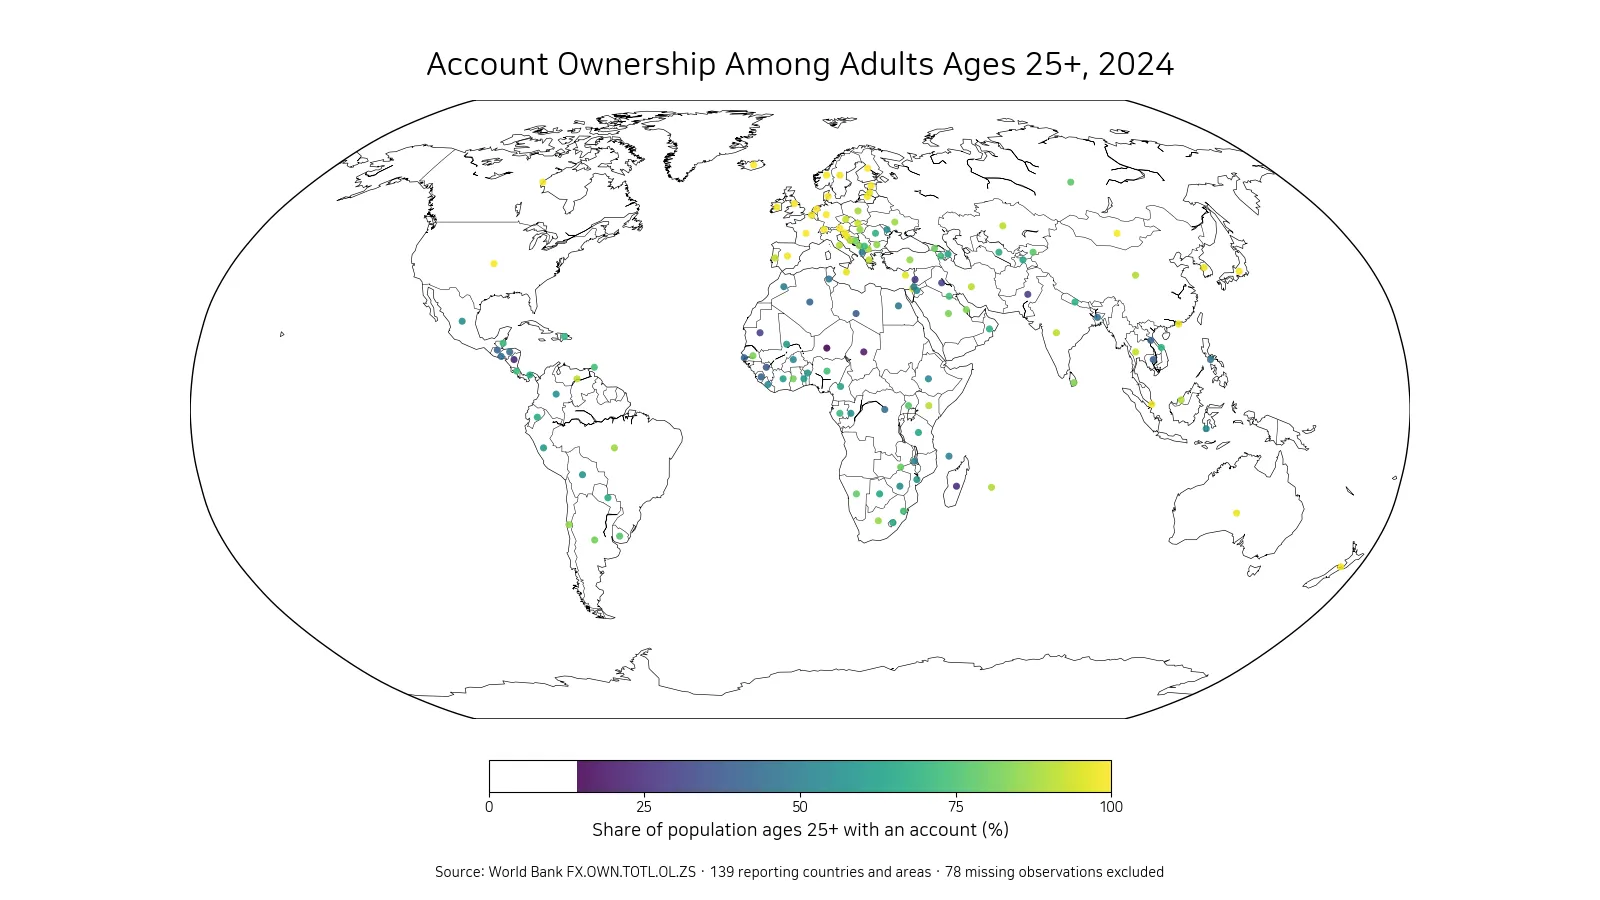
Table of Contents
The highest rates are essentially universal
Finland records the highest reported value at 100.00%. Iceland follows at 99.83%, Austria at 99.44%, Germany at 99.29%, Norway at 99.19%, and the United Kingdom at 99.18%. France, the Netherlands and Estonia are also above 99%, while Mongolia reaches 98.89%.
| Rank | Country or area | Account ownership ages 25+ |
|---|---|---|
| 1 | Finland | 100.00% |
| 2 | Iceland | 99.83% |
| 3 | Austria | 99.44% |
| 4 | Germany | 99.29% |
| 5 | Norway | 99.19% |
| 6 | United Kingdom | 99.18% |
| 7 | France | 99.09% |
| 8 | Netherlands | 99.03% |
| 9 | Estonia | 98.98% |
| 10 | Mongolia | 98.89% |
Rates near 100% are best interpreted as near-universal access within the survey and estimation framework. They should not be expanded into a literal claim that every individual has identical access under every circumstance. Sampling, rounding and the exact account definition still matter.
The upper group contains many European economies, but it is not exclusively European. Mongolia also appears among the top 10. High coverage can be supported by bank infrastructure, digital payments, identification systems, payroll or pension payment arrangements and mobile services, although this indicator alone cannot isolate the dominant cause.
At the low end, rates fall into the teens and twenties
Niger has the lowest reported 2024 value at 14.23%. Chad is at 21.00%, Nicaragua at 21.82%, Madagascar at 23.92%, Lebanon at 27.98%, and Pakistan at 28.54%. Iraq and Mauritania are close to 30%, followed by Guinea and Libya.
| Rank | Country or area | Account ownership ages 25+ |
|---|---|---|
| 1 | Niger | 14.23% |
| 2 | Chad | 21.00% |
| 3 | Nicaragua | 21.82% |
| 4 | Madagascar | 23.92% |
| 5 | Lebanon | 27.98% |
| 6 | Pakistan | 28.54% |
| 7 | Iraq | 30.24% |
| 8 | Mauritania | 30.56% |
| 9 | Guinea | 37.17% |
| 10 | Libya | 38.13% |
Low ownership can be consistent with barriers involving distance, identification requirements, fees, irregular income, cash-based transactions, digital connectivity or trust in financial institutions. The indicator identifies where access is limited, but it does not identify which barrier is most important in a particular country.
The gap between the maximum and minimum is about 85.77 percentage points. Basic financial access among older adults therefore remains highly uneven across reporting economies.
The median is 75.97%, but the middle 50% spans a wide range
The median across the 139 numeric observations is 75.97%, while the simple mean is 72.56%. The first quartile is 55.37% and the third quartile is 91.17%, so half of reporting economies fall between roughly 55.37% and 91.17%.
By broad bands, 4 observations are below 25%, 22 are from 25% to under 50%, 43 are from 50% to under 75%, and 70 are 75% or higher. The 75%+ group is the largest, but a substantial number of economies remain below 50%.
The mean sits below the median because the lower tail extends much farther downward than the upper tail can extend upward beyond the 100% ceiling. Quartiles therefore provide a useful picture of how uneven financial access remains even when many economies are already near universal coverage.
The map shows broad regional clusters but substantial exceptions
High rates appear across much of Europe and in several other advanced or highly connected financial systems. Lower values are visible across parts of West and Central Africa, South Asia, the Middle East and Latin America. These geographic patterns are descriptive rather than causal.
Mobile money can change the geography of access because people may enter the formal financial system without using a conventional bank branch. In other places, identification, cost, distance or trust may remain significant barriers even where financial institutions are present. The map shows where outcomes differ, not which mechanism produced each outcome.
Representative points keep small countries and territories visible at world scale. A marker is not a branch location or a mobile-money agent. It represents one country-or-area percentage for the 2024 indicator.
The ages-25+ indicator should not be confused with the broader ages-15+ series
Many financial-inclusion statistics use people ages 15 and older as the standard adult population. FX.OWN.TOTL.OL.ZS instead focuses on ages 25+. That excludes younger adults, whose account ownership may differ because of education, employment status, income or household circumstances.
If younger adults have lower ownership, the 25+ rate can be higher than the all-adult 15+ rate. If age gaps are small, the two series may be close. A precise age comparison requires matching indicators for the same year rather than inferring the difference from this series alone.
The age definition is therefore not a minor label. It is part of the denominator and can change both the level of the indicator and a country’s position relative to others.
Owning an account is not the same as using it actively
Account ownership establishes a basic connection to formal or mobile financial services, but it does not reveal how the account is used. Receiving wages or pensions, saving, paying bills, transferring money, borrowing formally or making digital purchases are separate behaviors.
An account may have been opened for a government transfer or payroll payment and then used infrequently. Conversely, a person without a traditional bank account may be financially active through mobile money and still meet the definition used here.
A fuller financial-inclusion analysis can therefore add indicators for digital payments, formal saving, formal borrowing, dormant accounts and gaps by sex, income or age. Those measures distinguish basic access from the depth of financial participation.
Seventy-eight missing observations remain missing
The full file contains 217 country-and-area rows, but only 139 have numeric 2024 observations. The remaining 78 rows are source-missing. They are excluded from the map, rankings and summary statistics rather than being converted to 0%.
Missing data are fundamentally different from a genuinely low value such as Niger’s 14.23%. A numeric low rate belongs in the ranking; a missing row means the 2024 observation is unavailable. Because the missing share is substantial, the result should be described as a comparison of 139 reporting economies rather than a complete census of every country.
This distinction also protects the map from false extremes. Treating missing values as zero would make unobserved economies look like places with no account ownership at all, which the source does not support.
High account ownership does not by itself measure financial security
Near-universal account access is an important foundation for financial inclusion, but it does not directly measure income, wealth, debt burdens or the ability to absorb financial shocks. A country can have very high account ownership and still face household financial stress or unequal access to credit.
Likewise, lower account ownership does not describe all financial activity. Informal saving, cash transactions, rotating savings groups and other arrangements may play important roles outside the formal-account definition. The indicator is therefore best used as a measure of basic formal or mobile access.
What matters most in the 2024 comparison
Three points stand out. First, account ownership among adults ages 25+ ranges from 14.23% to 100%. Second, the median is 75.97%, while half of reporting economies lie between about 55.37% and 91.17%. Third, 78 country-or-area rows have no 2024 observation and must not be interpreted as zero.
A useful reading sequence is to start with the map for geographic patterns, use the high and low tables for the extremes, and then use quartiles to understand the middle of the distribution. Comparing this series with overall adult ownership, bottom-40% ownership and digital-payment use can then reveal whether age and income groups experience different levels of financial inclusion.
Frequently Asked Questions
What does an 80% account-ownership rate among adults ages 25+ mean?
It means about 80% of people ages 25 and older report a qualifying financial-institution account or personal use of a mobile-money service under the World Bank definition.
Which reporting economies have the highest and lowest 2024 values?
Among the 139 numeric observations, Finland is highest at 100% and Niger is lowest at 14.23%.
Were the 78 missing 2024 observations treated as zero?
No. Source-missing rows remain missing and are excluded from the map, rankings and summary statistics.
Related Articles
Green Map creates custom-edited map images using open geographic data sources such as geoBoundaries, Natural Earth, OpenStreetMap, and government open data.
These maps are edited visual materials, not raw data files, and are provided for education, documents, presentations, and graphic reference.