Anne Arundel County stretches across central Maryland to the western shore of Chesapeake Bay, combining the Glen Burnie and Pasadena area in the north, Severn and Odenton farther west, and Annapolis on the southeastern waterfront. Roads alone do not explain the county very well because rivers and tidal inlets repeatedly divide the eastern side into peninsulas. This page follows the communities, highways, rivers, shoreline, and elevation visible in the supplied maps, and the same map themes are available as high-resolution JPG files in a downloadable ZIP archive.
Anne Arundel County Government describes the county as centrally located in Maryland and home to the state capital of Annapolis. The City of Annapolis also identifies itself as both Maryland’s capital and the county seat. On the map, that administrative center lies close to Chesapeake Bay in the southeast, while Glen Burnie and Pasadena occupy a much more Baltimore-oriented northern section. Fort Meade, Maryland City, Severn, and Odenton form another set of landmarks on the inland western side.
Table of Contents
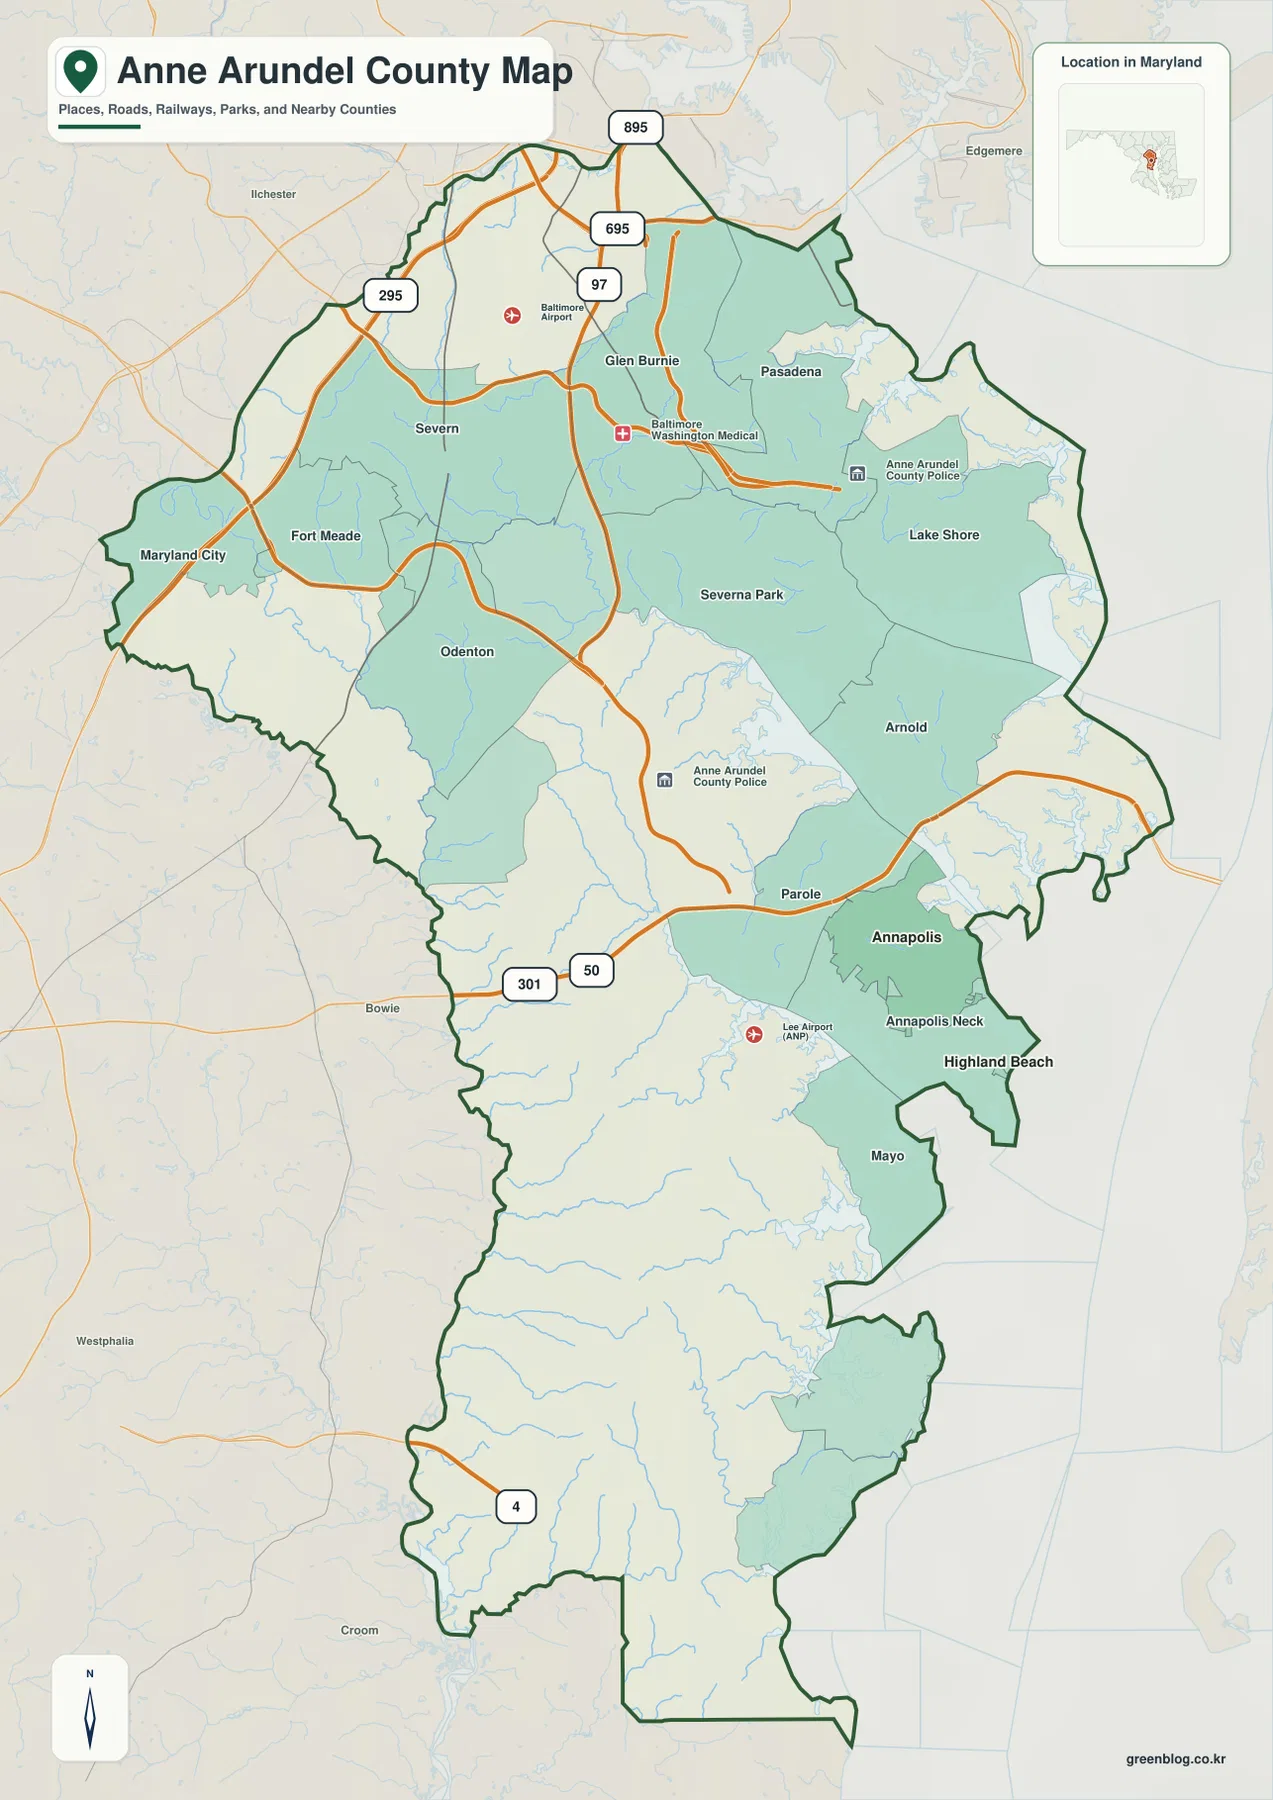
I-97 provides the clearest road line from Glen Burnie toward Annapolis
I-97 is the easiest highway to use when first reading the county map. It begins near the Glen Burnie side of the county and runs south through the central area toward Annapolis. At the northern end, I-695, I-895, and MD 295 connect the county with the Baltimore transportation network. BWI Airport is also marked near the northern boundary, helping explain why Glen Burnie, Severn, and the surrounding communities sit in a dense network of major roads.
Pasadena lies east of Glen Burnie, while Severna Park and Arnold appear farther south near the Magothy and Severn river systems. Travel in this part of the county is shaped by water as much as by distance. Peninsulas and river mouths interrupt direct east-west movement, so nearby communities may depend on a limited number of bridges and major roads rather than a simple street grid.
The western side has a different character. Severn, Fort Meade, Odenton, and Maryland City are farther from Chesapeake Bay and sit closer to MD 295 and the inland transportation corridor. The county outline is also less fragmented here. Moving from Odenton toward Annapolis, the road network becomes increasingly tied to U.S. 50/301, I-97, and the river crossings that define the southeastern half of the county.
Near Annapolis, U.S. 50 and U.S. 301 cross the county from west to east, with Parole near the major highway junction west of the city. Annapolis, Annapolis Neck, and Highland Beach cluster around the lower Severn River and Chesapeake Bay side. Compared with the interstate-heavy northern section, this southeastern area has a much more indented shoreline and a road pattern that bends around creeks, coves, and river mouths.
U.S. 50/301 separates the Annapolis area from the long southern peninsula
U.S. 50 and U.S. 301 form a strong east-west reference immediately north of Annapolis. They make Parole and the approach to Annapolis easy to locate, then continue toward the Chesapeake Bay crossing. Westward, the same corridor leads toward Prince George’s County. On the county map, this highway pair is the simplest dividing line between the more urbanized central-northern section and the long southern half.
South of Annapolis, the map extends through Mayo and a series of broad peninsulas with fewer large place labels. MD 4 runs through the southwestern portion toward Calvert County. Instead of a dense interstate network, the lower county is visually dominated by branching local roads, streams, and shoreline. That change is important because Anne Arundel County includes both Baltimore-Washington suburban corridors and much less urbanized Chesapeake-side landscapes.
Lake Shore appears along the eastern side, while Severna Park and Arnold sit between major tidal river systems farther south. Straight-line proximity can be misleading here: a narrow creek or river mouth may require a longer road connection around the water. Inland places such as Odenton and Severn are less constrained by the shoreline, so their geographic relationships are easier to understand from the highway network than from the coast.
This map is a geographic overview rather than a live navigation product. Conditions on I-97, I-695, U.S. 50, and local bridges can change with traffic, maintenance, or incidents. Current Maryland transportation information and a navigation service should be used for an actual trip. The map is most useful for identifying the broad relationship between communities, county boundaries, highways, and the bay-facing shoreline.
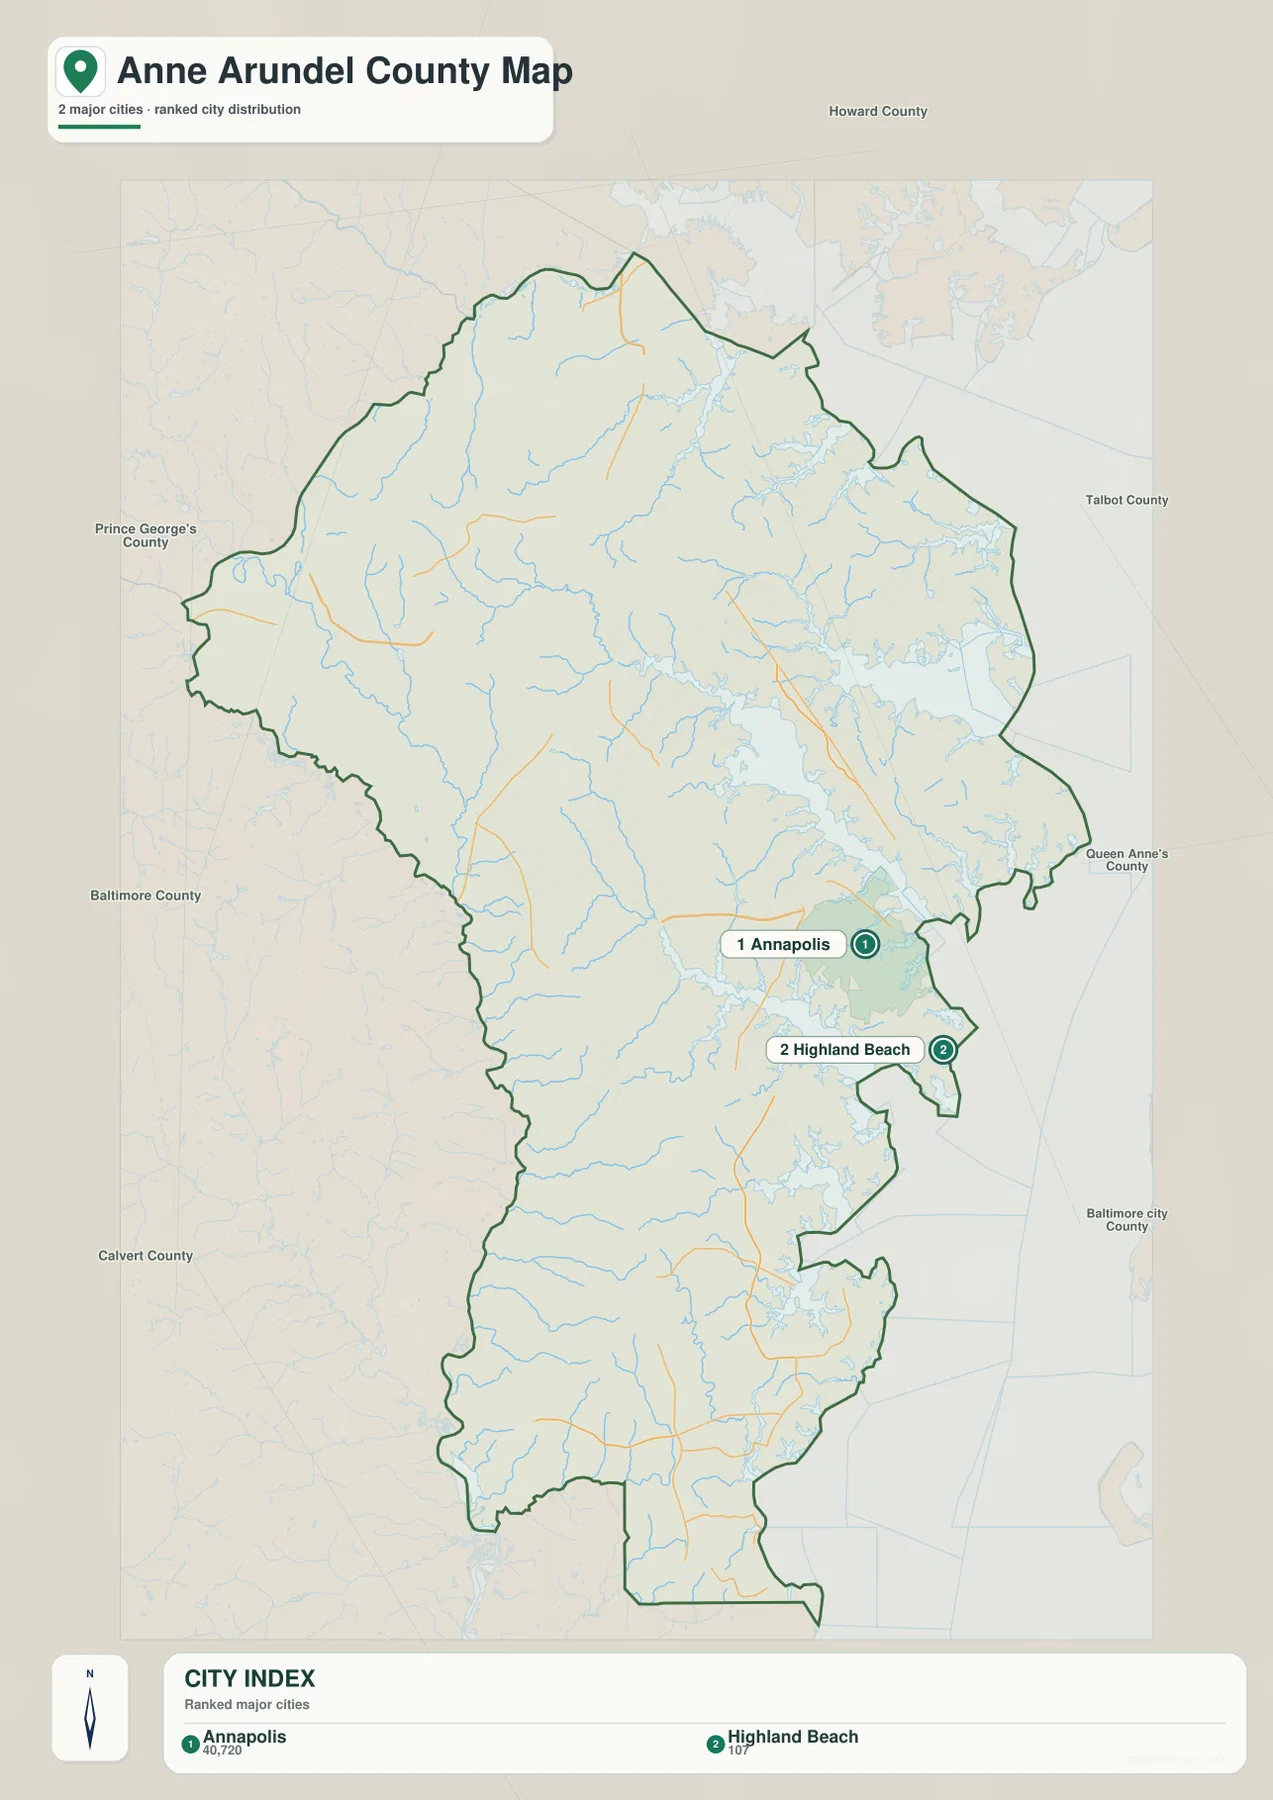
The City Index ranks Annapolis and Highland Beach but leaves out many large communities
The City Index marks only two ranked cities. Annapolis appears first with the printed value 40,720, while Highland Beach appears second with 107. The graphic does not state a reference year or statistical definition for those figures, so they should not be treated as current population counts. Readers who need present-day demographic numbers should use the latest U.S. Census Bureau data instead.
The simplified view is more useful for location than for statistics. Annapolis is positioned near the mouth of the Severn River, and Highland Beach appears farther south on a small Chesapeake-facing projection. With roads and most community names removed, the image makes the southeastern concentration of the ranked cities especially clear.
Glen Burnie, Pasadena, Odenton, Severn, and other prominent labels from the general map are absent from the ranking. That does not imply that they are minor communities. The City Index is a specific city layer with its own classification, not a complete settlement or population map. It works best as a companion to the general map when a presentation needs a clean view of the two ranked municipalities.
No mileage line is drawn between Annapolis and Highland Beach, and the graphic does not claim to provide driving distance. The shoreline and road system matter too much for a simple visual estimate to be reliable. Use a routing tool when actual mileage or travel time is the question, and use this map when the goal is simply to compare the locations of the two ranked cities.
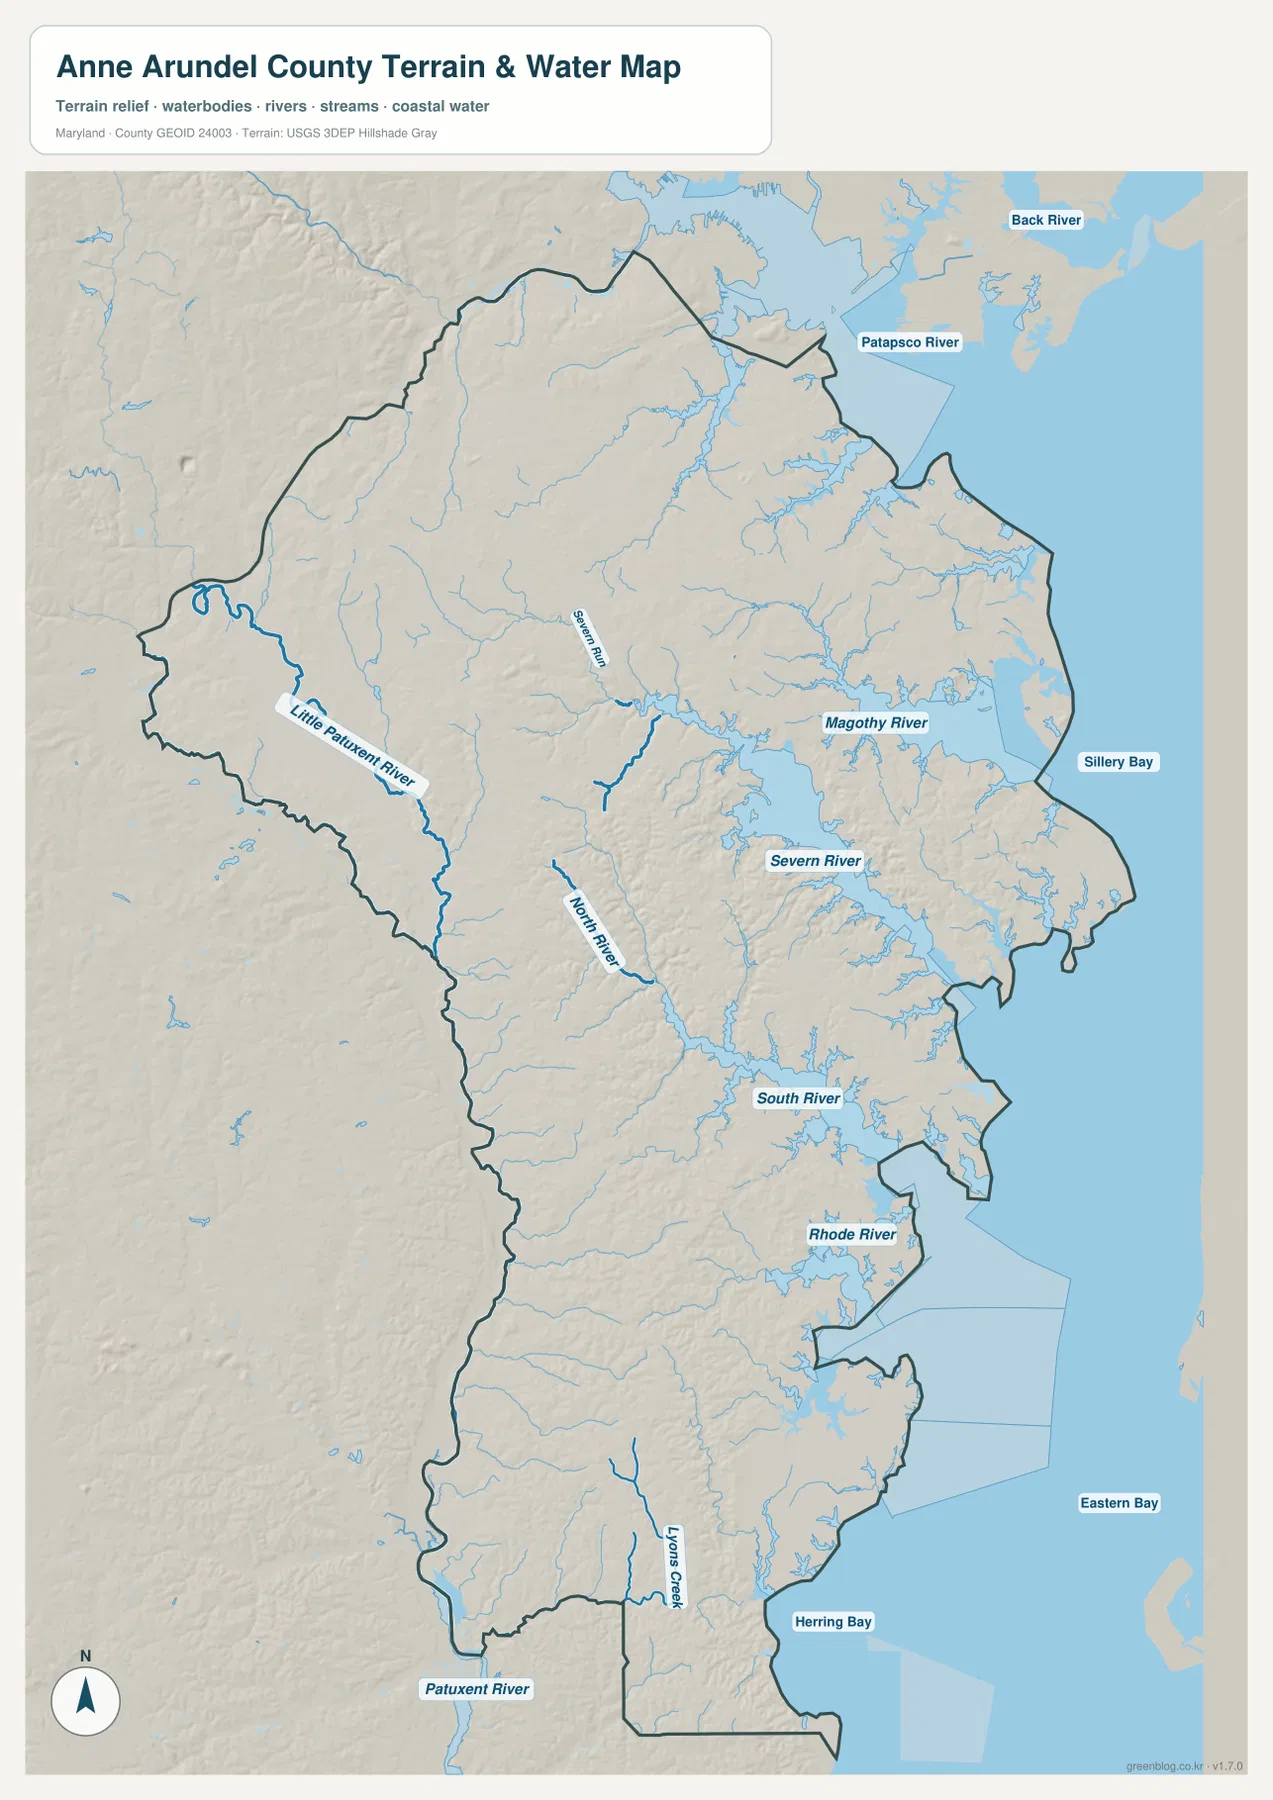
The Magothy, Severn, and South rivers carve the eastern shore into separate peninsulas
The terrain-water map explains the county’s eastern outline better than the road map alone. The Patapsco River appears near the northern side, followed southward by the Magothy River and then the Severn River. Annapolis sits close to the Severn’s mouth on Chesapeake Bay. Because these tidal rivers reach deeply inland at short intervals, northeastern Anne Arundel County is divided into a series of peninsulas rather than one continuous strip of land.
South of the Severn, the South River forms another broad estuary, and the Rhode River enters the bay farther down the coast. These waterways shape the Annapolis, Arnold, Mayo, and southern shore area. A road that looks short on a county-scale map may have to travel around a creek or cross at one of a limited number of bridges, which is why the water layer is useful for understanding the transportation layer.
The western and southwestern side has its own drainage. The Little Patuxent River is labeled near the west, while the Patuxent River appears along the lower boundary. North River and Lyons Creek are among the named waterways in the southern interior. These features show that the lower county is not empty space between Annapolis and Calvert County; it is broken into many smaller valleys and stream systems.
Sillery Bay, Herring Bay, and Eastern Bay are labeled on the Chesapeake side of the map. They place the county’s rivers in a larger estuarine setting rather than treating them as isolated inland streams. This image is not a nautical chart, however. It does not provide depth, tides, navigation channels, or real-time water conditions, so boating and coastal safety decisions require current NOAA and other authoritative marine information.
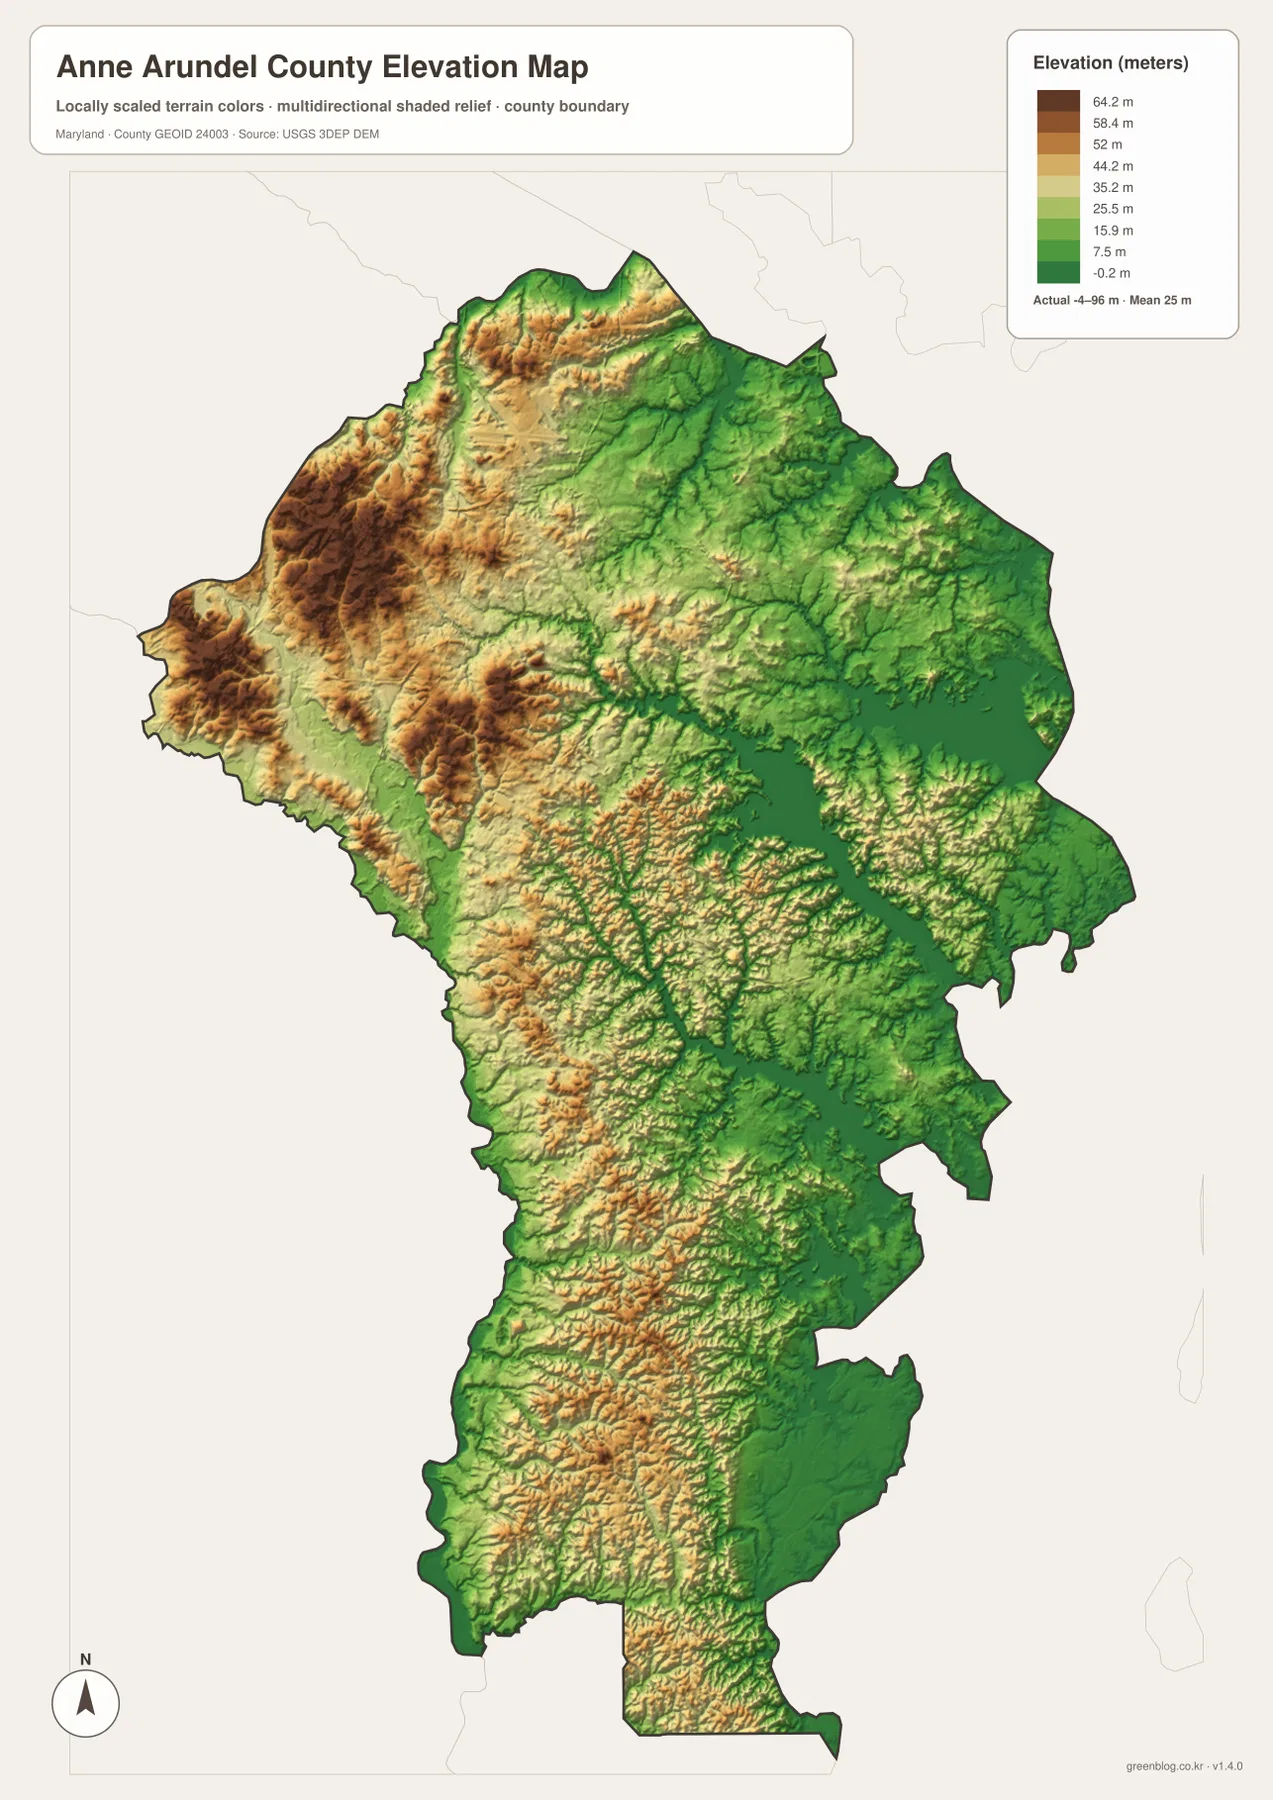
Higher western ground falls toward low Chesapeake Bay shorelines
The elevation map reports an actual county range of about -4 to 96 meters and a mean elevation of 25 meters. Colors are locally scaled to make differences within the county easier to see. The highest terrain is concentrated more often in the west and northwest, while the Annapolis and Chesapeake Bay sides are dominated by lower green tones. The same river valleys visible on the water map also appear as low branching corridors in the shaded relief.
Fort Meade and Maryland City lie closer to the higher western terrain than communities directly along the bay. Ridges are especially visible near the northwestern and western boundaries, with narrow valleys cutting between them. Moving from Odenton toward Annapolis, the terrain generally drops and the influence of tidal rivers becomes stronger.
The central part of Anne Arundel County is not mountainous, but it is also not perfectly flat. Small tributaries have cut many shallow valleys into the landscape, particularly where streams feed the Severn and South river systems. Those subtle changes are difficult to notice on the road map yet stand out clearly when shaded relief is added.
The legend is designed to emphasize local relief, so color alone should not be converted into a precise elevation measurement. Surveying, construction, drainage design, and engineering work require source elevation data such as the USGS 3D Elevation Program. This map is best used for the broad contrast between higher western ground and lower tidal shorelines.
Road, water, and elevation views answer different questions about the county
For Glen Burnie, Severn, Odenton, and the Baltimore-Washington transportation network, the general county map is the strongest starting point because I-97, MD 295, I-695, and the airport area are visible together. For Annapolis, Arnold, Severna Park, or Mayo, the water map adds essential context by showing the Severn, Magothy, South, and Rhode river systems that shape local roads and shorelines.
The lower county around Mayo and MD 4 is easier to understand when the road and water layers are compared, since fewer large urban labels are available as landmarks. The elevation map is most helpful when the question shifts from transportation to landform: it shows why the western interior sits higher and why the Chesapeake-facing sections are generally low.
The download ZIP contains high-resolution JPG versions of the county-road map, City Index, terrain-water map, and elevation map. Each original is 2572 × 3638 pixels, which works well for full-page documents, classroom material, presentations, and closer inspection of a particular area. Specialized navigation, surveying, flood, or engineering decisions should still rely on current authoritative source data.
Frequently Asked Questions
Which road is the easiest reference between Glen Burnie and Annapolis?
I-97 is the clearest county-scale reference between the Glen Burnie area and Annapolis. At the northern end it connects into the I-695, I-895, and MD 295 network, while U.S. 50/301 becomes the major east-west reference near Annapolis. Use current navigation for actual mileage, traffic, and travel time.
Are the Annapolis 40,720 and Highland Beach 107 values current populations?
They should not be treated as current counts because the supplied City Index does not state a reference year or statistical definition. This article treats them only as values printed on the graphic. Current population data should be taken from the latest U.S. Census Bureau sources.
What does the -4 to 96 meter elevation range mean for Anne Arundel County?
The elevation map lists an actual range of about -4 to 96 meters and a mean of 25 meters. Higher terrain is more common in the west and northwest, while the Chesapeake Bay shoreline and tidal river areas are generally lower. Precise site elevation and slope should be checked with USGS source data rather than estimated from map colors.
Map File Information
The ZIP archive contains high-resolution JPG maps of Anne Arundel County matching the map themes described on this page.
- Included Files: county and major roads map, City Index map, terrain and water map, elevation map
- Printable Size: 2572 × 3638 pixels each
- File Type: JPG
Related Maps
Sources and References
- Anne Arundel County Government – About Anne Arundel County
- City of Annapolis – Our City
- U.S. Census Bureau – TIGER/Line Shapefiles
- USGS – National Hydrography
- USGS – 3D Elevation Program
Green Map creates custom-edited map images using open geographic data sources such as geoBoundaries, Natural Earth, OpenStreetMap, and government open data. These maps are edited visual materials, not raw data files, and are provided for education, documents, presentations, and graphic reference.