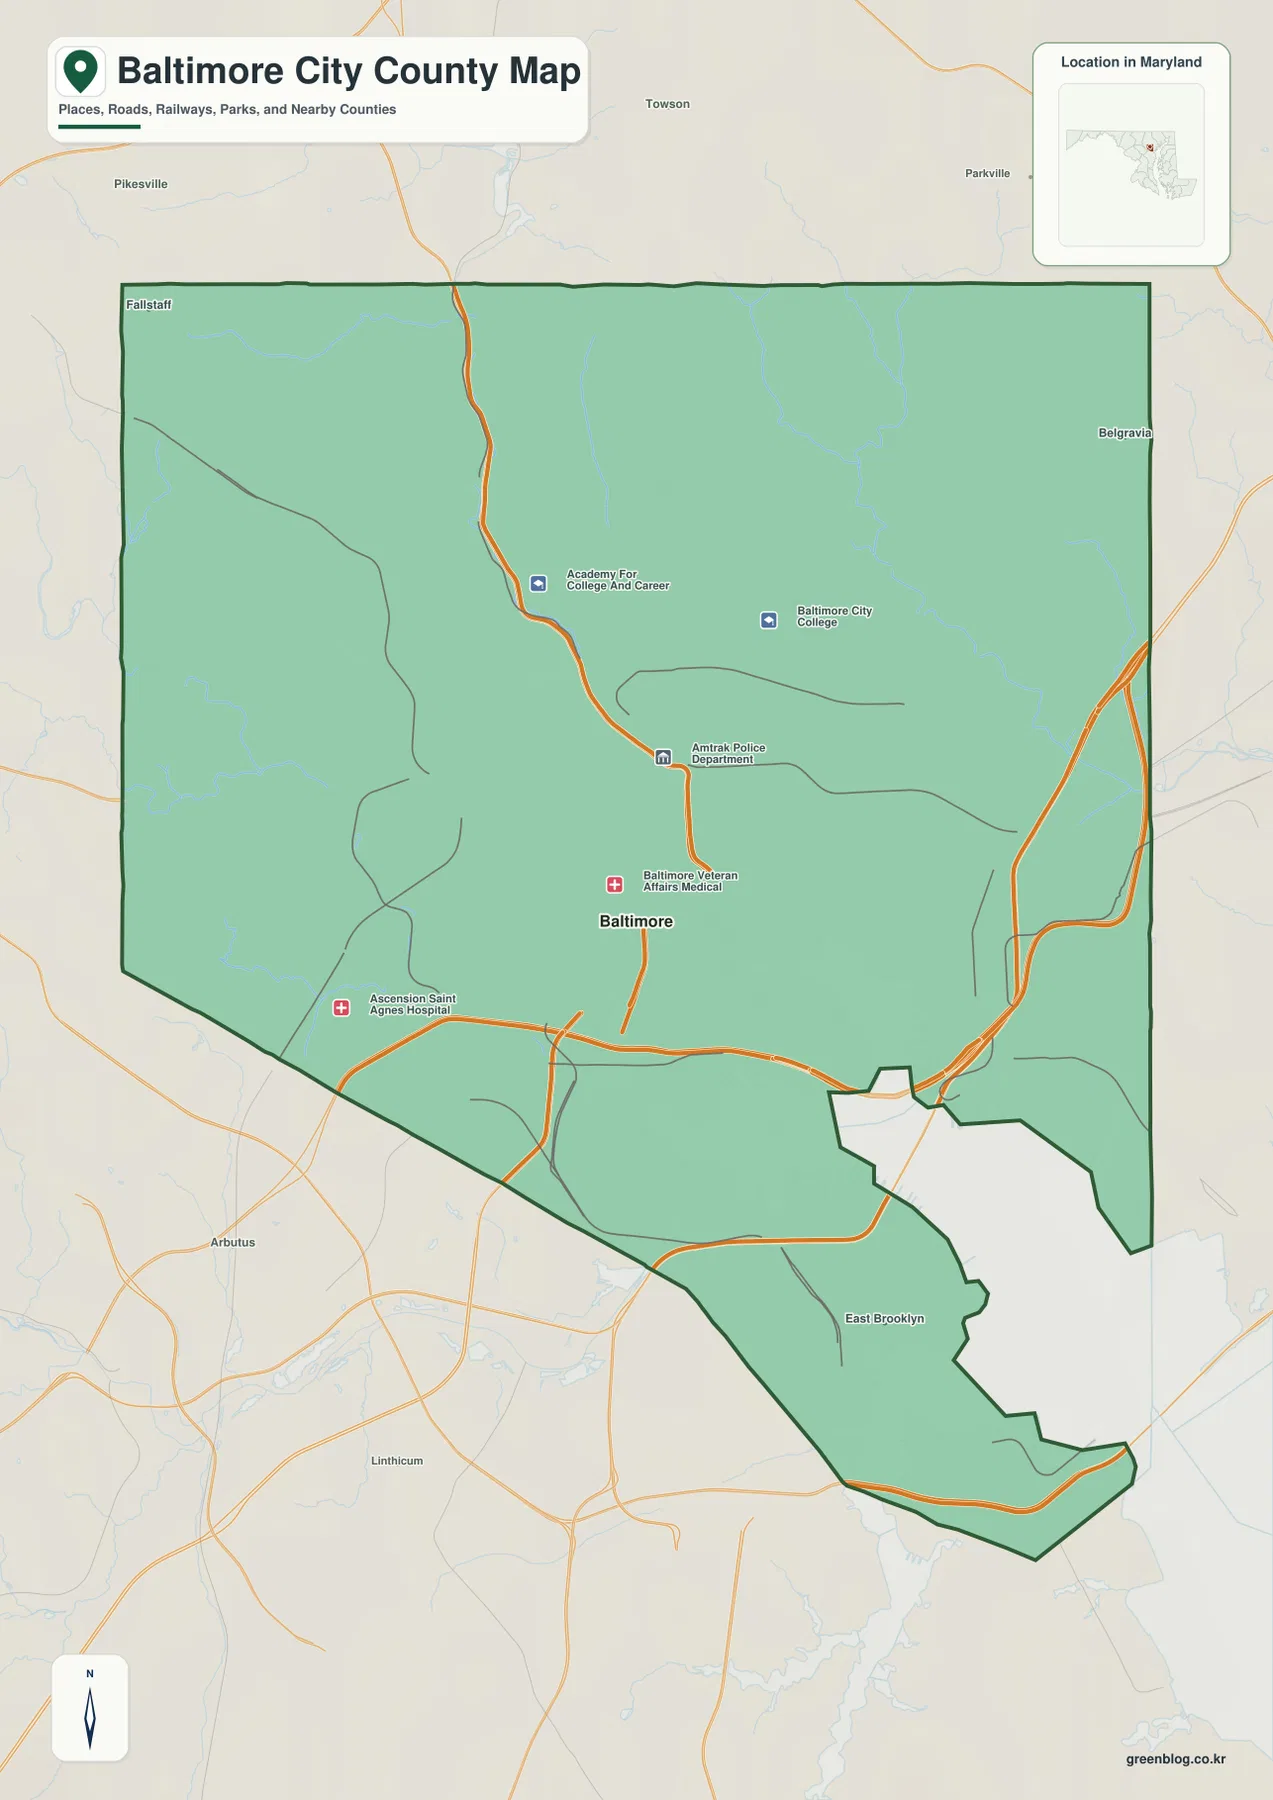
Baltimore City needs one important clarification before the map is read like an ordinary Maryland county. The city is an independent jurisdiction rather than part of Baltimore County, and official Baltimore material notes that it separated from the county in 1851. The boundary map makes that distinction visible, especially where the city stretches south toward the Patapsco River and harbor. This page compares the boundary and road view, the simplified City Index, the terrain-water map, and the elevation map, and the matching high-resolution JPG files can be downloaded together in a ZIP archive.
The city’s northern outline is comparatively simple, but the southern and southeastern sections become much more irregular around the harbor and tidal water. Baltimore is marked near the center, with several institutions and surrounding places providing additional orientation. Because this is a dense urban area, the general map cannot label every local street at preview size. It works best as a citywide reference, while the downloadable full-resolution files make smaller features easier to inspect.
Table of Contents
The independent-city boundary separates Baltimore from the surrounding county
Baltimore City is treated as a county equivalent by the U.S. Census Bureau, which is why it appears as its own jurisdiction in a county-map collection. Most of the land boundary is surrounded by Baltimore County, while Anne Arundel County lies close to the southwestern and southern side. The central Baltimore marker identifies the city itself, but the dark outline is the more important feature because it shows where the independent jurisdiction ends.
The northern and western sides are relatively easy to follow, while the southeastern edge changes shape around harbor water and narrow extensions of land. Nearby labels outside the outline help show that the city does not simply occupy a rectangular block inside Baltimore County. The irregular southern geometry becomes even easier to understand when the water map is viewed alongside the boundary map.
Several major transportation corridors cross Baltimore. I-83 enters from the north toward the central city, while I-95 is a key east-west and north-south regional route through the southern side; I-895 also serves the harbor area. The supplied map is not a live traffic product, so construction, closures, congestion, and current routing should be checked with Maryland transportation sources or a navigation service. Here, the roads are most useful for citywide orientation.
The map is also not intended to replace a neighborhood or tourist map. Its strength is the combination of administrative outline, broad road direction, nearby jurisdictions, and the harbor extension. In a classroom or presentation, it is particularly useful for explaining that Baltimore City and Baltimore County are separate jurisdictions despite their shared name.
The City Index simplifies the map to one ranked city rather than multiple municipalities
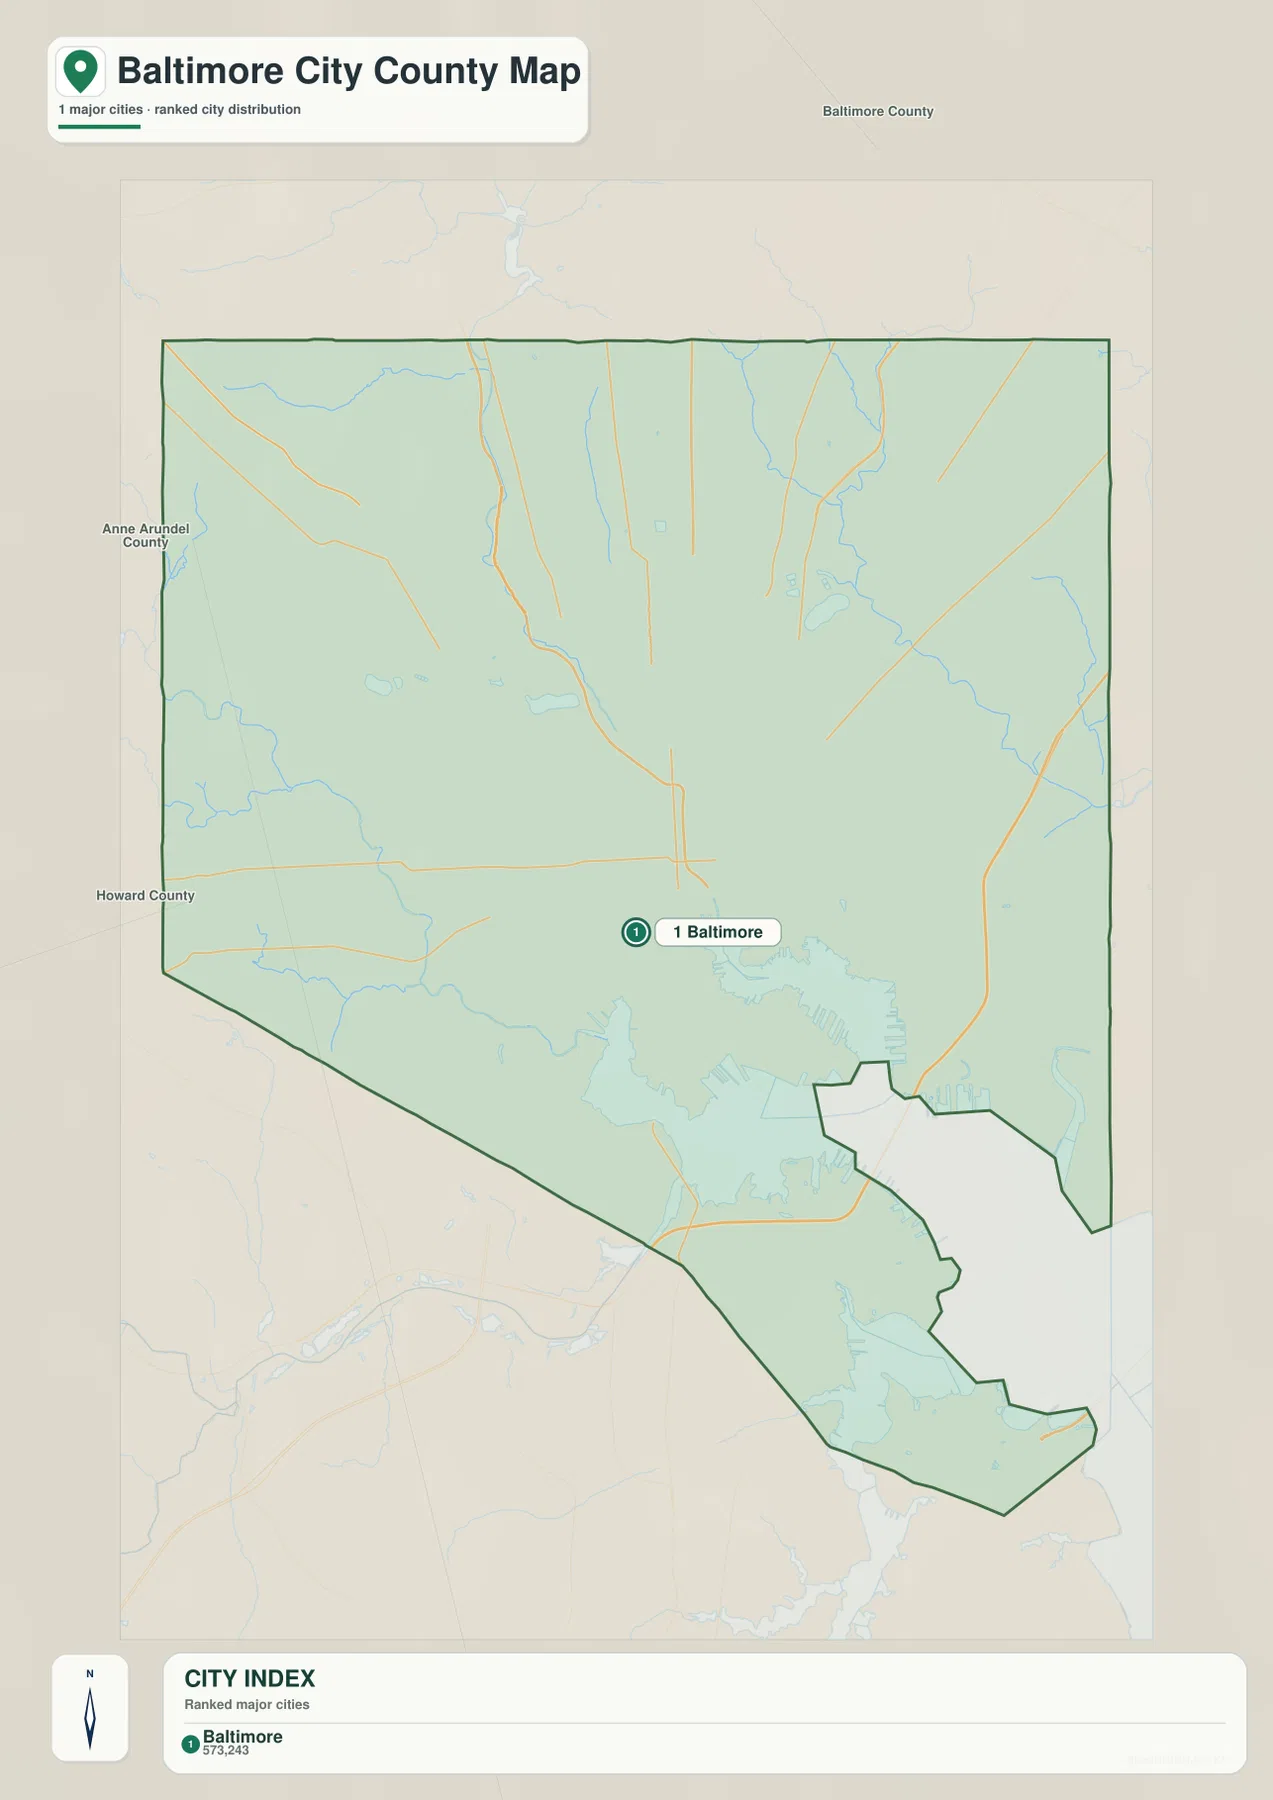
The City Index contains a single ranked location: Baltimore. The index prints the figure 573,243 beside the city, but the graphic does not state a reference year or statistical definition. For that reason, the number should not be presented as a current population count. When current population information is needed, the latest U.S. Census Bureau figures are the appropriate source.
A one-city index makes sense for an independent city page. Unlike a county that contains several incorporated cities, the subject here is Baltimore City itself. The graphic is therefore closer to a simplified locator map than a ranking of separate municipalities. It should not be interpreted as a neighborhood population chart or as evidence that the city has only one important community area.
Removing most labels makes the overall shape easy to see. The main body of the city occupies the north and center, while narrower sections continue south and southeast around the harbor. Baltimore County, Howard County, and Anne Arundel County labels outside the outline help place the city within central Maryland without cluttering the image with local streets.
No connector lines or distance labels appear on this City Index. It therefore does not provide direct mileage from central Baltimore to the harbor, the northern boundary, or neighboring jurisdictions. For route distance, use a current mapping service; for a clean explanation of Baltimore City’s position and outline, this simplified view is more effective.
Jones Falls, Gwynns Falls, and Herring Run reveal the streams beneath the urban map
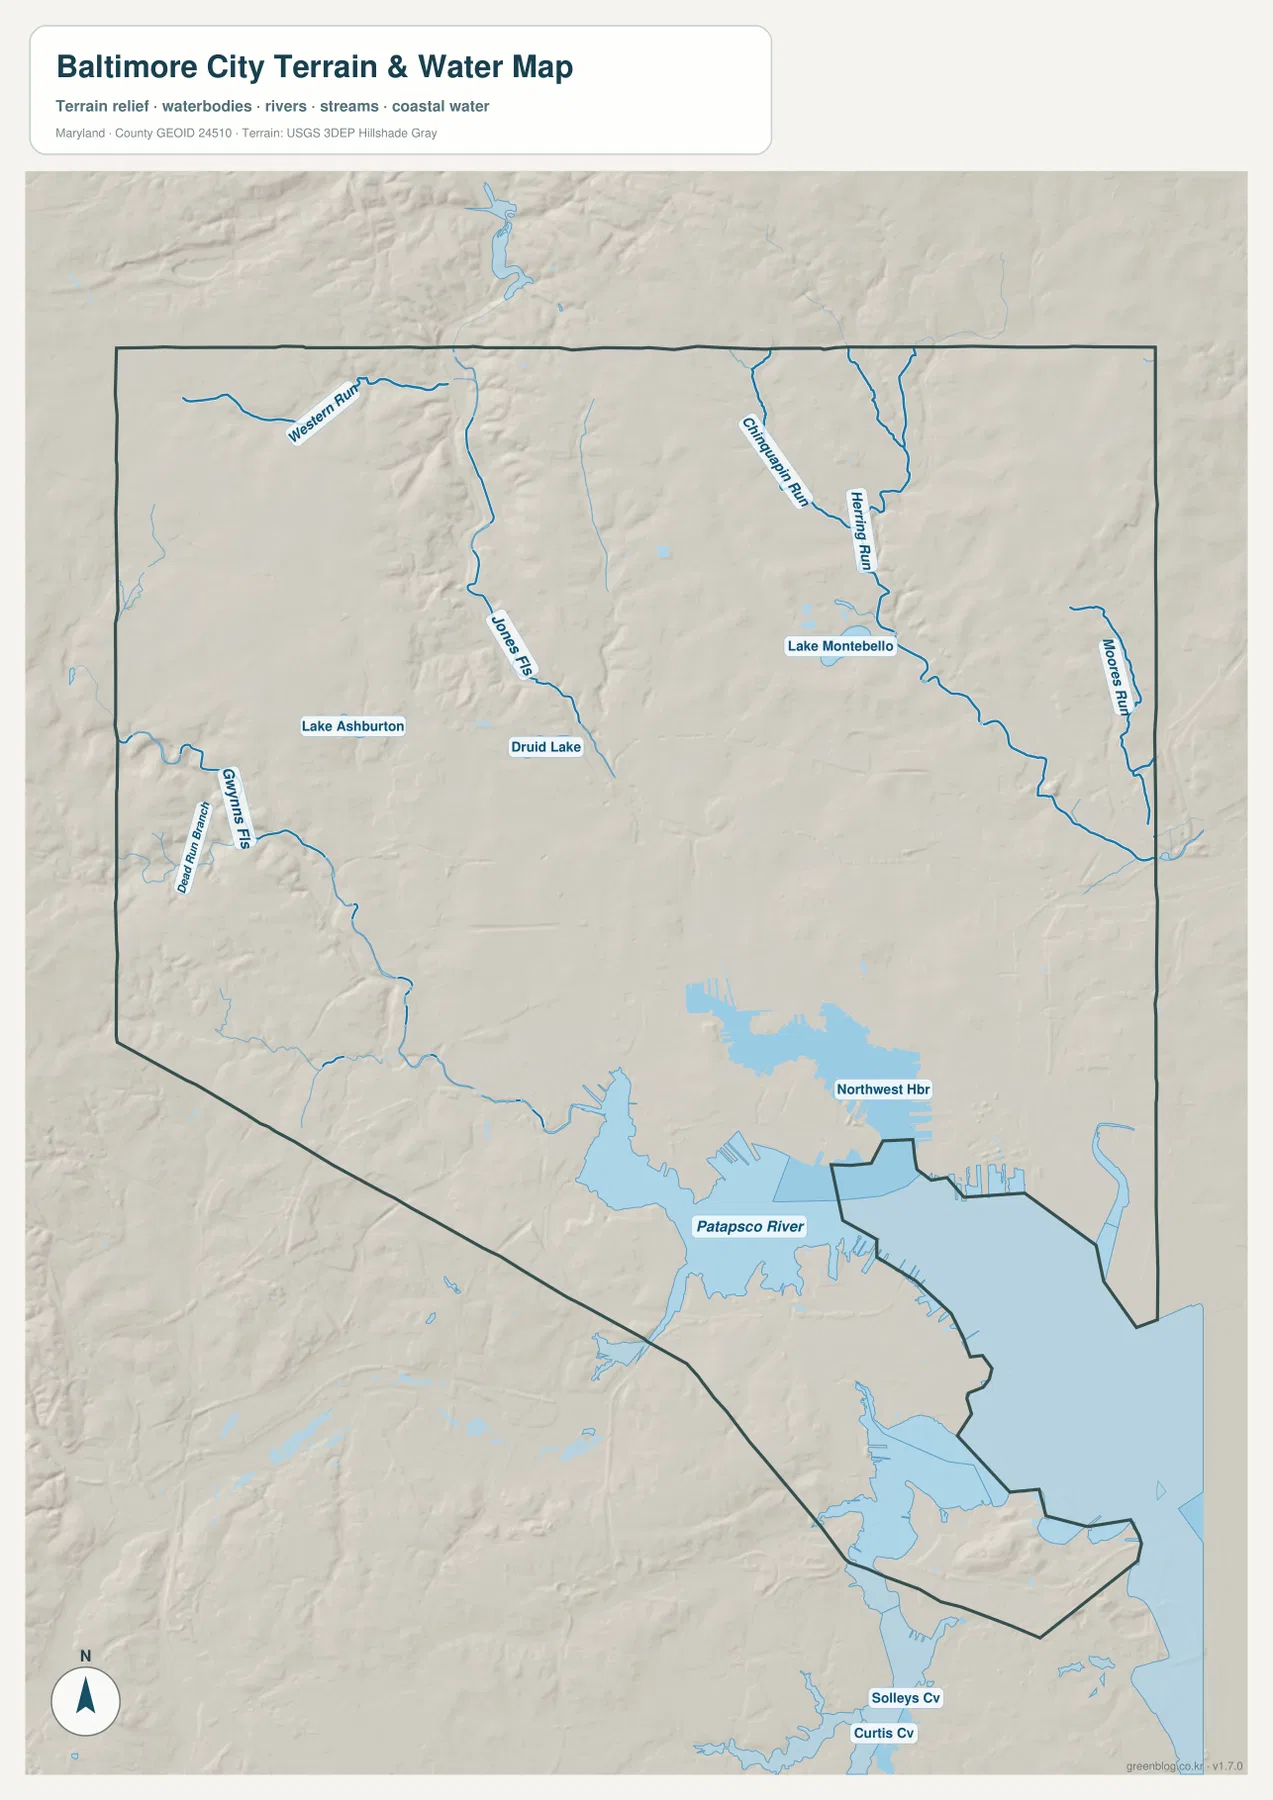
The terrain-water map makes Baltimore’s stream network much easier to see than the road map. Western Run appears in the northwest, and Jones Falls descends through the west-central part of the city. Druid Lake is labeled nearby, providing a strong landmark for the northwestern interior. In a dense city these waterways can be visually overshadowed by streets and buildings, but the water layer shows how strongly the valleys continue to organize the landscape.
Gwynns Falls is the dominant western stream on the map, with Dead Run and smaller tributaries nearby. Lake Ashburton is another useful landmark in the northwest. Following Gwynns Falls southward brings the viewer toward the Patapsco River side of the city, making it a useful feature for understanding the broad transition from higher western land to the low southern waterfront.
The northeastern side contains a separate group of streams. Chinquapin Run and Herring Run are labeled north and east of the center, while Moores Run lies farther east. Lake Montebello sits near this network and helps orient the northeastern part of Baltimore. Instead of one large river crossing the whole city, multiple smaller watersheds descend from different upland areas toward the lower southern and southeastern terrain.
At the southern edge, the map changes scale. The Patapsco River and Northwest Harbor become the dominant water bodies, with piers and engineered shoreline adding detail around the harbor. Solleys Cove and Curtis Cove are labeled farther south. This is a very different water environment from the narrow northern streams, yet the two are connected parts of the same city landscape.
The harbor completes a north-to-south water story across Baltimore
Baltimore’s small northern streams generally occupy lower corridors between higher ground and continue toward the city’s southern water. Jones Falls and Gwynns Falls provide the clearest examples, while Herring Run and Moores Run organize the northeastern side. Comparing the water and elevation maps makes these relationships more visible because the stream corridors frequently align with lower terrain.
Druid Lake, Lake Ashburton, and Lake Montebello are useful urban water landmarks as well. Their presence on the map should not be interpreted as a statement about current drinking-water status or water quality. For operational or quality information, current Baltimore City agency material should be consulted; on this map, the lakes are primarily geographic reference points.
Northwest Harbor is one of Baltimore’s defining waterfront features, but this image is not a nautical chart. It does not show tides, channel depths, navigation restrictions, pier operations, real-time water levels, or flood probability. Boating, port operations, and flood-safety decisions require specialized current information from NOAA, FEMA, USGS, Maryland agencies, or local authorities.
A practical way to read the map is to locate the Patapsco River and Northwest Harbor first, then work northward along Jones Falls, Gwynns Falls, and Herring Run. Druid Lake, Lake Montebello, and Lake Ashburton can then be added as local landmarks. This approach is much easier than trying to absorb every stream label at once.
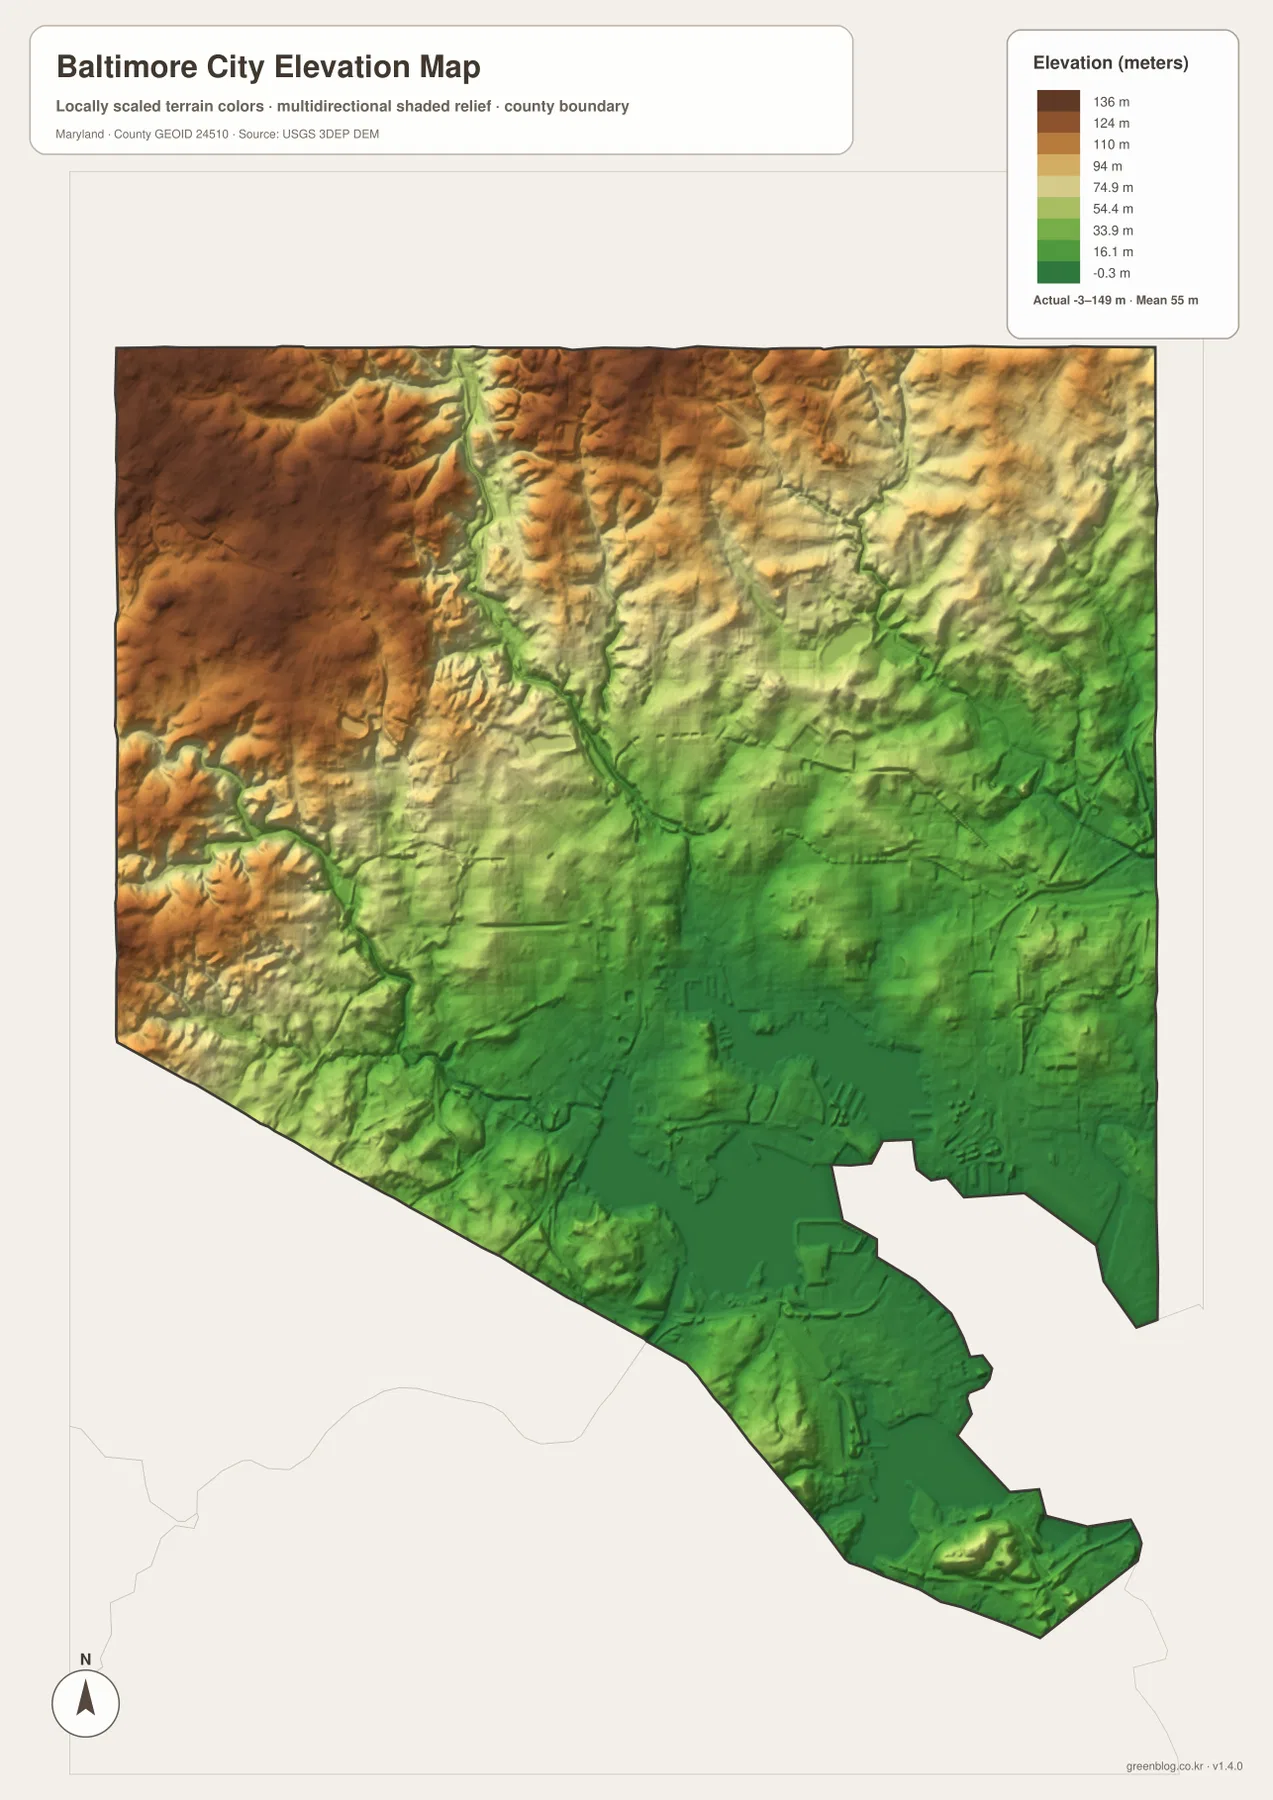
Elevation drops from the northwestern uplands toward the harbor
The elevation map reports an actual range from -3 to 149 meters and a mean elevation of 55 meters for Baltimore City. The locally scaled colors make the broad pattern immediately visible: browns and tan shades dominate the higher northwestern and western terrain, while greens spread across the lower central, southern, and southeastern parts of the city. Baltimore may be known as a waterfront city, but the map shows that the jurisdiction is far from uniformly flat.
The higher northwest is cut by lower stream valleys. The Jones Falls corridor creates a clear lower path through the surrounding uplands, and western drainage corridors show similar relationships. When the elevation map is compared with the water map, the reason for many of the stream routes becomes intuitive: water follows lower terrain between ridges and hills on its way toward the Patapsco system.
Central Baltimore is generally lower than the far northwest, and the Patapsco River and harbor surroundings are among the lowest broad areas shown. The long southeastern extension of the city is also mostly rendered in lower green tones. This gradual change from upland to waterfront helps explain why relief is more pronounced in the northwest even though the southern harbor dominates Baltimore’s public image.
The elevation colors are designed for regional comparison, not parcel-level measurement. They should not be used to determine the elevation of a building entrance, design drainage, establish a survey point, or judge flood exposure. Those tasks require authoritative elevation data such as the USGS 3D Elevation Program, professional survey information, and dedicated flood products where appropriate.
Each map answers a different question about the same compact urban jurisdiction
Use the general boundary map when the question involves Baltimore City’s jurisdiction, surrounding counties, or broad road orientation. It provides the most direct explanation of why Baltimore City is separate from Baltimore County and how the city extends toward the harbor. The City Index is cleaner when only the location and overall outline of Baltimore are needed.
Use the terrain-water map for Jones Falls, Gwynns Falls, Herring Run, the Patapsco River, and Northwest Harbor. Use the elevation map when the contrast between the northwestern uplands and the lower waterfront matters. Moving between the water and elevation views is especially helpful because it shows how streams occupy lower corridors and converge toward the southern side of the city.
The downloadable originals are high-resolution JPG files measuring 2572 × 3638 pixels each. They are suitable for full-page documents, classroom material, presentations, and personal reference, and individual areas can be enlarged when smaller labels need attention. Enlargement does not add live traffic, flood zones, nautical depth, parcel boundaries, or survey-grade elevation, so specialized work should always be checked against current official sources.
Baltimore City is geographically compact compared with many rural counties, yet roads, stream valleys, harbor water, and elevation change are densely layered inside its boundary. Separating those subjects across the four supplied map views makes the city easier to understand than forcing every feature onto one crowded map.
Frequently Asked Questions
Is Baltimore City part of Baltimore County?
No. Baltimore City became independent from Baltimore County in 1851 and is treated as a county-equivalent jurisdiction by the U.S. Census Bureau. The shared name can be confusing, but Baltimore City and Baltimore County are separate jurisdictions.
Can the 573,243 figure on the City Index be used as Baltimore’s current population?
It should not be treated as a current population figure because the supplied image does not state a reference year or statistical definition. This article treats it only as the value printed on the map. Use the latest U.S. Census Bureau data when a current population estimate or count is required.
Can the -3 to 149 meter elevation range be used for surveying or flood decisions?
No. The range is useful for understanding citywide terrain variation, not for parcel-level surveying or flood-risk assessment. Precise elevation work should use authoritative USGS or survey data, and flood decisions should rely on current FEMA and local flood information.
Map File Information
The ZIP archive contains high-resolution JPG maps of Baltimore City matching the map themes described on this page.
- Included Files: city boundary and roads map, City Index map, terrain and water map, elevation map
- Printable Size: 2572 × 3638 pixels each
- File Type: JPG
Related Maps
Sources and References
- City of Baltimore – Official Website
- U.S. Census Bureau – TIGER/Line Shapefiles
- USGS – National Hydrography
- USGS – 3D Elevation Program
Green Map creates custom-edited map images using open geographic data sources such as geoBoundaries, Natural Earth, OpenStreetMap, and government open data. These maps are edited visual materials, not raw data files, and are provided for education, documents, presentations, and graphic reference.