Kankakee County, Illinois is easiest to understand by starting in the middle. Kankakee sits close to Bradley and Bourbonnais, creating a compact central cluster of roads and developed areas. Manteno lies farther north, Momence is well to the east, Grant Park is in the northeast, and places such as Herscher and Essex are spread across the western side. The maps on this page separate those relationships into boundary and road detail, major-city distribution, waterways, and elevation. The same high-resolution JPG map files are also available here as a single ZIP download.
The Kankakee River provides a second useful reference line. It crosses the county through the central area near Kankakee and Aroma Park, while the Iroquois River approaches from the south and joins the broader river corridor. North of the central cities, the road network leads toward Manteno and Grant Park. To the west, settlements are farther apart even though many small streams cross the landscape. Looking at the road and water maps together makes the county much easier to read than treating every road or town as an isolated feature.
Each supplied image answers a different practical question. The general county map is best for boundaries, roads, and place names. The ranked-city map strips away much of that detail so the concentration of Kankakee, Bourbonnais, and Bradley stands out. The terrain and water map highlights the Kankakee and Iroquois rivers along with smaller creeks and lakes. The elevation image then shows a broad low river corridor between higher ground, using a local relief range that runs from roughly 133 to 242 meters.
Table of Contents
Using Kankakee as the central reference point
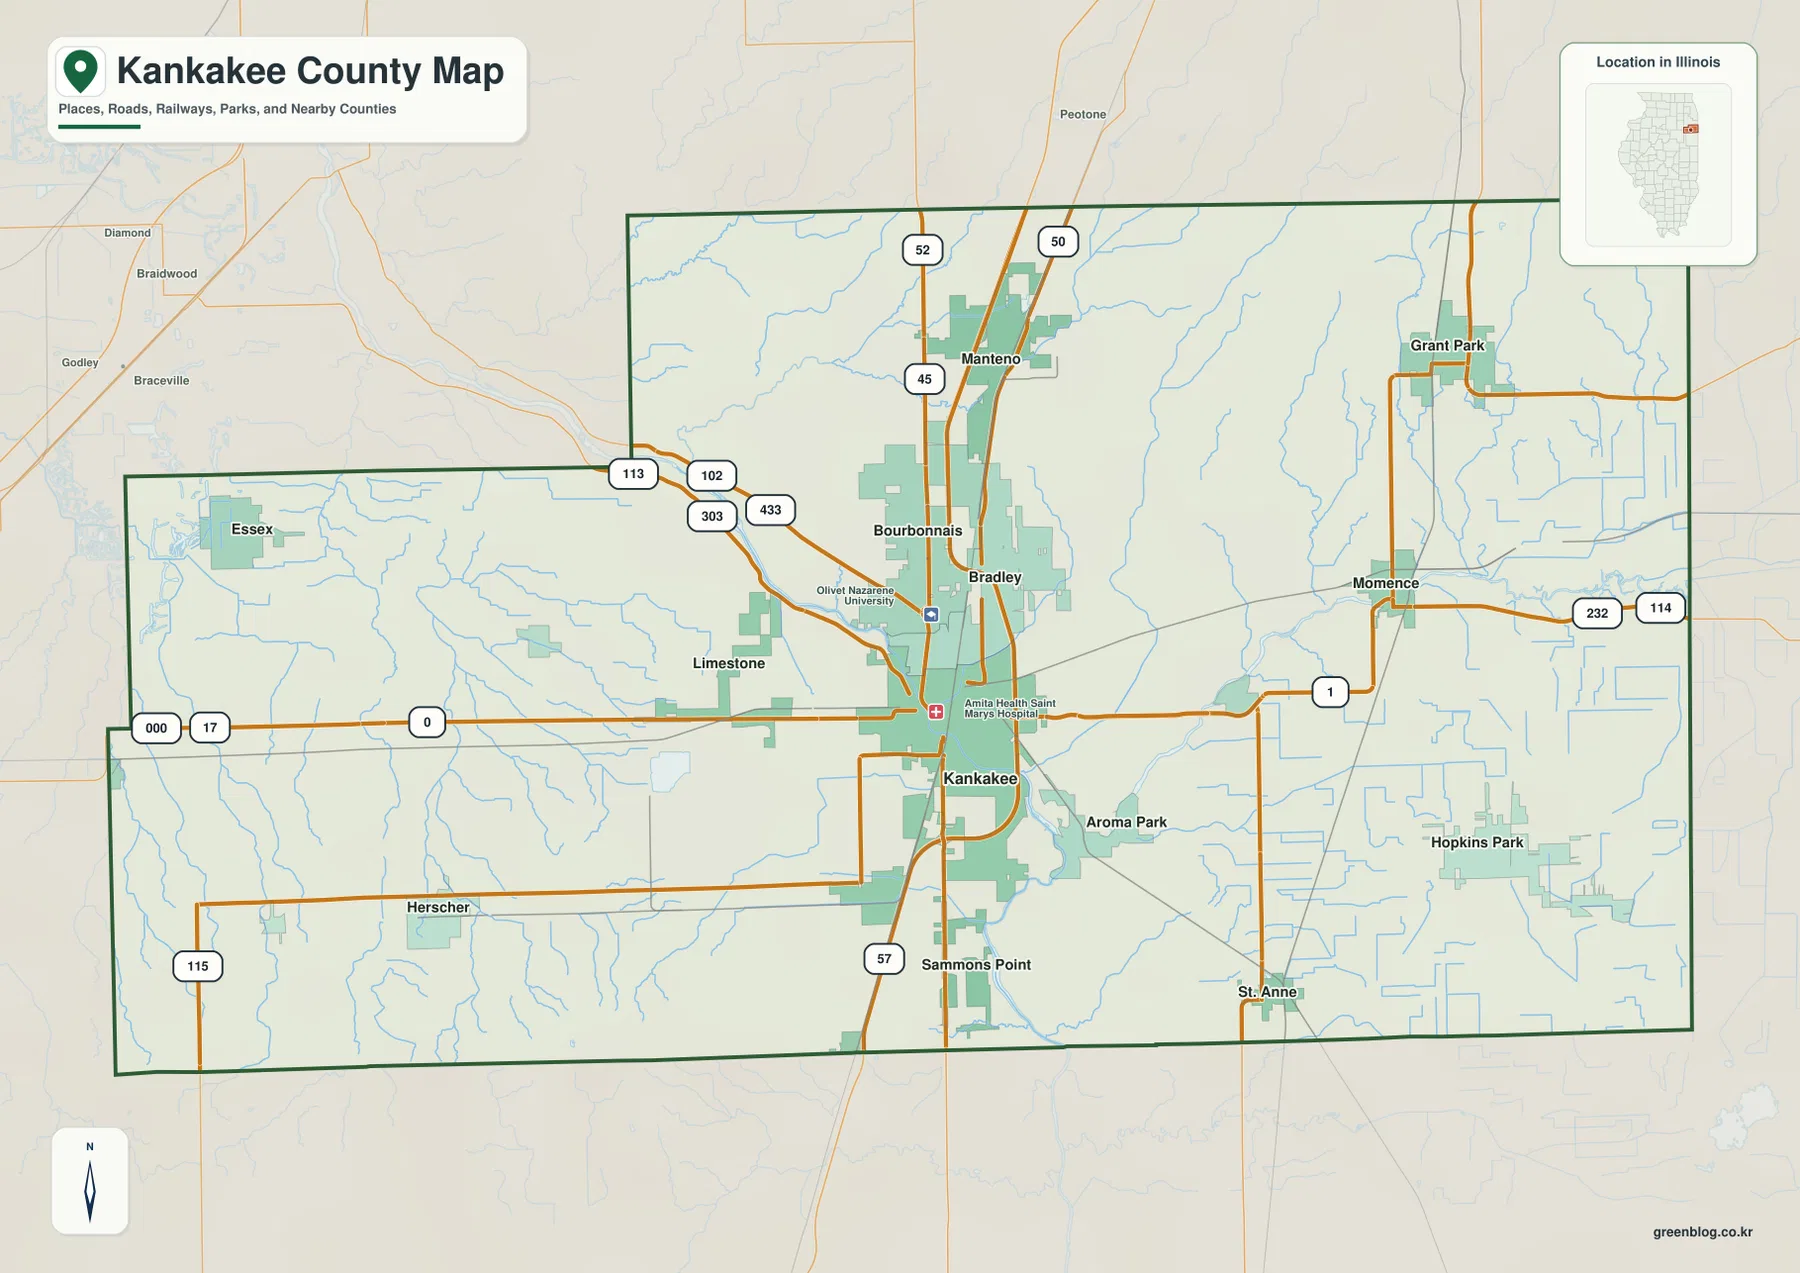
The general map immediately separates a busy center from a more open outer county. Kankakee is near the middle, Bradley is just to its north, and Bourbonnais continues the developed area farther north. Interstate 57 passes through this corridor and provides a clear north-south line on the map. Routes 45, 50, and 52 also appear in the northern half, while Route 17 gives the county a strong east-west reference through the Kankakee area.
West of Kankakee, the pattern opens up. Limestone appears close to the central area, but Herscher and Essex are much farther away from the main cluster. Routes 113 and 102 help connect the western and northwestern side back toward Bourbonnais and Kankakee. The western half is not empty; it simply has wider spacing between named settlements and fewer continuous developed areas. Numerous light-blue stream lines on the map also show that the open-looking landscape is crossed by many small waterways.
East of the central cities, Momence becomes the most obvious reference point. Route 1 reaches eastward from the Kankakee area, and Routes 114 and 232 are visible around the Momence side of the county. Grant Park lies to the northeast, while Hopkins Park is farther southeast. These places are more widely separated than Kankakee, Bradley, and Bourbonnais. The eastern side therefore looks less like one continuous urban strip and more like several distinct settlements connected by longer road segments.
The southern edge has another set of reference points. Sammons Point is south of Kankakee, St. Anne is farther southeast, and Route 57 continues toward the county boundary. Route 115 appears near Herscher on the southwest side. For a reader who has never seen the county before, these place names make useful anchors. Kankakee marks the center, while Manteno, Momence, Herscher, and St. Anne provide north, east, west, and south reference points.
The map also marks Olivet Nazarene University and a hospital near the Kankakee–Bourbonnais area, reinforcing how much activity is concentrated in the middle of the county. This is not a turn-by-turn road map, and it should not be used to judge current construction or local access conditions. Its strength is county-scale orientation: where the main towns sit, which highways connect broad parts of the county, and how far the outer communities are from the central cluster.
A city pattern that fans north and east from the center
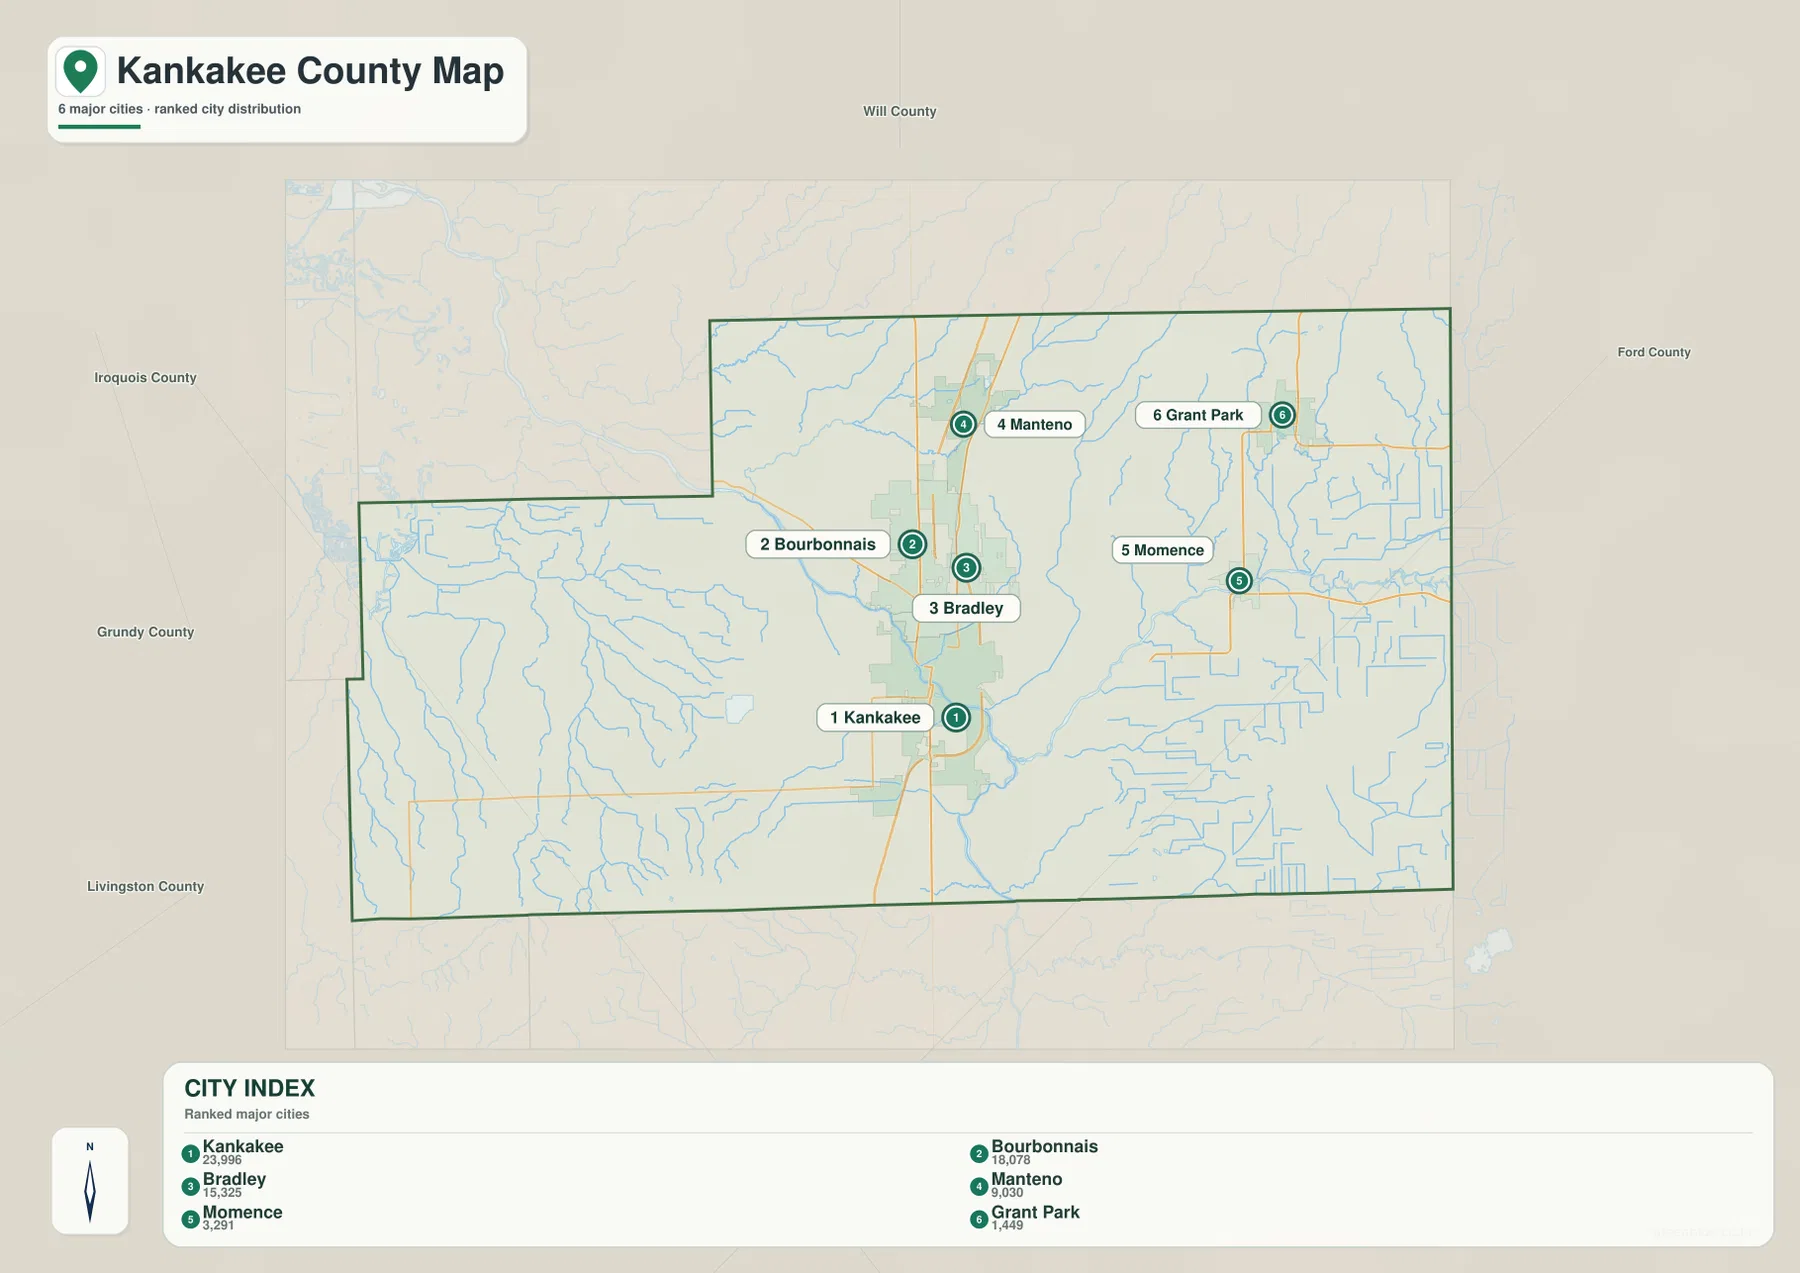
The city-distribution map removes much of the road detail and makes the settlement pattern easier to compare. Kankakee is ranked first and sits near the center-south. Bourbonnais and Bradley, ranked second and third, are immediately north of it. Manteno is farther north, while Momence and Grant Park form separate eastern reference points. Instead of six evenly spaced dots, the result is a tight central group with a northward extension and two more distant eastern communities.
The CITY INDEX printed on the image lists 23,996 for Kankakee, 18,078 for Bourbonnais, and 15,325 for Bradley. The remaining entries are Manteno at 9,030, Momence at 3,291, and Grant Park at 1,449. These figures are best treated as map reference values rather than a substitute for a current official population table. Census releases and municipal boundaries can change, so anyone doing current demographic analysis should verify the latest figures separately.
What matters most here is location. Kankakee, Bradley, and Bourbonnais form a compact trio, and Manteno extends that pattern northward. Momence sits well to the east near the river corridor, and Grant Park is farther northeast. The map therefore works well when the question is not “Which road should I take?” but “Where are the principal population centers relative to one another?” It gives an immediate answer without the distraction of every local road.
Pairing the city view with the general map adds transportation context. Interstate 57 helps explain the strong north-south relationship among the central cities and Manteno. Route 1 points toward Momence, while the northeast requires a different set of connections toward Grant Park. This comparison also makes the western half more noticeable: several western communities appear on the general map, but none of them are part of the six-place ranked city panel.
The ranked markers should not be read as legal city boundaries. They are location symbols placed to explain the county’s major settlement pattern. If an address-level boundary question matters, use a current municipal or Census boundary dataset. For classroom work, trip planning at a broad scale, or an introduction to the county, the simplified pattern is useful precisely because it makes the central concentration and eastern spacing obvious.
Where the Kankakee and Iroquois Rivers organize the landscape
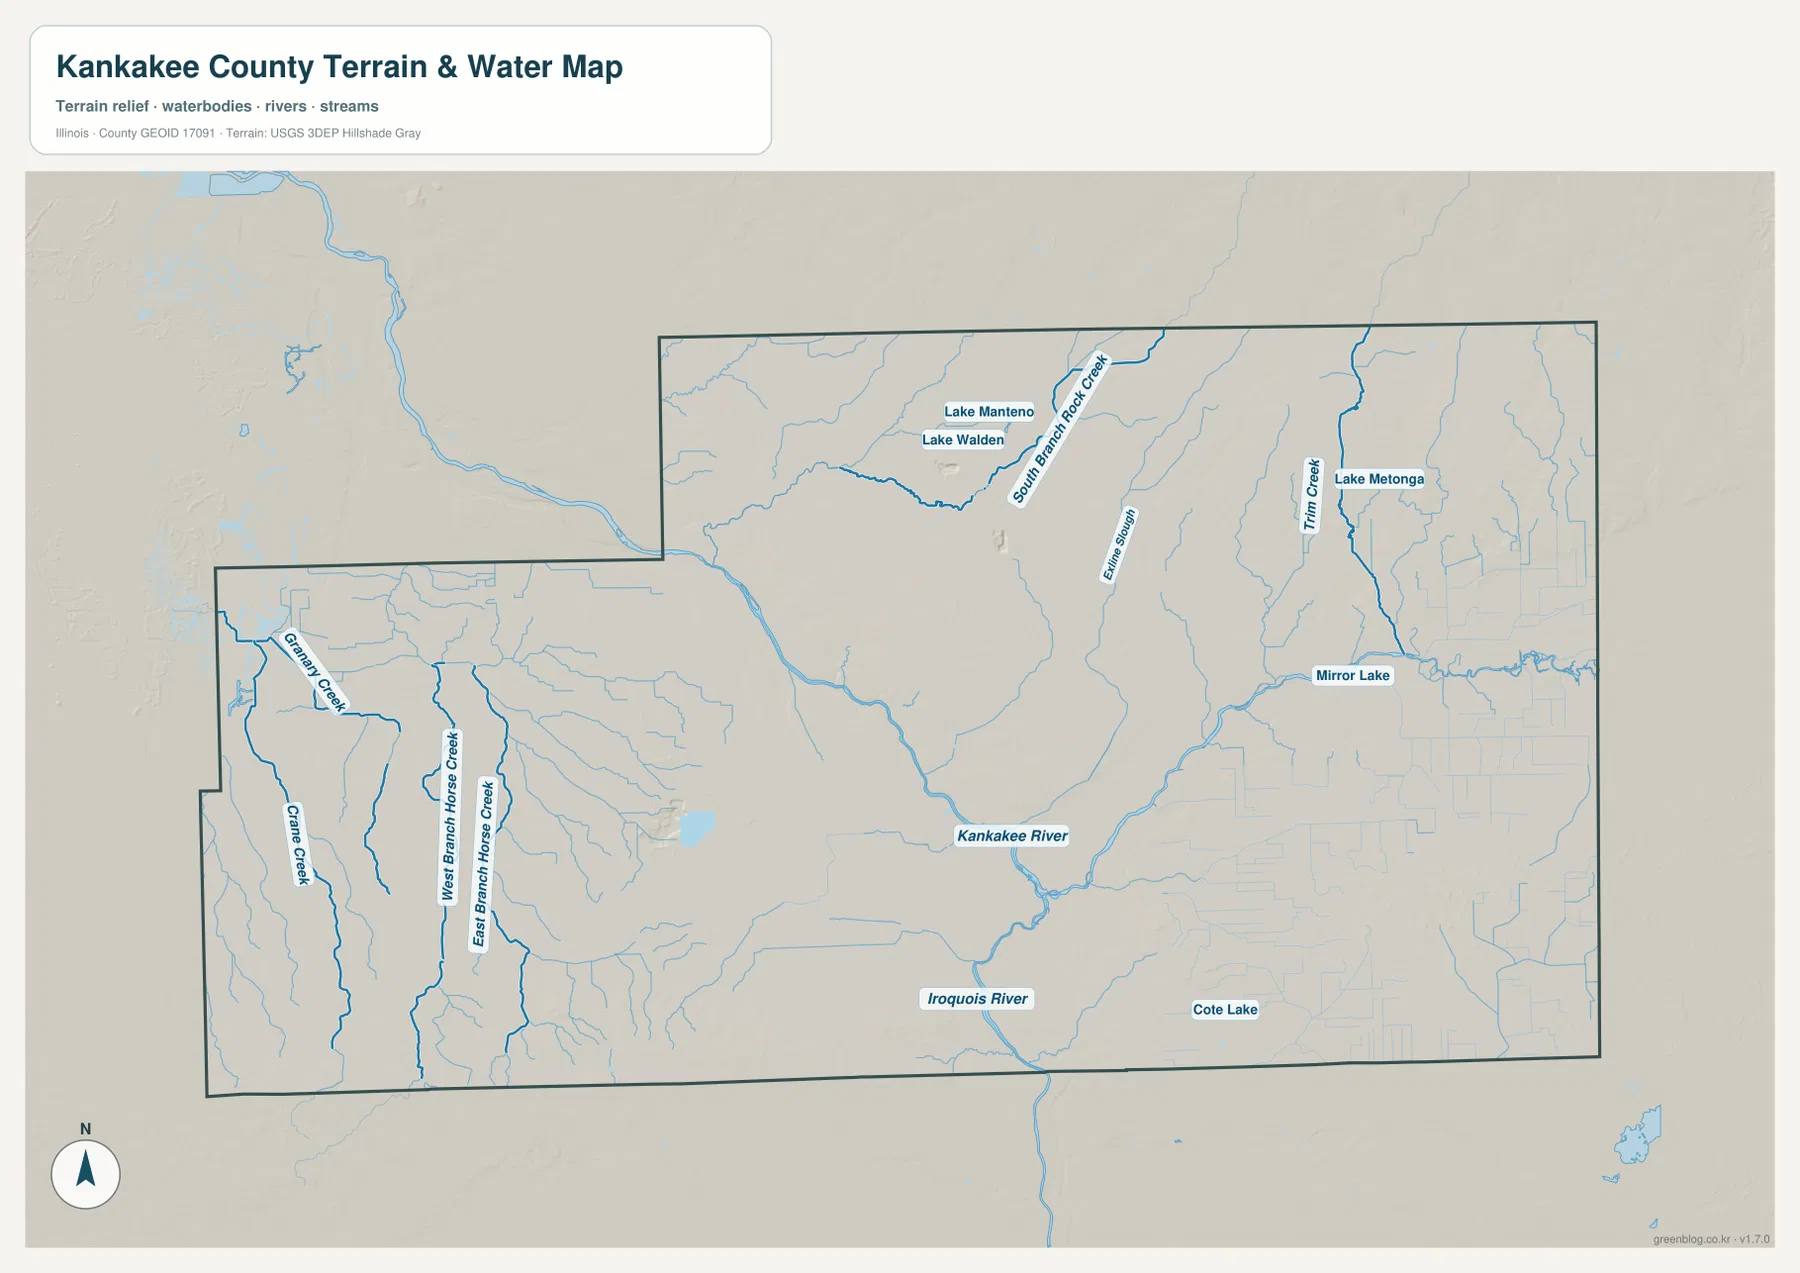
The water map shifts attention away from roads and toward the channels that cut across the county. The Kankakee River is the dominant feature, running through the central part of the map and passing the same general area occupied by Kankakee and Aroma Park on the road map. The Iroquois River approaches from the south and joins the central river system. Seeing those two rivers together provides a much clearer picture of why the middle of the county forms a broad low corridor on the elevation image.
Northern waterways add more detail. South Branch Rock Creek is labeled in the upper part of the county, with Lake Manteno and Lake Walden nearby. Farther east, Trim Creek is shown near Lake Metonga, and Mirror Lake appears closer to the eastern river network. These smaller features are easy to miss on the general road map, yet they show that the northern landscape is crossed by many drainage lines rather than being a single uninterrupted plain.
The western side has its own network. Crane Creek is labeled near the western edge, while West Branch Horse Creek and East Branch Horse Creek run through the southwest and west-central area. This is a useful contrast with the settlement map: western Kankakee County has fewer large urban areas, but it is not lacking in hydrographic detail. Small creeks divide the broad open landscape and create many narrow low areas that become clearer on the elevation map.
Cote Lake is labeled in the southeast, and the water image includes additional small channels around the county. These features should not be interpreted as a flood-hazard map, a wetland delineation, or a navigation chart. Water levels, flood boundaries, and channel conditions can change. The map is intended to show the relative position of rivers, creeks, and mapped water bodies at county scale.
For regional context, the Illinois Department of Natural Resources describes Kankakee River State Park as extending along both sides of the river for about 11 miles. The agency gives the park an area of approximately 4,000 acres. The state page also notes Routes 102 and 113 as important approaches to the park. Those route numbers are visible on the county map west and northwest of the central cities, so the official park description helps connect the abstract road lines with a real river-centered landscape feature.
Low river corridors between higher northern and southern ground
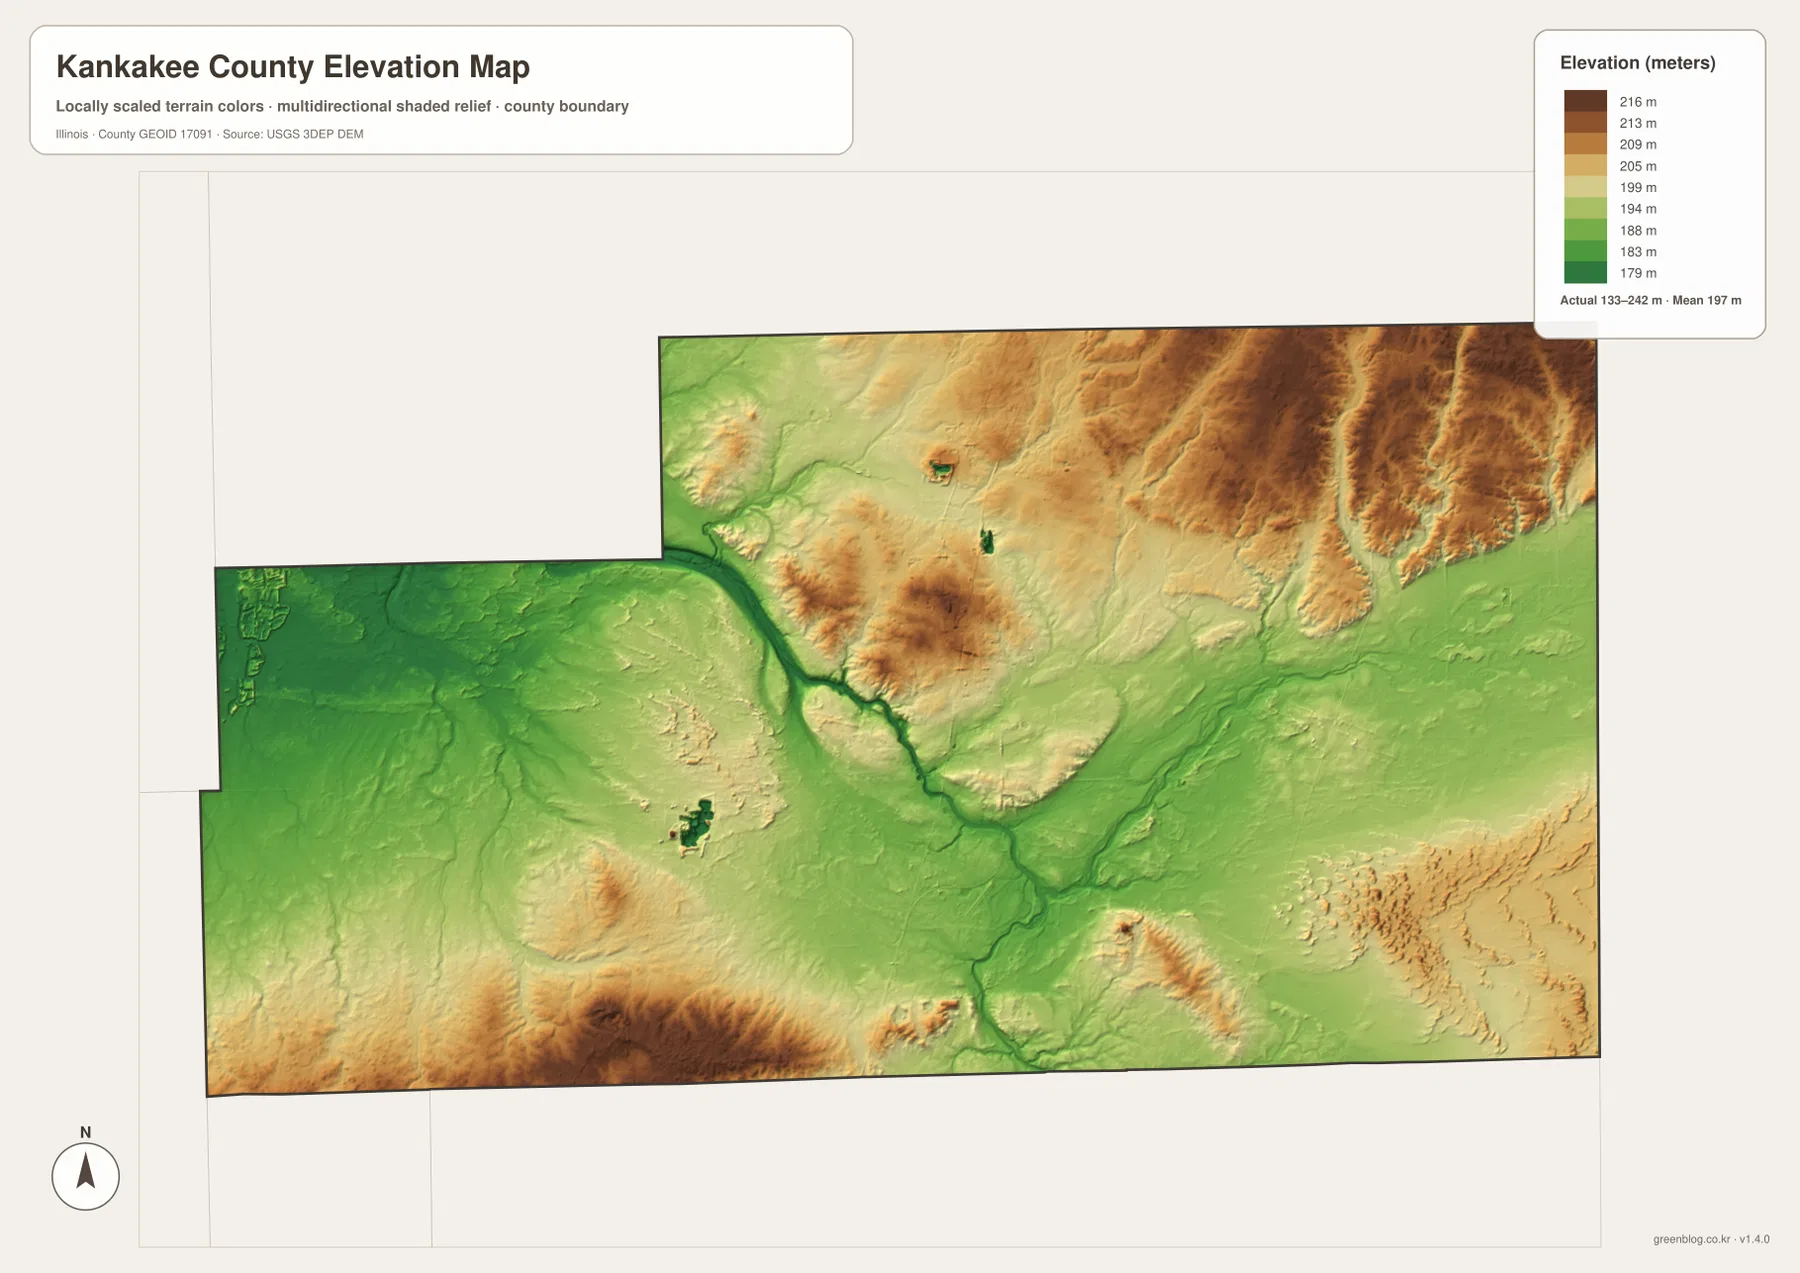
The elevation image gives the county a different shape than the road map. Its legend reports an actual local elevation range of about 133 to 242 meters and a mean near 197 meters. Green shades dominate the main river corridor, while tan and brown areas appear on higher ground. The county is not mountainous, but the relief is strong enough to show a broad low center with higher surfaces and ridges around it.
The Kankakee River corridor is especially easy to follow because it forms a lower green band across the center. The Iroquois River approaches through another low area from the south. When this image is compared with the water map, the relationship becomes intuitive: the largest rivers occupy connected low corridors, and smaller tributaries cut narrower low lines into surrounding terrain. The match is regional rather than survey-precise, but it is clear at county scale.
Higher colors are more extensive in parts of the north and northeast. That area is not one flat plateau; it is broken by many narrow drainage lines and shallow valleys. The water map helps identify some of them, including the South Branch Rock Creek and Trim Creek systems. This combination is useful because a water map alone cannot show how high the land rises around a creek, while an elevation image alone does not name every waterway.
The far southern edge also contains higher terrain, creating another contrast with the low central rivers. On the general map, St. Anne and the southern road network can be used as orientation points. On the elevation image, those same areas sit near a patchwork of higher and lower surfaces rather than a uniform plain. This is why a simple statement such as “the county slopes in one direction” would be misleading; the river system cuts through a varied but generally low-relief landscape.
This elevation map is designed for regional comparison, not engineering measurement. Its 133–242 meter range is useful for seeing where the county is relatively low or high, but it should not replace survey-grade elevation, drainage design, or construction data. For exact heights, the USGS 3D Elevation Program or a site survey is the appropriate source. The image is most useful when read alongside the river map to understand the county’s broad terrain.
Choosing a map without losing the county-scale context
Start with the general county map if you need orientation. It gives you the central Kankakee–Bradley–Bourbonnais cluster, the northward connection to Manteno, the eastern references at Momence and Grant Park, and western places such as Herscher. Once those anchors are familiar, the simpler thematic maps become much easier to use because you can mentally place rivers and elevation colors against known towns and roads.
Use the city-distribution map when the main question is where the largest mapped communities are concentrated. It is especially effective for showing how close the first three ranked places are compared with Momence and Grant Park. Because it deliberately omits many smaller settlements, it should be paired with the general map whenever you need a fuller picture of the county.
Choose the water map for river and creek relationships. Start with the Kankakee River, add the Iroquois River, then look outward to South Branch Rock Creek, Trim Creek, Crane Creek, and the Horse Creek branches. Returning to the city map afterward makes it easier to see which population centers are close to the main river corridor and which lie farther away on smaller drainage systems.
Use the elevation map last when you want to explain why those rivers occupy broad low zones and why the terrain around them varies. The actual range printed on the map, about 133–242 meters, gives enough context to distinguish the lower river corridors from higher northern and southern areas. It is a visual comparison tool rather than a replacement for a detailed topographic survey.
The WebP images on the page are optimized for quick viewing. If you want to zoom in on road numbers, creek labels, city markers, or the elevation legend, the original high-resolution JPG versions are more convenient. The ZIP below contains the same four map types used in the article, allowing you to keep them together or use only the image that fits your project.
Frequently Asked Questions
Which map best shows how Kankakee, Bradley, and Bourbonnais fit together?
The general county map is the best starting point because it shows all three places with Interstate 57 and the surrounding state routes. The ranked-city map is simpler if you only want to compare their relative positions and prominence. Add the water map if you also want to relate the central city cluster to the Kankakee River corridor.
Where can I see the Kankakee River and the Iroquois River on the same image?
Use the terrain and water map. It highlights the Kankakee River across the central county and the Iroquois River approaching from the south. The same image also labels smaller systems such as South Branch Rock Creek, Trim Creek, Crane Creek, and the Horse Creek branches, which helps place the two large rivers in a wider drainage setting.
Can the 133–242 meter elevation range be used for construction or property decisions?
No. The elevation image is a county-scale reference for comparing lower and higher terrain. It is not a survey, parcel record, or engineering dataset. Use USGS elevation data or a professional site survey when exact ground height is required for construction, drainage, or property-specific work.
Map File Information
Download the original high-resolution JPG versions of the Kankakee County boundary and road map, ranked city map, terrain and water map, and elevation map in one ZIP archive. The larger files are useful for zooming, printing, and comparing roads, waterways, settlements, and relief.
- Included Files: 4 high-resolution JPG images
- File Type: ZIP archive containing JPG images
Related Maps
Sources and references
- U.S. Census Bureau TIGER/Line Shapefiles – official geographic files for county boundaries, roads, and related features.
- USGS National Hydrography – official U.S. Geological Survey hydrography information for rivers, streams, and water features.
- USGS 3D Elevation Program – official elevation data and terrain resources.
- Illinois DNR – Kankakee River State Park – state information about the river corridor, park setting, and local access.
Green Map creates custom-edited map images using open geographic data sources such as geoBoundaries, Natural Earth, OpenStreetMap, and government open data.
These maps are edited visual materials, not raw data files, and are provided for education, documents, presentations, and graphic reference.