Forest is the defining land-cover pattern in Ulster County in the 2025 map set. It accounts for 72.08% of the county, forming a broad, nearly continuous area across much of the west and center. Developed land, at 10.25%, is much more concentrated toward the eastern side, while agriculture at 7.47% appears in several eastern and southeastern patches. Wetlands make up 6.78% and water 2.83%, adding smaller but important features that help orient the four maps to the same places.
This page compares four views of the same county: overall 2025 land cover, forest and farmland, impervious surface, and mapped class differences between 1985 and 2025. The WebP images are quick previews, while the four original JPG maps are available together in one download. Reading the maps side by side makes it easier to separate a forest-dominated countywide total from the more mixed land cover visible along the eastern part of the county.
Table of Contents
A forest-dominated county with a more mixed eastern side
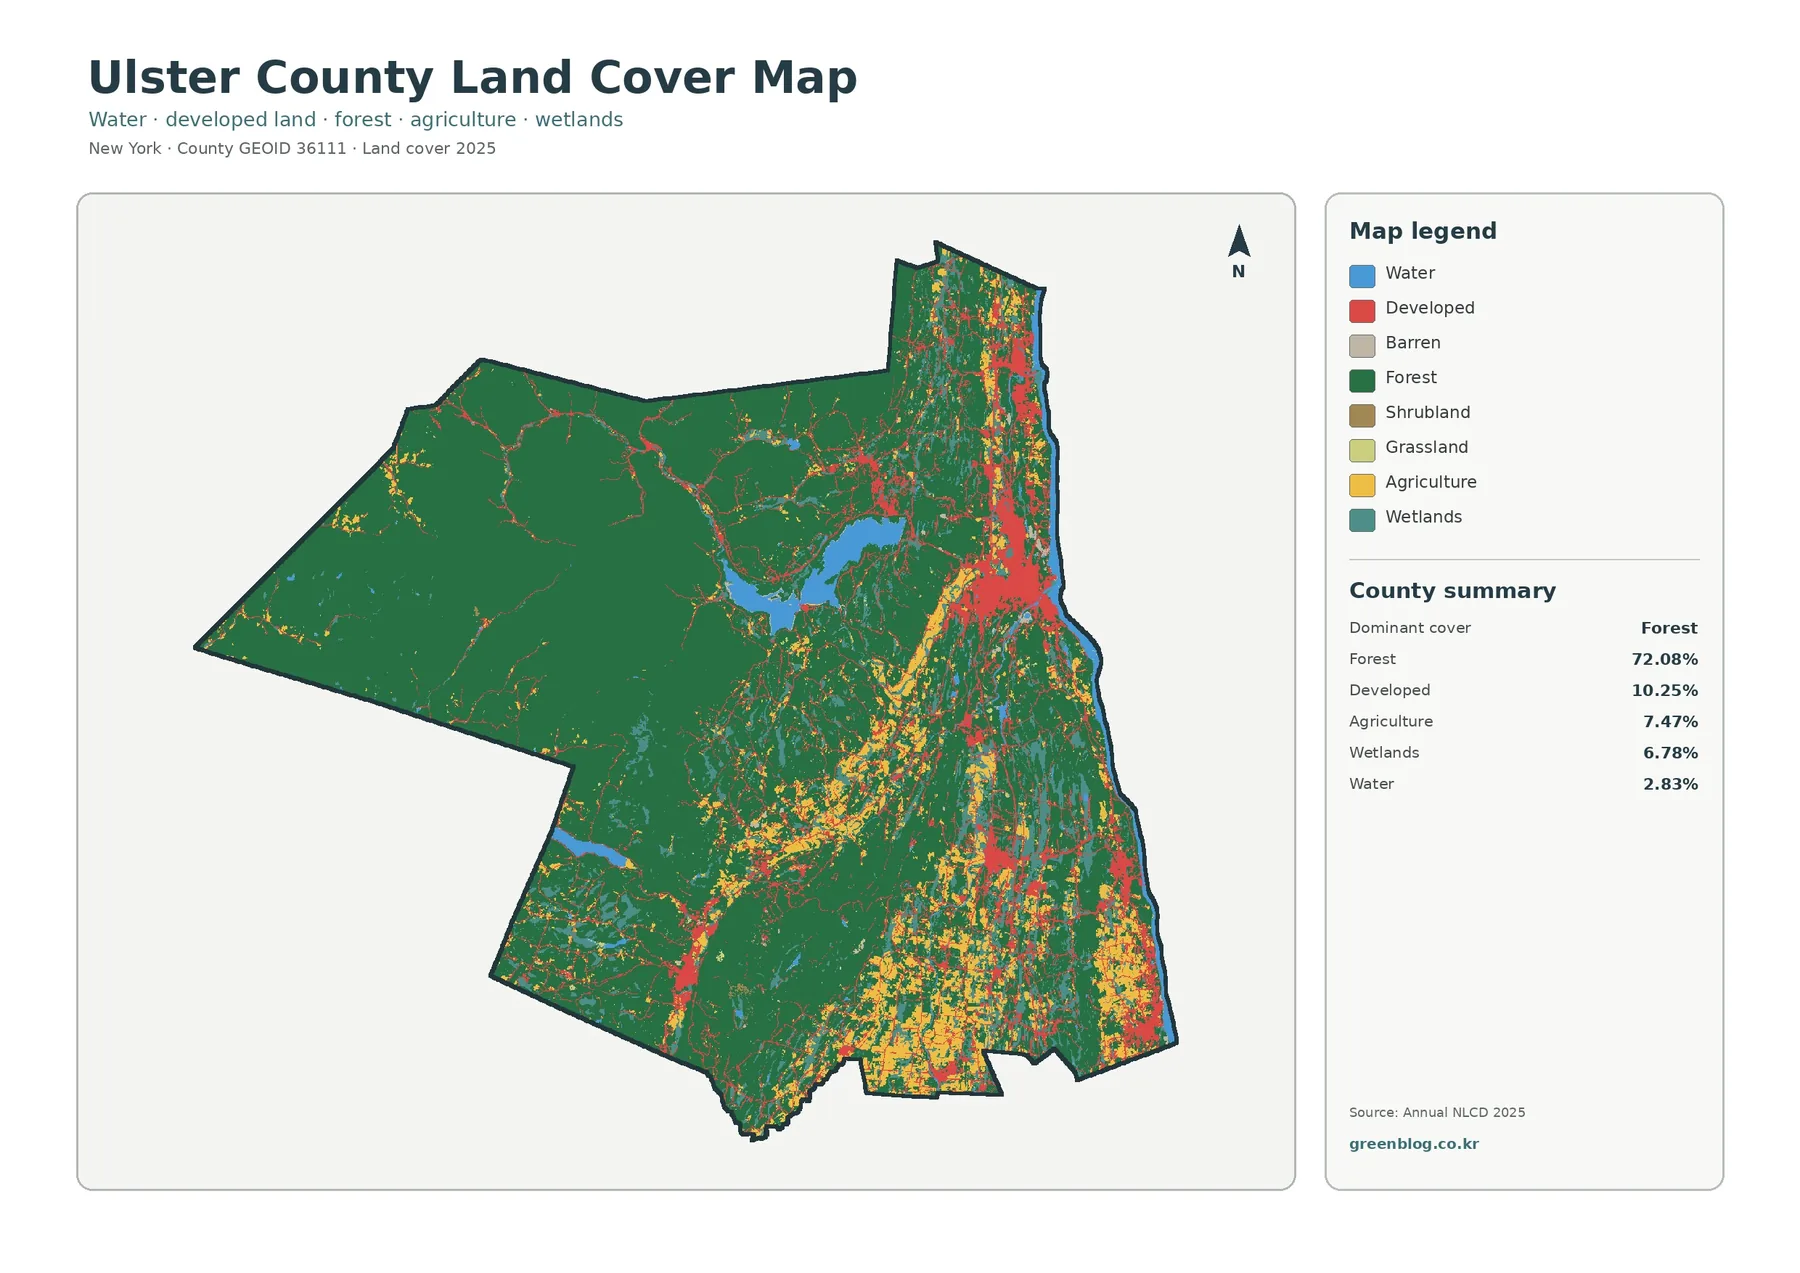
The western projection of the county is almost entirely dark green on the overall map, and that forest color continues through a large part of the central area. Only scattered traces of other classes interrupt it. Moving east, the map becomes more varied. Red developed areas, yellow agricultural patches, teal wetlands, and blue water occur more often, especially in the northeastern, central-eastern, and southeastern portions. The contrast is strong enough that a single countywide percentage would miss an important part of the map’s story.
Developed land covers 10.25% of the county, but its distribution is not even. A large red cluster stands out in the east, with other developed patches and narrow linear features extending north and south. The western forested area contains much less red. This concentration matters when the general map is compared with the impervious-surface map, because developed land is a broad land-cover class and does not mean that every part of a developed cell is pavement or rooftop.
Agriculture accounts for 7.47%. Yellow agricultural areas appear most often in the eastern half and are especially visible in the southeast, where they form larger patches among forest and developed land. Smaller agricultural pieces also occur toward the center and northeast. Farther west, agriculture becomes sparse. The result is a clear east-west contrast between a heavily forested interior and a more varied zone where farms, developed land, wetlands, and forest occur close together.
Wetlands and water are less extensive than forest but remain useful reference features. Wetlands represent 6.78% of the county and appear in numerous patches, particularly in the eastern half. Water covers 2.83%, including several prominent blue areas in the center and other smaller water features. Because these shapes remain in the same positions across the map series, they can be used as visual anchors when comparing land-cover classes, impervious surfaces, and long-term class differences.
Impervious surfaces sharpen the picture of development
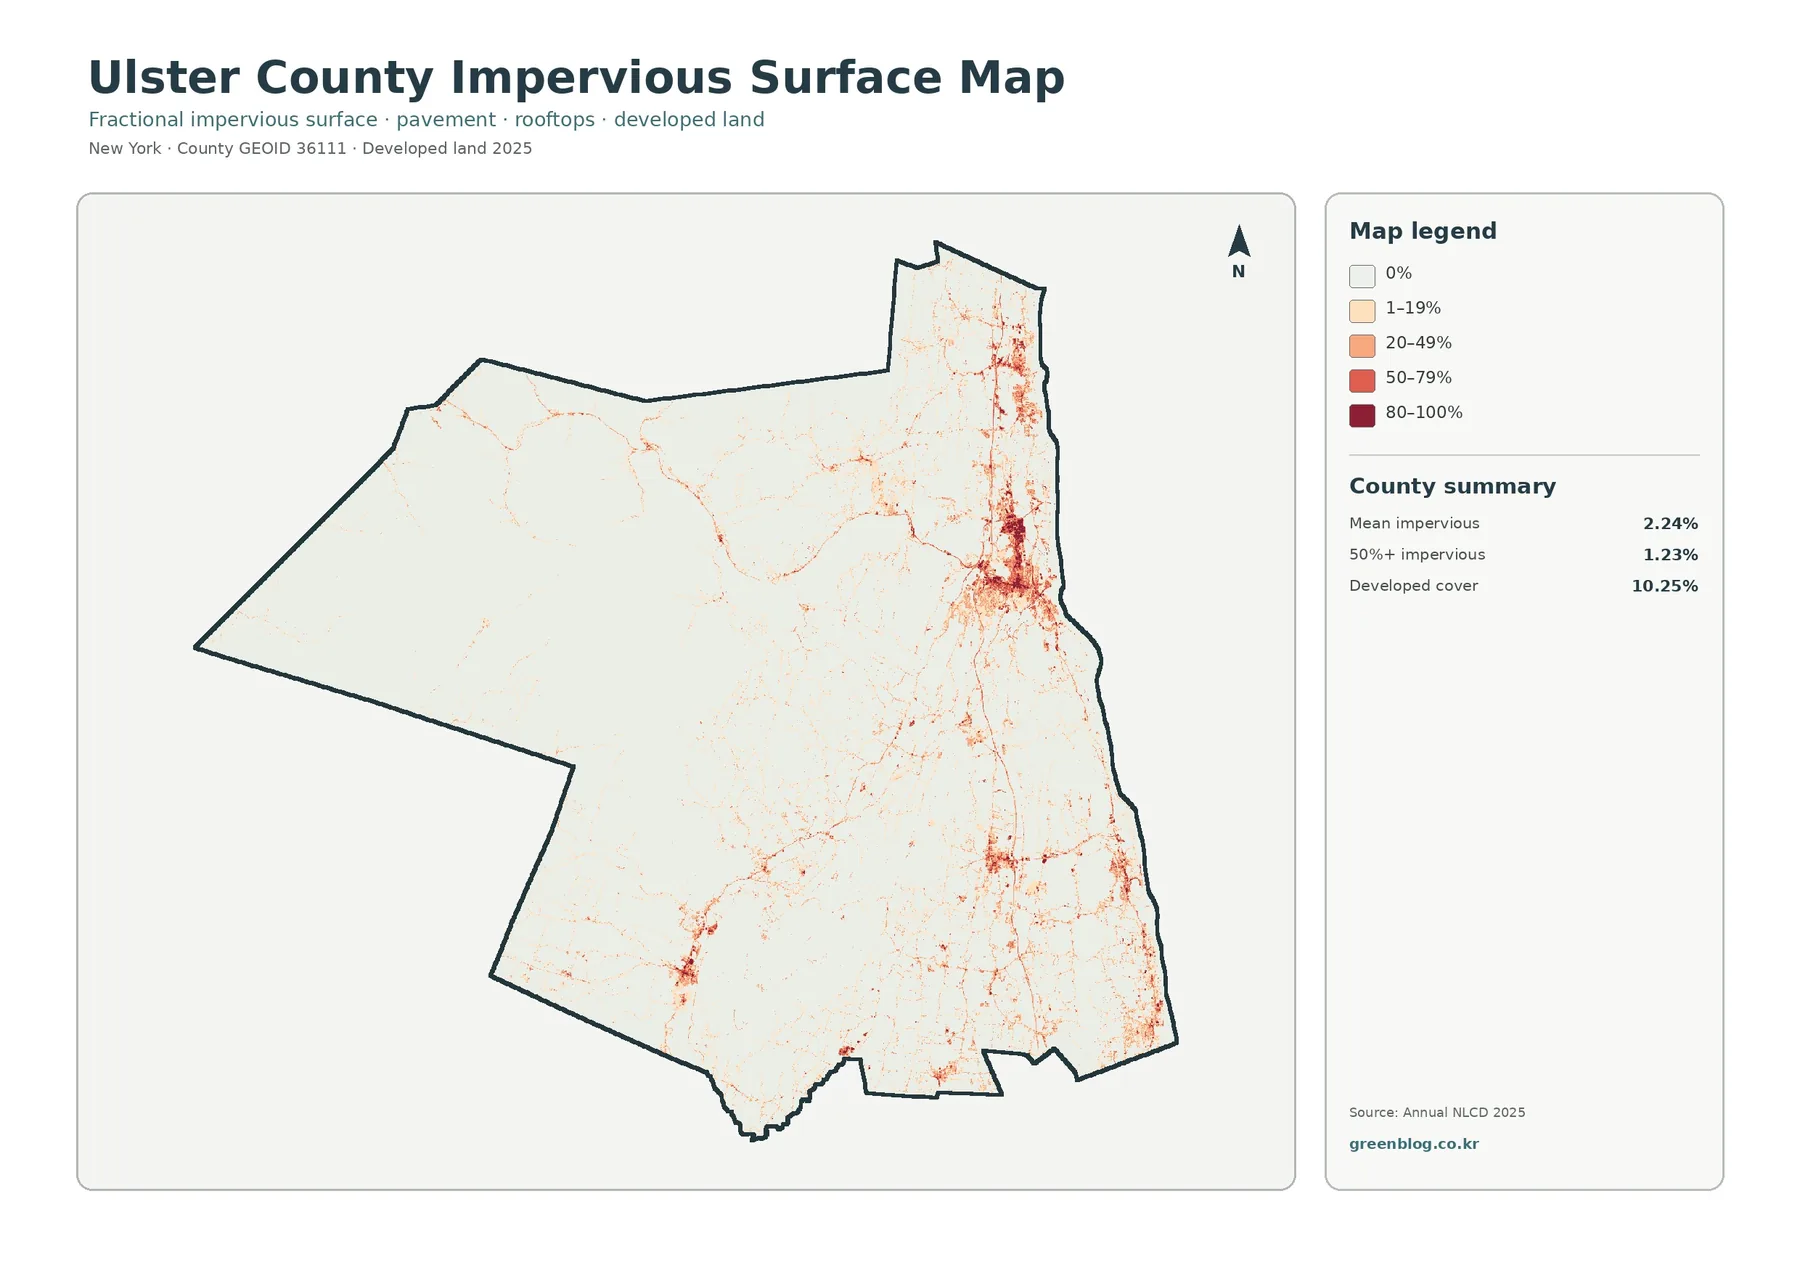
The impervious-surface map is much lighter than the general land-cover map because the countywide mean is only 2.24%. Large forested portions of the west and center contain very little dark shading. In contrast, the eastern developed cluster contains dense orange and red marks. Additional concentrations appear farther north and south, while thin linear patterns extend through otherwise lightly shaded areas. These differences show where hard surfaces are actually concentrated rather than simply where land has been classified as developed.
Only 1.23% of the county is mapped at 50% or greater imperviousness. That figure is far below the 10.25% developed-land share, which is expected because the two measures describe different things. A developed land-cover cell can include lawns, trees, soil, and other surfaces that still absorb water. The impervious layer instead estimates how much of a cell is covered by hard material. Comparing the two maps prevents a common mistake: treating all developed land as if it were completely paved.
The narrow impervious traces are also useful, but they should be read cautiously. They may correspond to paved transportation or other hard-surface features, yet the supplied map does not identify individual roads or facilities by name. It is appropriate to use the layer to compare density, concentration, and broad linear patterns. A separate transportation or facility dataset would be needed for exact feature identification.
Forest and farmland become easier to compare in the simplified view
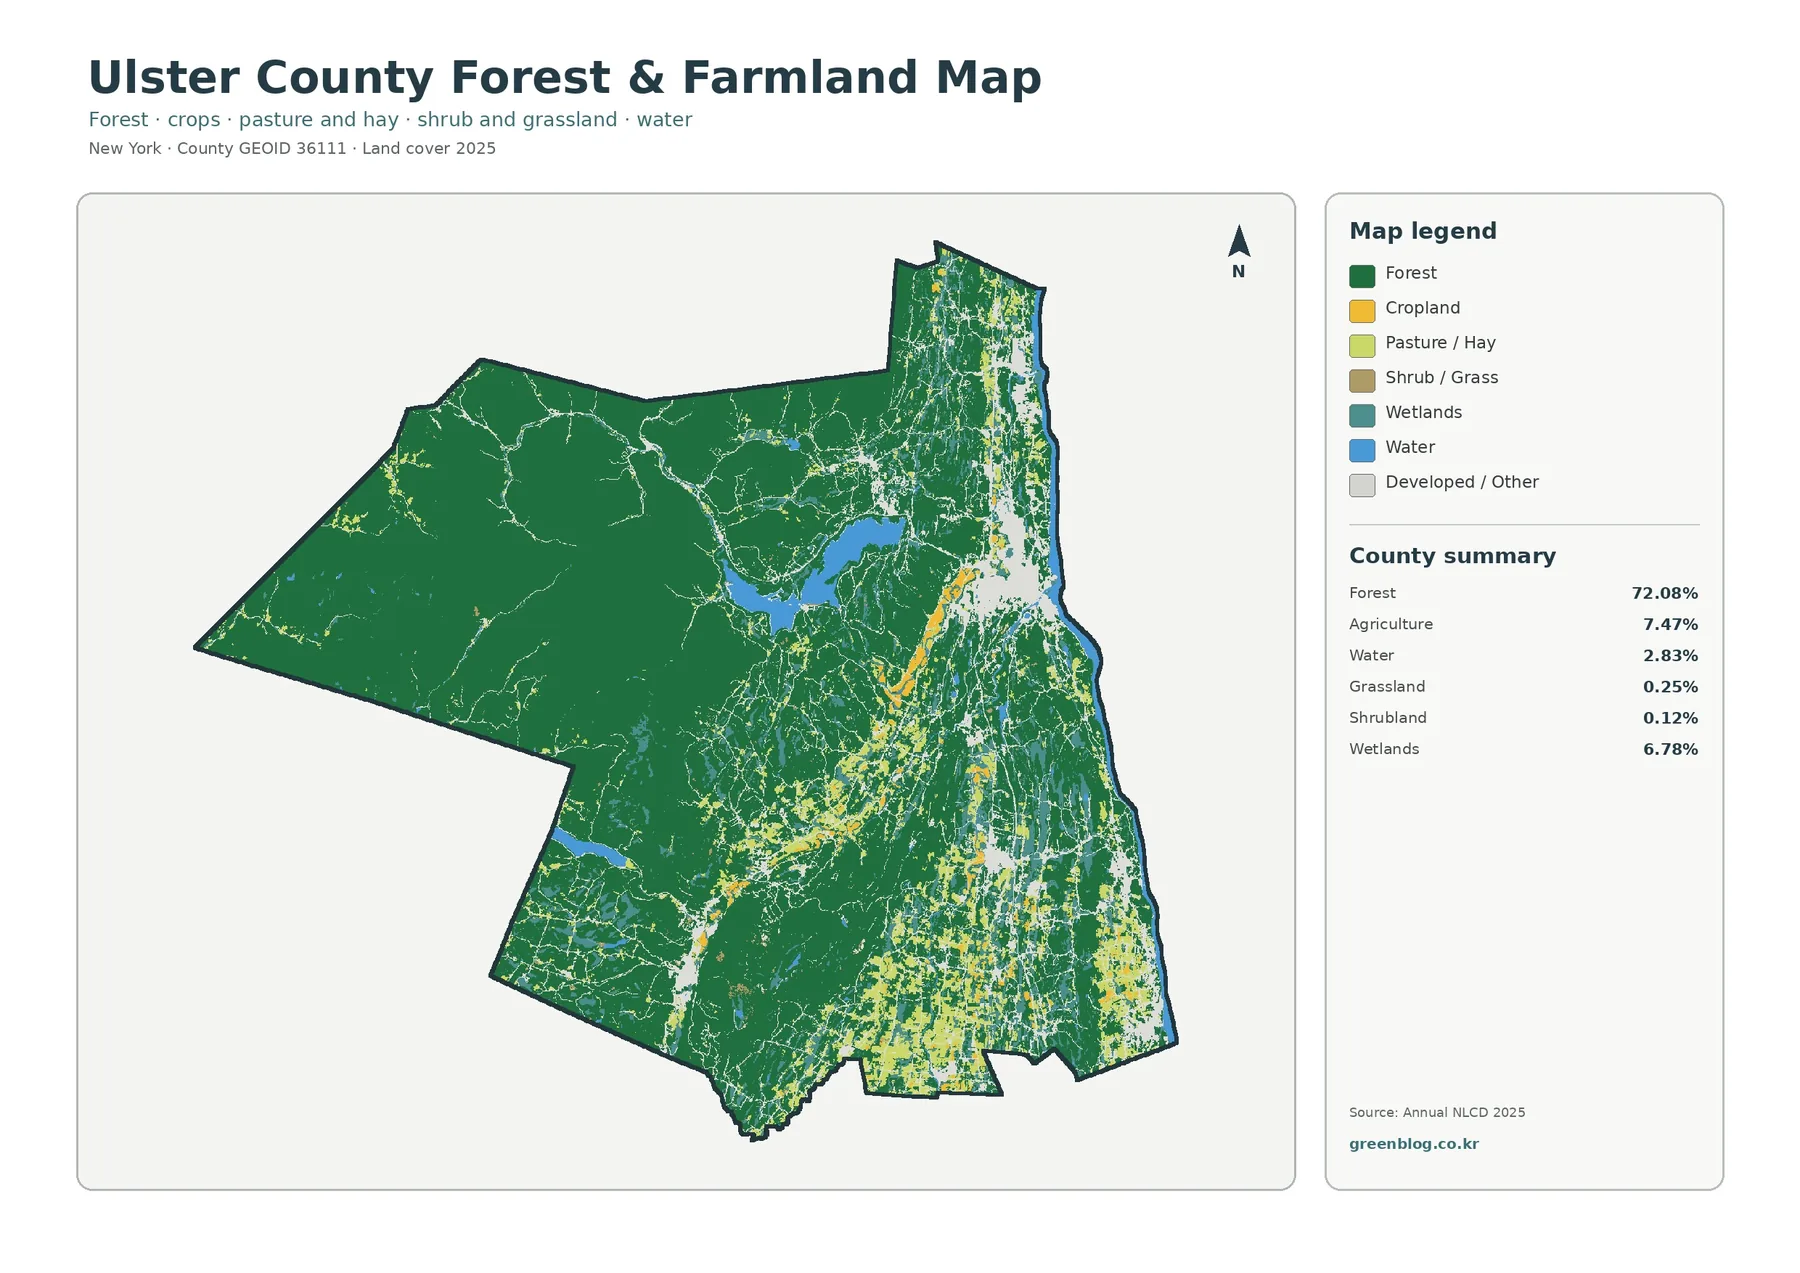
Removing some of the detail from developed and other classes makes the forest pattern even more obvious. The west and much of the center remain a broad green mass, while agricultural colors occur mainly to the east and southeast. The simplified treatment also makes the transition zone easier to see. Rather than one sharp boundary between forest and farmland, the eastern half contains many alternating patches where forest, agriculture, wetlands, water, and developed or other land meet.
The summary lists grassland at 0.25% and shrubland at 0.12%. Those classes occupy very small shares and do not form the dominant pattern on the county map. Wetlands, at 6.78%, are much more substantial and appear in many places around the eastern and central portions. Their presence is easier to notice in this map because the more detailed developed classes from the general map have been simplified into a pale background.
This view is especially useful when the question is not “where is development?” but “how are forest and agricultural areas arranged?” A viewer can follow the large western forest first, then compare it with the patchier eastern landscape. The agricultural areas in the southeast stand out clearly, while the northeast contains a more fragmented mix. That difference helps explain why the countywide forest total is so high even though the eastern side looks much more varied.
What the 1985–2025 class-difference map does and does not show
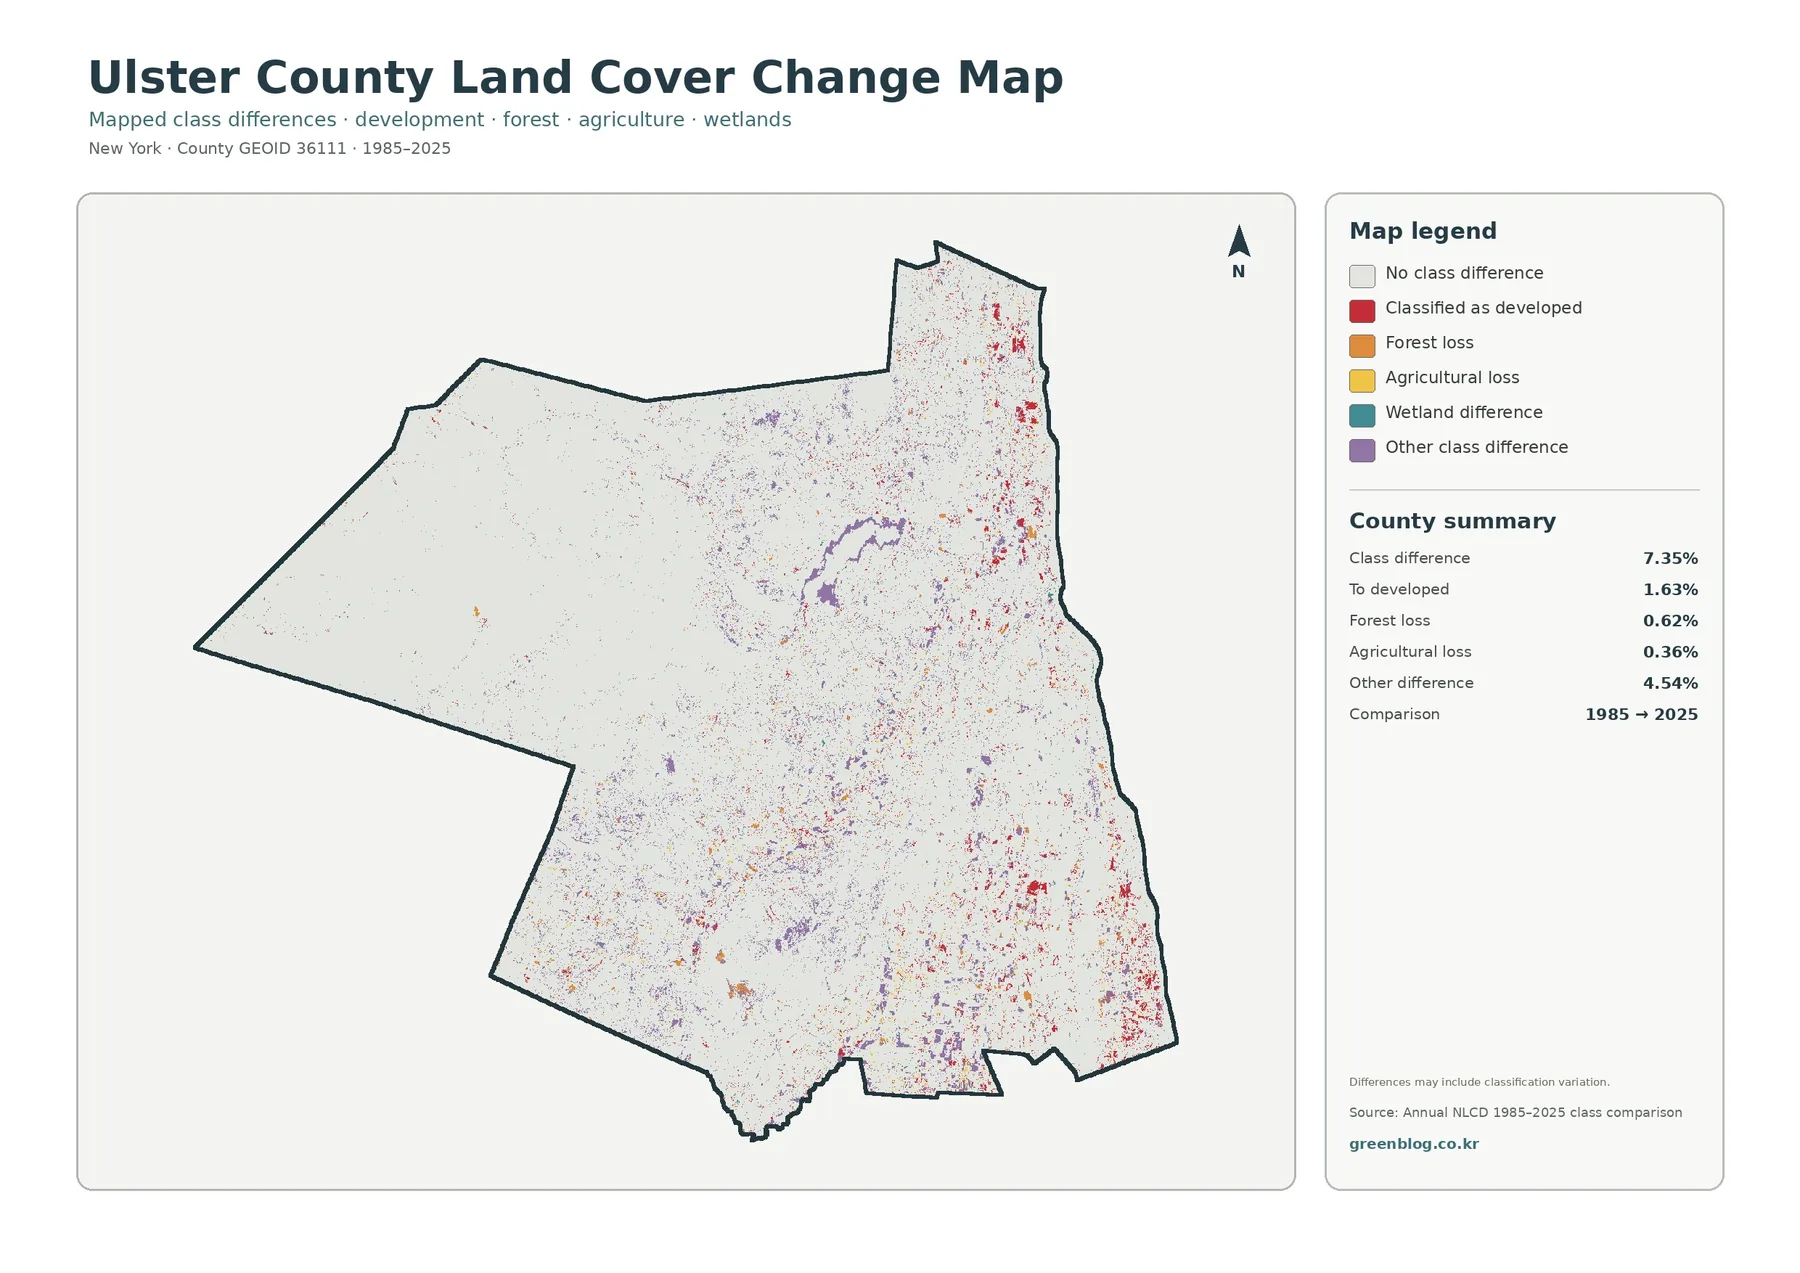
The class-difference summary reports 7.35% of the county as different between the 1985 and 2025 classifications. Of that total, 1.63% is summarized as classified to developed in 2025, 0.62% as forest loss, and 0.36% as agricultural loss. The largest listed component is 4.54% in the “other difference” category. Wetland difference also appears in the legend, so the total should not be reduced to a single story about development or forest loss.
Red developed-difference cells are more noticeable in the eastern part of the county, broadly near areas where the 2025 developed and impervious layers are also more concentrated. Smaller change marks are scattered elsewhere. Purple “other difference” cells occur across a wider area and include a conspicuous group around a central water feature. The distribution is therefore mixed: some differences form clusters, while many others appear as small, dispersed cells.
The comparison uses two endpoint classifications, 1985 and 2025. It is not a year-by-year history of everything that happened between those dates. A location that changed class and later returned to its original class may not appear as different in this endpoint comparison. Classification boundaries can also shift because mixed surfaces inside a raster cell are represented by one class. For site-level history, intermediate-year imagery or other time-series data would be needed.
A practical way to compare the four Ulster County maps
Start with a location that is easy to recognize across all four images. The large eastern developed cluster works well because it appears red in the general land-cover map and much darker in the impervious layer. After locating it, check the forest-and-farmland map to see how surrounding forest and agricultural patches are arranged. Then use the class-difference map to see whether cells in the same area were classified differently between 1985 and 2025. This sequence keeps current conditions separate from long-term comparison.
The western forest provides a second useful test area. It is strongly green in the two land-cover views but mostly pale in the impervious map. The change layer contains scattered marks, yet it does not show the same dense developed pattern seen in the east. Comparing a heavily forested area with a more developed eastern area makes the meaning of each map clearer than reading four legends in isolation.
These maps can support broad regional reference, classroom work, environmental education, presentation graphics, and comparisons among land-cover themes. The overall map is the best starting point for explaining the county’s mix of classes. The forest-and-farmland version works when vegetation and agricultural patterns are the focus. Impervious surfaces are more useful for showing hard-surface concentration, while the 1985–2025 layer should be used only when discussing classification differences across the two dates.
Download the four original JPG maps
The download archive contains four separate JPG files: the 2025 land-cover map, forest and farmland map, impervious-surface and developed-land map, and the 1985–2025 class-difference map. Each image includes its own title, legend, and county summary, so the files can be used independently. Keeping them separate also makes it easier to choose one map for a slide or handout without mixing several legends on the same page.
Each original JPG is 2480 by 1754 pixels. The supplied asset manifest does not mark these files as meeting the package’s A3 high-resolution reference, so the page should not promise a specific print quality. Before large-format printing, check whether the legend and small labels remain readable at the intended physical size. The original JPGs are the appropriate files for that check rather than the smaller WebP previews used in the article.
Limits to keep in mind when using the maps
Land cover is a description of the surface, not a legal land-use designation. A forest cell does not establish ownership or protection status, and a developed cell does not identify zoning or building rights. Parcel lines, property boundaries, permits, and regulatory areas require different records. These four maps are designed for county-scale comparison, not parcel surveying.
The underlying land-cover information is represented as raster cells, meaning the landscape is divided into a grid and each cell is assigned a class or value. At edges between forest, farms, wetlands, roads, and water, more than one surface can exist within the same cell. That mixed condition is generalized when the map displays one representative class. Small features and narrow boundaries can therefore look simpler than they do on the ground.
Countywide percentages should also be read as summaries rather than local measurements. Forest at 72.08% does not mean every part of Ulster County is roughly three-quarters forest. The western part is much more continuously green, while eastern areas contain larger developed and agricultural patches. Use the percentages to understand the county as a whole and the map itself to understand where the classes are concentrated.
The 2025 maps describe the supplied classification year. Construction, clearing, vegetation recovery, farming changes, or wetland changes after that observation period may not be reflected. If a current site condition is important, use newer imagery or field information in addition to these county maps. For historical interpretation, remember that the class-difference layer compares two dates rather than documenting every intermediate year.
Frequently Asked Questions
What is the largest land-cover class in Ulster County in 2025?
Forest is the largest class at 72.08%. Developed land follows at 10.25%, agriculture at 7.47%, wetlands at 6.78%, and water at 2.83%. The map shows that forest is especially extensive across the west and center, while developed and agricultural classes are more common in the eastern part of the county.
Why is developed land 10.25% while mean imperviousness is only 2.24%?
Developed land is a broad land-cover classification and can include trees, lawns, soil, and other permeable surfaces along with buildings and pavement. Imperviousness measures the share of hard surfaces such as rooftops and pavement within mapped cells. The county summary reports only 1.23% of the county at 50% or greater imperviousness, so the two measures should not be treated as interchangeable.
Does the 7.35% class difference mean 7.35% of the county was newly developed?
No. The 7.35% figure is the total share classified differently between 1985 and 2025. The supplied summary lists 1.63% classified to developed, 0.62% forest loss, 0.36% agricultural loss, and 4.54% other difference, while the legend also includes wetland difference. The categories need to be read separately, and the map alone does not establish the cause of each difference.
Map File Information
The ZIP contains four original JPG maps for Ulster County: 2025 land cover, forest and farmland, impervious surface and developed land, and the 1985–2025 class-difference map.
- Included Files: Ulster County land cover, forest & farmland, impervious surface, and 1985–2025 class-difference maps
- File Type: One ZIP with four separate original JPG maps
- Intended Use: Printing reference, classes, presentations, environmental comparison, and map review
Related Maps
- Albany County Land Cover Map
- Allegany County New York Land Cover Map
- Bronx County New York Land Cover Map
Sources and references
- MRLC Annual NLCD Data — official access to the Annual NLCD data family used for the land-cover maps.
- USGS Annual NLCD Land Cover Classification — official documentation for land-cover classes and interpretation.
- U.S. Census Bureau TIGER/Line Shapefiles — official geographic boundary and identifier resources for counties.
Green Map creates custom-edited map images using open geographic data sources such as geoBoundaries, Natural Earth, OpenStreetMap, and government open data.
These maps are edited visual materials, not raw data files, and are provided for education, documents, presentations, and graphic reference.