The Kings County New York Land Cover Map is dominated by developed land, with open water forming the largest contrasting cover around the county’s edges. The 2025 summary places developed cover at 82.82% and water at 12.68%. Forest, wetlands, barren land, grassland, and shrubland occupy much smaller shares, so the county reads very differently from the forest- or farm-dominated counties elsewhere in New York.
Four map views are included: general land cover, forest and farmland, impervious surface and developed land, and mapped class differences from 1985 to 2025. The WebP images make the page quick to browse, and all four original JPG maps are available together in one ZIP download for printing, teaching, presentations, and offline comparison.
Table of Contents
A landscape shaped mainly by developed cover
Developed land fills most of the mapped land area. Large red blocks extend across the western, central, and southern portions, with only limited breaks for water, vegetation, and other surfaces. The 82.82% developed figure captures that pattern well. Agriculture contributes just 0.01%, so there is no broad farm belt comparable with the agricultural counties farther from the metropolitan core.
Water is the second-largest class at 12.68%. A broad blue area occupies the eastern side of the map, and additional water appears around the southern and western edges and in smaller internal features. Because water is included inside the county map boundary used for this dataset, it makes up a substantial share of the total mapped area.
Forest covers 0.91%, wetlands 1.60%, and barren land 0.97%. Those percentages are small, yet the remaining green and teal patches are visually important because they break up an otherwise continuous developed surface. Their location is often near water or in isolated open areas rather than in one large interior block.
What the 2025 land cover map reveals
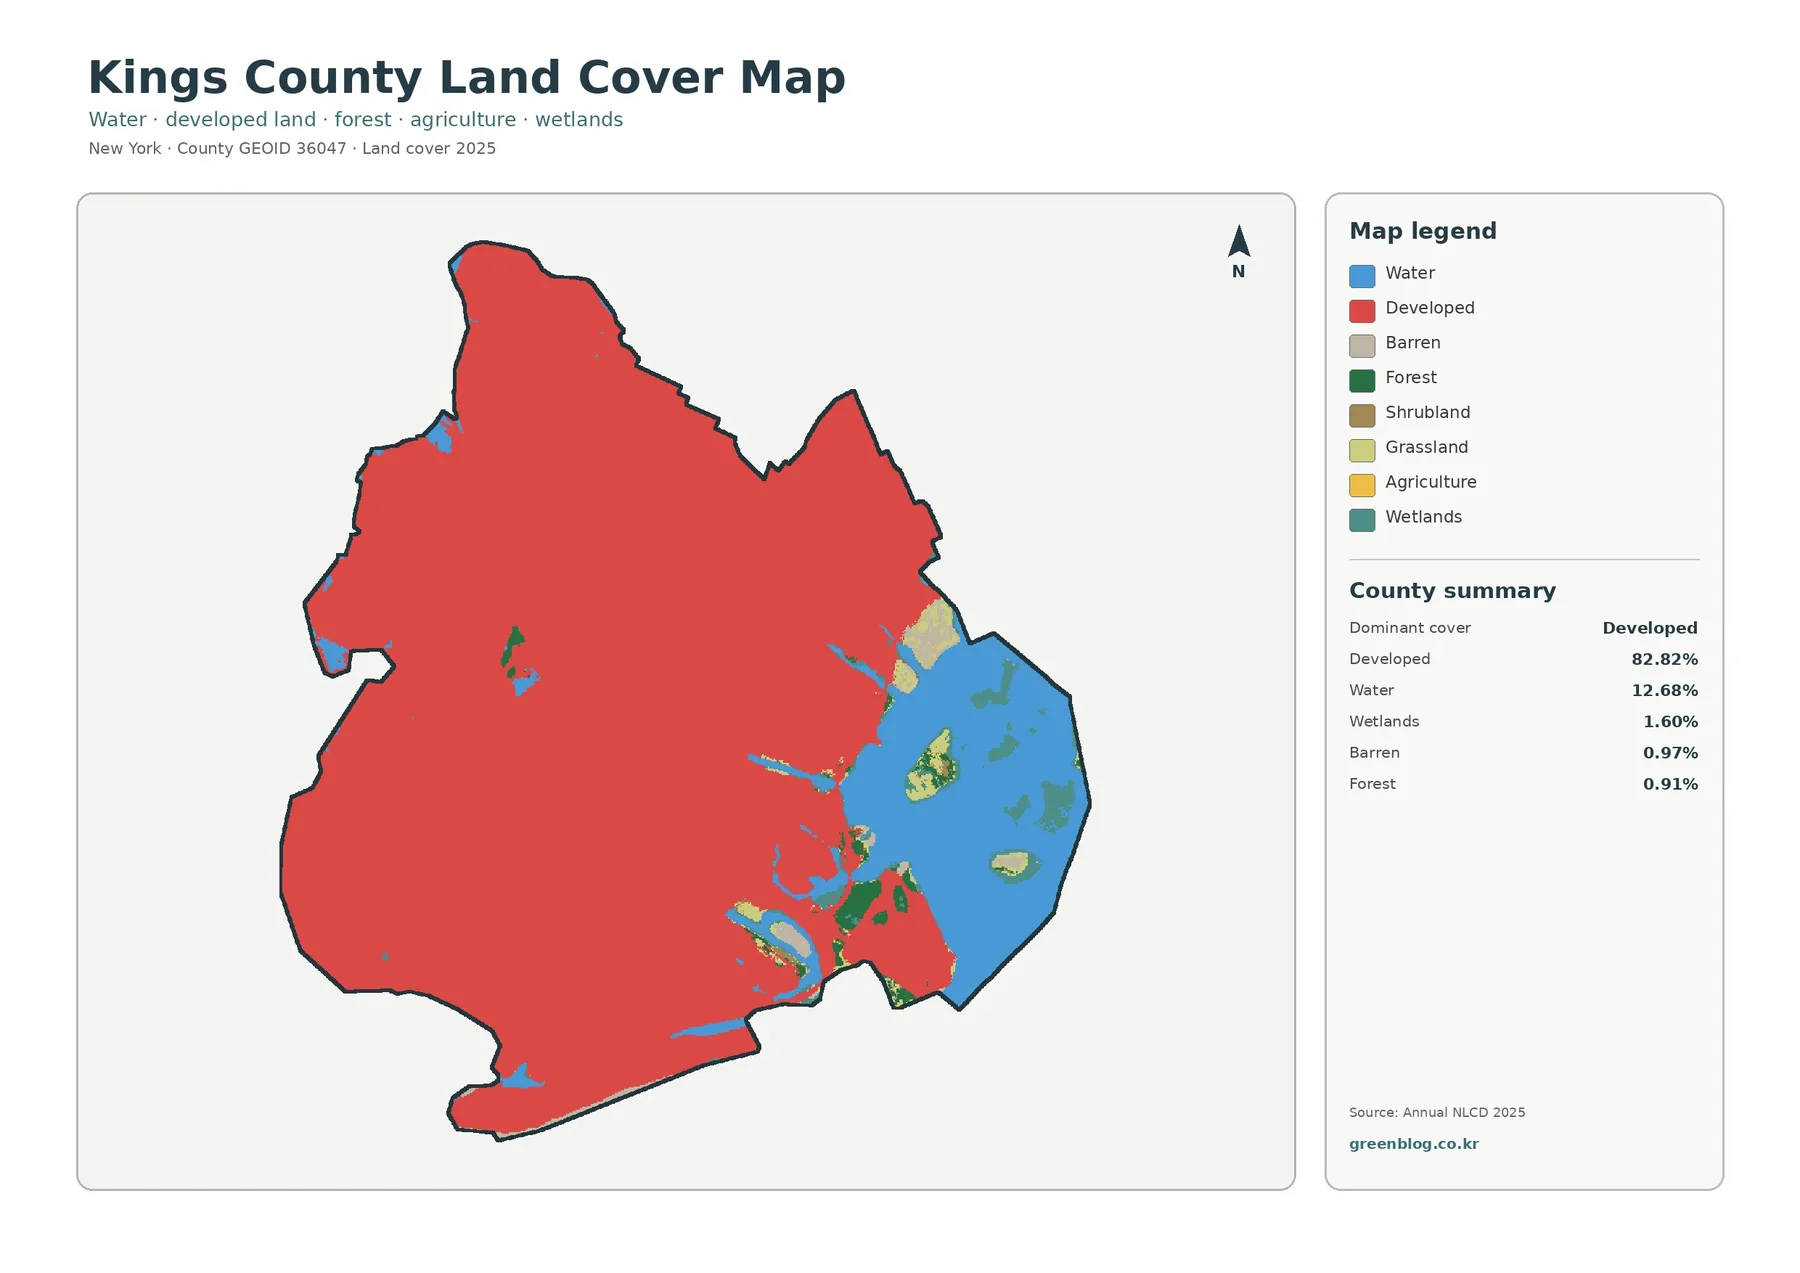
The general map makes the county’s urban character immediately visible. Developed land is not confined to a few centers; it forms the background across almost the entire land area. Open water creates the strongest interruption, especially to the east, while small green and teal patches mark forest and wetland locations.
A developed classification does not mean every point inside that area is a building or paved street. Urban neighborhoods contain trees, lawns, parks, courtyards, bare ground, and other surfaces mixed with rooftops and pavement. The land-cover product divides the ground into raster cells and assigns a representative class, so it is a generalized surface map rather than a parcel or building footprint map.
The coastal setting matters when reading the pattern. Developed land, open water, and wetland cover meet along several edges, making the transition between dense urban surface and water easy to see. That relationship can support broad environmental comparisons, but it does not by itself describe flood risk, shoreline ownership, zoning, or engineering conditions.
Small natural-cover patches stand out in the forest and farmland view
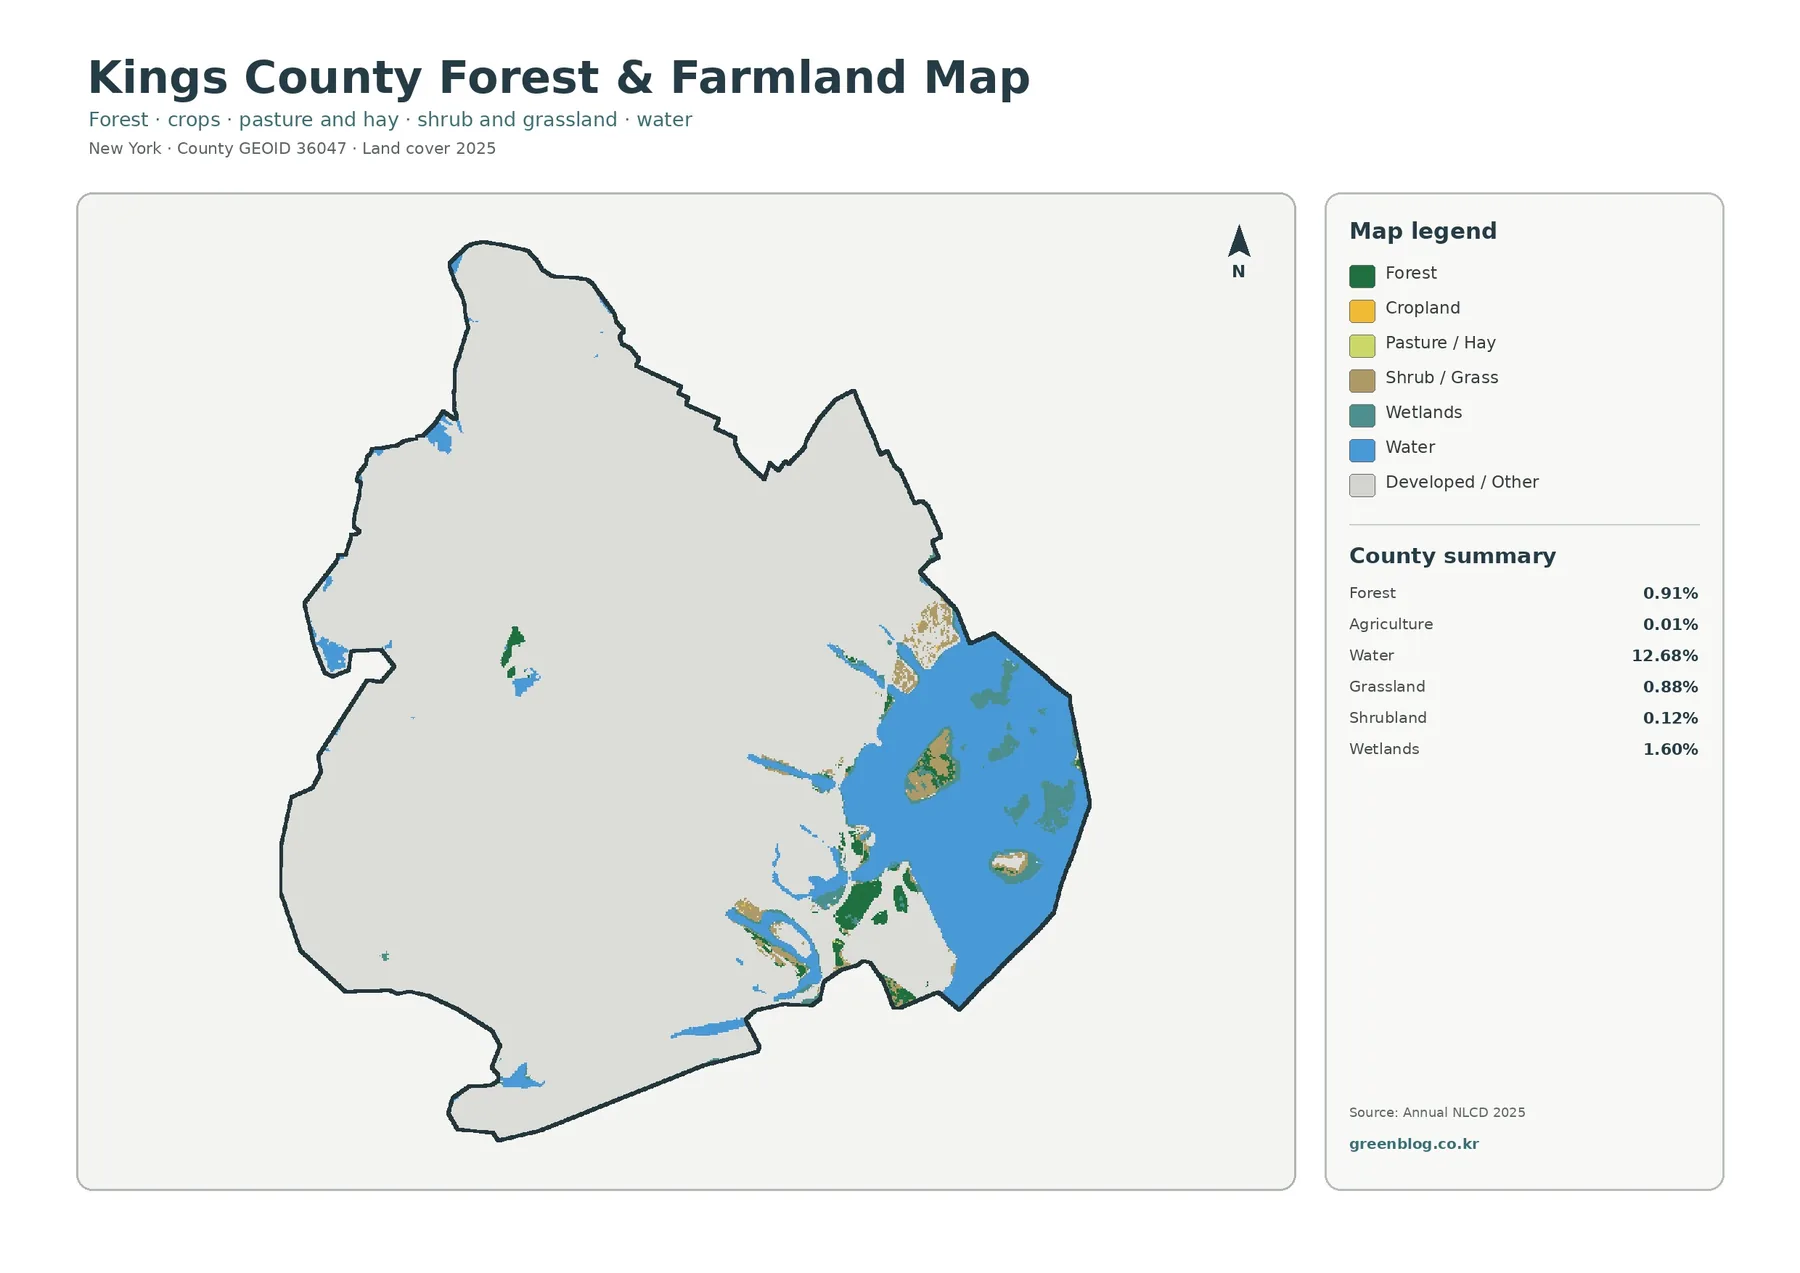
Removing most developed detail from the forest-and-farmland view makes the limited nonurban cover easier to locate. Forest accounts for 0.91%, grassland 0.88%, shrubland 0.12%, wetlands 1.60%, and agriculture only 0.01%. Most of the county therefore appears as developed or other cover, with scattered green and tan patches interrupting the gray field.
This map is more useful for locating remnants of vegetation and water than for studying farming. The agricultural share is effectively negligible at county scale. Small forest and grassland patches, by contrast, become easier to compare with adjacent water and wetland areas when the dominant developed class is visually muted.
Several vegetated areas sit close to water or along the southern and eastern portions of the county. Others appear as isolated pockets within developed surroundings. Their size and shape should still be interpreted cautiously because a raster cell can contain a mixture of trees, grass, buildings, and pavement while receiving only one final class.
Impervious surface shows how intensely the land is built over
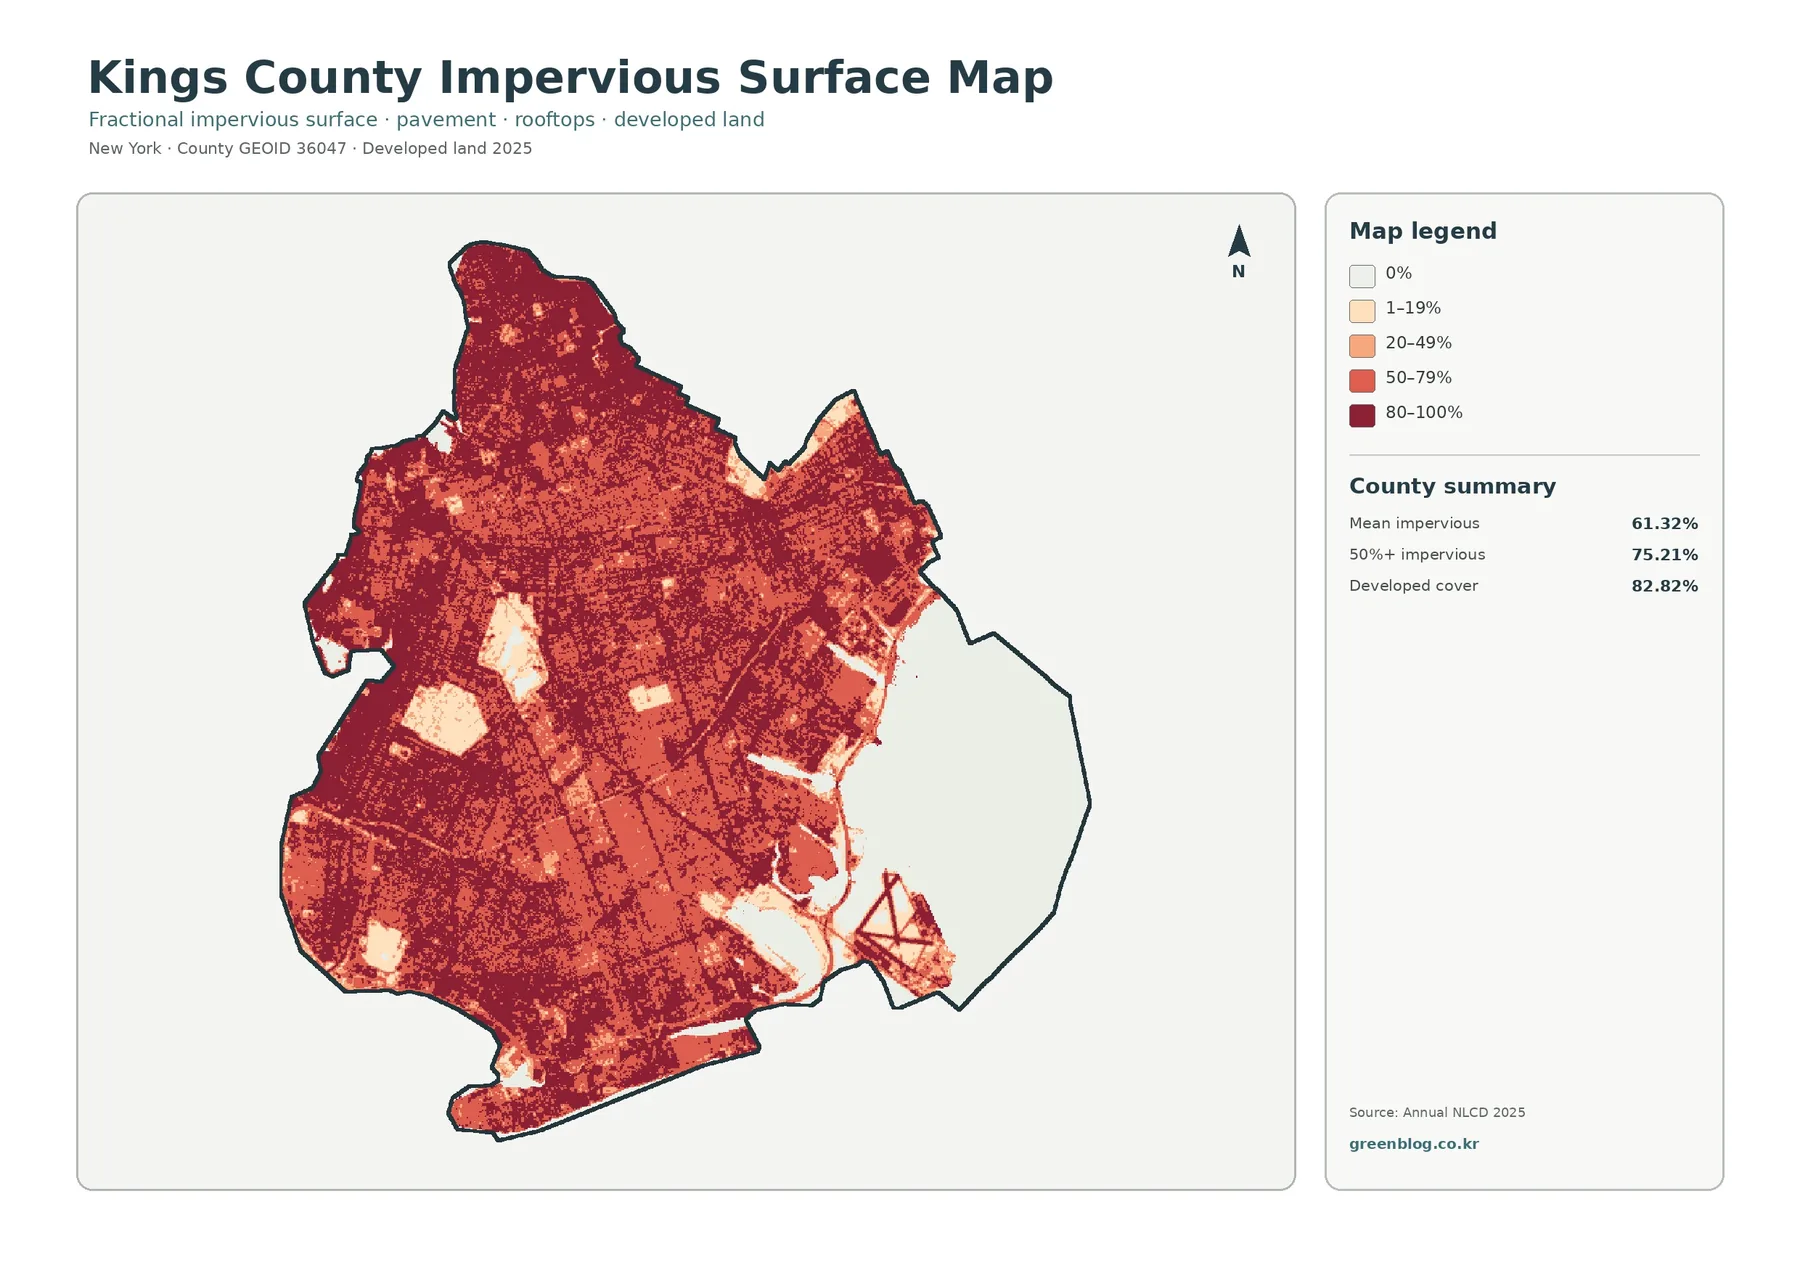
Impervious surface refers to pavement, rooftops, parking areas, and similar surfaces that do not readily absorb rainfall. Kings County has a mean impervious value of 61.32%, and 75.21% of the mapped area reaches at least 50% impervious cover. Those figures are unusually important here because the general land-cover map already identifies 82.82% of the county as developed.
Dark reds cover much of the land area, showing where cells contain high percentages of hard surface. The pattern is dense but not uniform. Larger pale or white areas interrupt the red field where parks, open spaces, water, or less-paved surfaces reduce the impervious percentage.
The graduated classes—1–19%, 20–49%, 50–79%, and 80–100%—add detail that the single developed color cannot provide. Two places can both be classified as developed while having very different shares of pavement and rooftops. That distinction is useful when comparing urban surface intensity across the county.
Imperviousness can be relevant to runoff and urban heat discussions, but the map is not a direct flood or temperature model. Drainage infrastructure, elevation, rainfall, vegetation, building form, and many other factors matter. The safest use is to treat it as a map of hard-surface concentration rather than as a prediction of environmental outcomes.
Mapped differences from 1985 to 2025
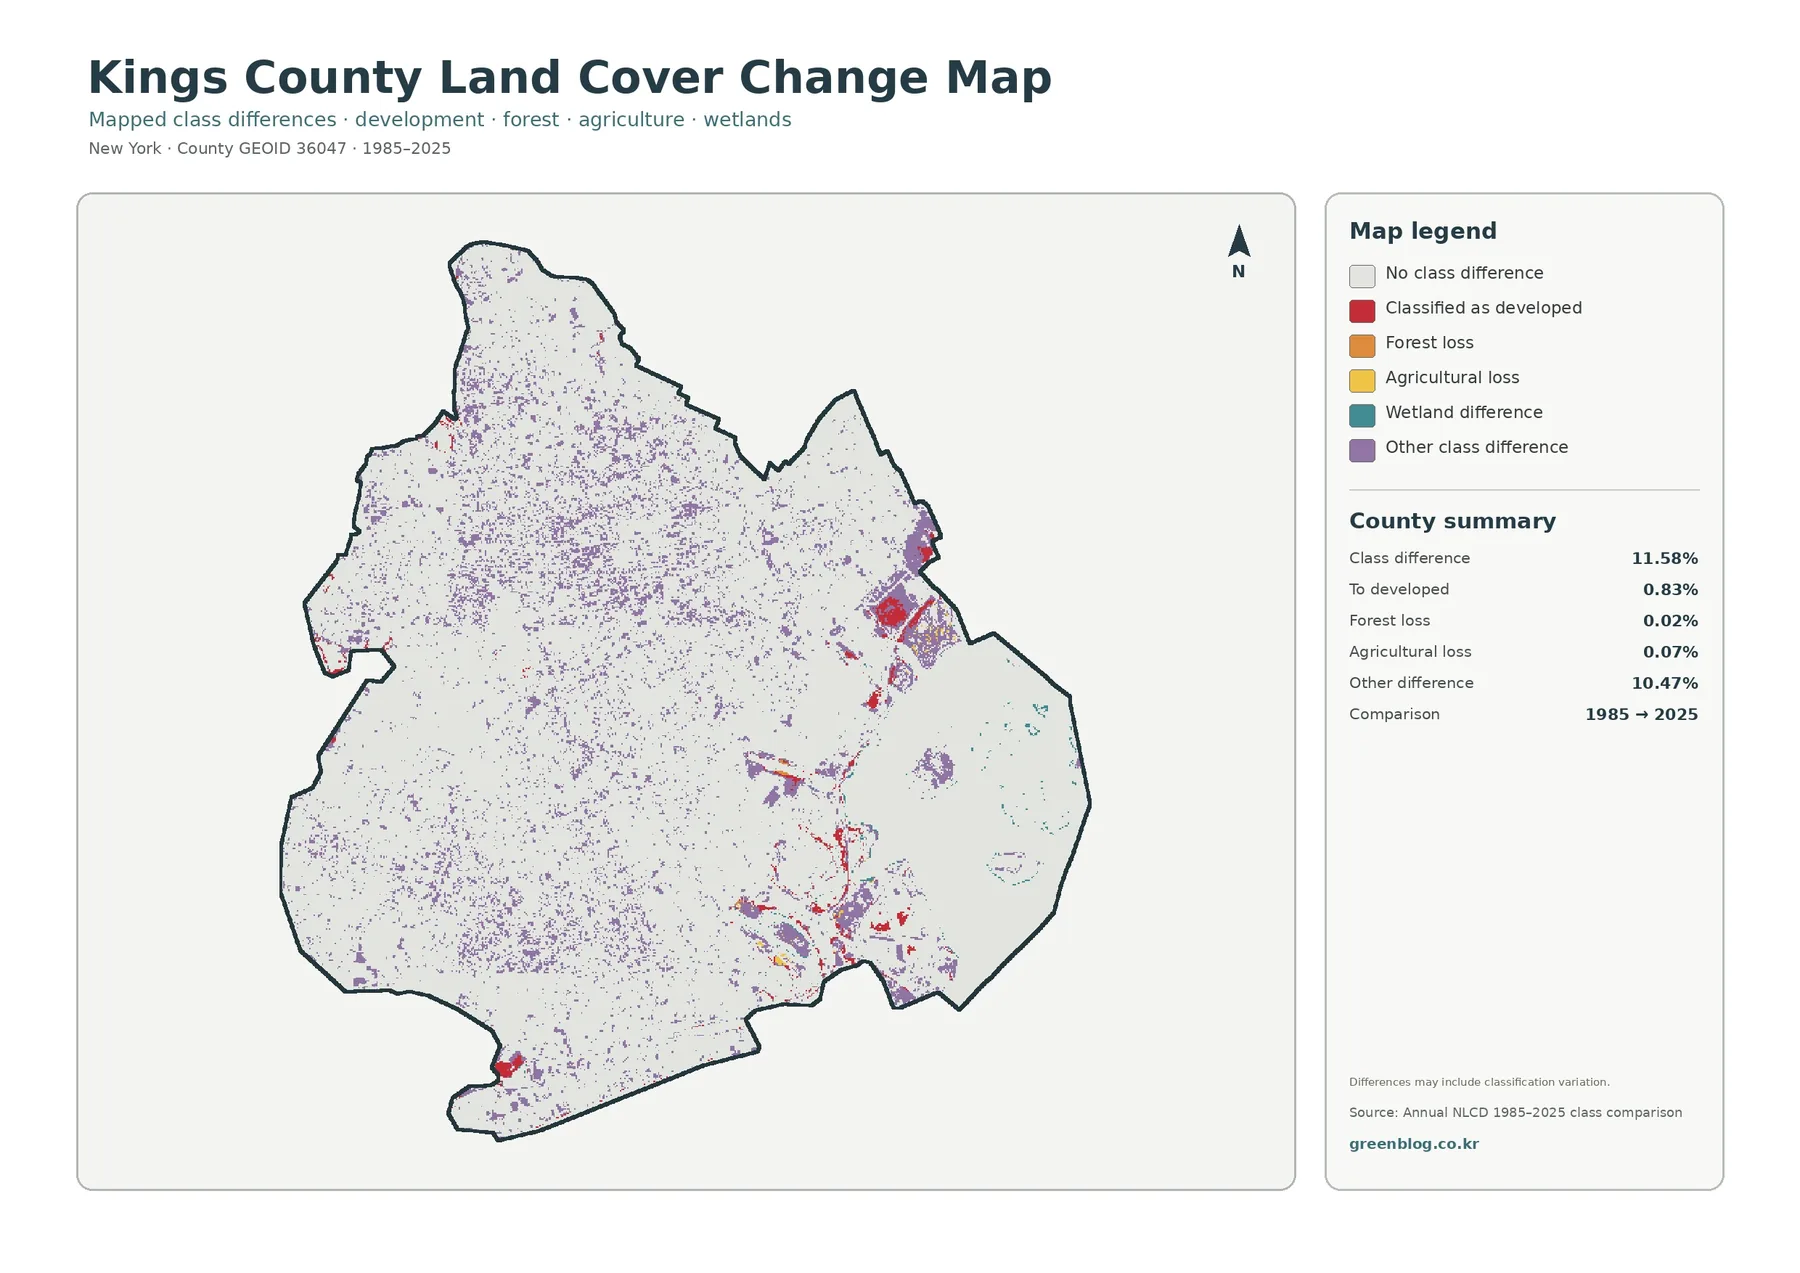
The change map reports class differences across 11.58% of the county between 1985 and 2025. Areas classified as developed account for 0.83% of the difference, forest loss for 0.02%, agricultural loss for 0.07%, and other class differences for 10.47%. Most of the county remains in the no-class-difference category.
Change colors appear as many small scattered points and patches rather than as one county-wide transformation. Some stronger red concentrations are visible in eastern and southern areas, while purple ‘other difference’ cells are spread much more broadly. That pattern fits a county that was already highly developed at the earlier comparison date.
A colored cell should not automatically be read as proof of a particular construction project or land-use decision. The map notes that differences may include classification variation. Small shifts can result from real surface change, mixed pixels, changes in source imagery, or differences in how a cell is classified between dates.
How the four maps work together
Start with the general land-cover map to establish the basic balance: overwhelmingly developed land, a large water share, and small pockets of natural cover. Next, use the impervious map to separate heavily paved and built surfaces from lower-intensity developed areas. This comparison is especially informative in a county where a single developed class covers most of the land.
The forest-and-farmland map then strips away much of the urban detail so that forest, grassland, shrubland, wetlands, and water are easier to locate. The change map adds the time dimension by identifying where classifications differ between 1985 and 2025. Taken together, the four views move from overall cover to urban intensity, remaining natural surfaces, and mapped change.
For teaching, the set can demonstrate why one map is not enough to describe an urban landscape. A place that looks uniformly developed in the first map may contain lower impervious percentages or nearby vegetated patches in the other views. For presentations or local comparisons, the shared county outline makes it easy to follow the same location from one map to the next.
Download the four original JPG maps
The downloadable ZIP contains the four original JPG files shown on this page: general land cover, forest and farmland, impervious surface and developed land, and the 1985–2025 class-difference map. The larger JPG files are better suited than the WebP previews for printing, slide decks, worksheets, and offline reference.
Limits to remember when using the data
Land-cover products generalize the ground into raster cells. Small trees, narrow streets, courtyards, roofs, or shoreline features may be mixed within a single cell even though the final layer assigns one representative class. Enlarging the image makes the pixels larger but does not turn the map into survey-grade detail.
The impervious-surface layer should be treated the same way. It estimates the fraction of hard surface inside each cell, not the legal boundary of a building or parcel. Parcel ownership, zoning, development rights, and construction permits require separate official records.
The 2025 land-cover map is a classified snapshot, not a live image of current conditions. The 1985–2025 map compares two classified periods and may include classification differences as well as real physical change. Detailed change analysis should therefore be checked against additional imagery or local records.
Frequently Asked Questions
What is the dominant land-cover class in Kings County?
Developed land is the dominant class at 82.82% in the supplied 2025 summary. Water is second at 12.68%, while forest, wetlands, barren land, grassland, shrubland, and agriculture each occupy much smaller shares.
How impervious is Kings County?
The mean impervious surface is 61.32%. In addition, 75.21% of the mapped area has at least 50% impervious cover, indicating that rooftops, pavement, and other hard surfaces occupy a large share of most land cells.
What is included in the map download?
The ZIP includes four original JPG maps: general land cover, forest and farmland, impervious surface and developed land, and mapped land-cover differences from 1985 to 2025. The WebP images in the article are optimized for on-page preview.
Map File Information
Kings County Land Cover Map Files
- Included Files: Use only the versions confirmed in the article and supplied images
- File Type: Use the confirmed download contents
- Intended Use: Printing, education, presentations, and map-based projects
Related Maps
- Albany County Land Cover Map
- Allegany County New York Land Cover Map
- Bronx County New York Land Cover Map
Sources and reference data
The map set uses Annual NLCD land-cover information and U.S. Census geographic boundary data. The official sources below provide access to the datasets, classification definitions, and county boundary files used for this type of map.
- MRLC Annual NLCD Data
- USGS Annual NLCD Land Cover Classification
- U.S. Census Bureau TIGER/Line Shapefiles
Green Map creates custom-edited map images using open geographic data sources such as geoBoundaries, Natural Earth, OpenStreetMap, and government open data.
These maps are edited visual materials, not raw data files, and are provided for education, documents, presentations, and graphic reference.