Download the high-resolution A3 JPG ZIP for the Haywood County Tennessee Map directly from this page; it contains the county, city, water, and elevation maps shown below. Brownsville is the county seat and main road hub, while Stanton provides a second city reference in the southwest. Hatchie River bends across the southern-central part of the county, and the elevation layer shows a broad low river corridor surrounded by higher rolling ground in the northwest, east, and parts of the south.
The county becomes easier to understand once Brownsville and the Hatchie corridor are treated as two different anchors. Roads converge around Brownsville, but water and terrain organize the southern half in another way. North of the river, rolling ground surrounds the county seat and its tributaries; south of it, low flats around Stanton and Dancyville are interrupted by short uplands. That contrast gives Haywood County a more varied surface than the simple road map suggests.
Table of Contents
Brownsville and Stanton show the difference between the county center and the southwest
The city map ranks two places. Brownsville is shown at 9,622 residents, while Stanton is shown at 704. Brownsville lies near the center and serves as the county seat; Stanton is much farther southwest, close to the outer edge of the county. Their size difference is obvious, but their positions are more useful for map reading because they anchor two distinct parts of Haywood County.
The base map adds Dancyville and Fredonia near the southern boundary. Brownsville also has a labeled police department near the central road network. These extra place names help show that the county extends well beyond the two ranked city points and that the southern and southwestern areas have their own road and creek patterns.
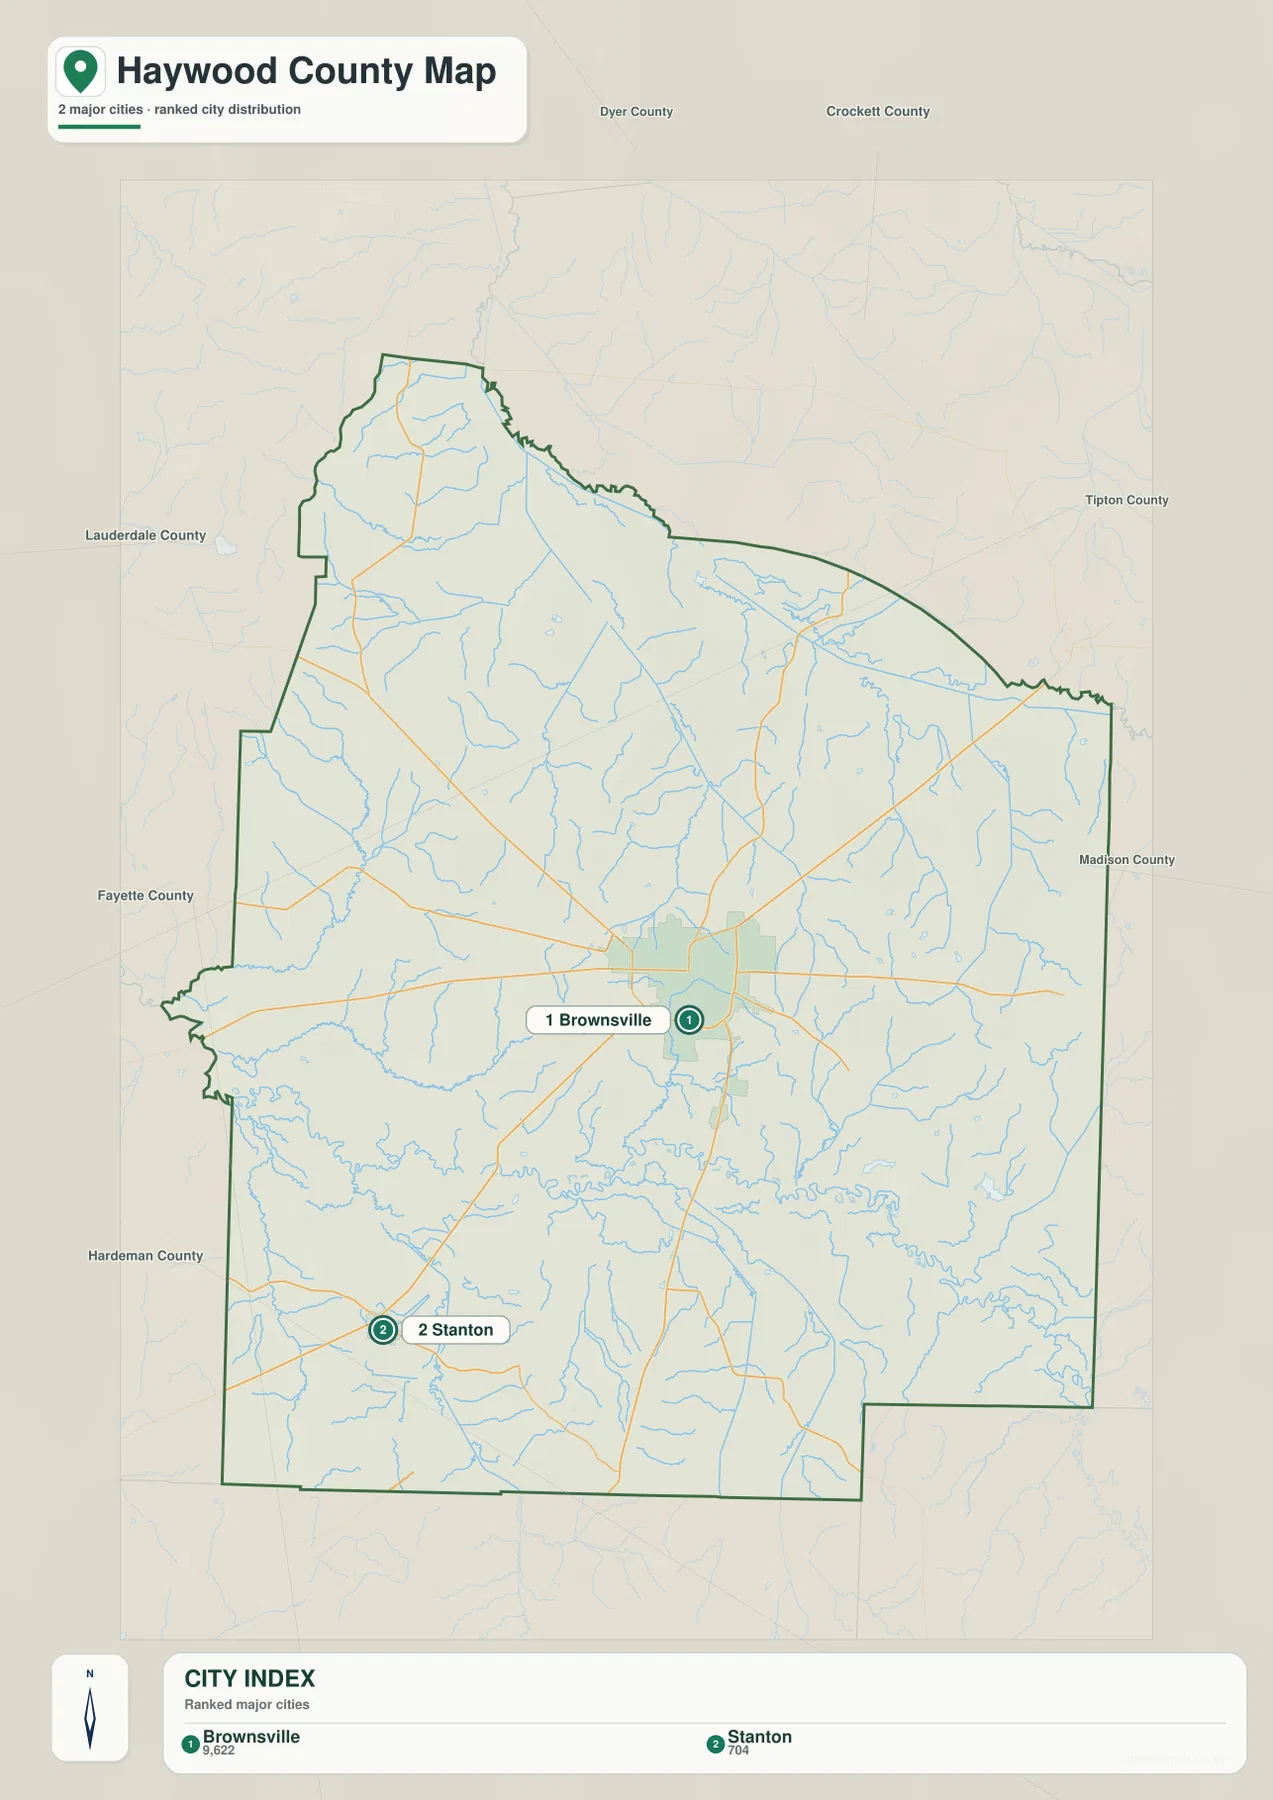
Dyer, Crockett, Tipton, Madison, Hardeman, Fayette, and Lauderdale counties appear around the outside of the city map. Stanton is a useful reference toward the Fayette–Hardeman side, while Brownsville sits farther inside the county. On the north and east, the map contains fewer ranked-city labels, so the surrounding county names, roads, and drainage lines become more important for orientation.
Roads radiate from Brownsville, then spread through the rural outer county
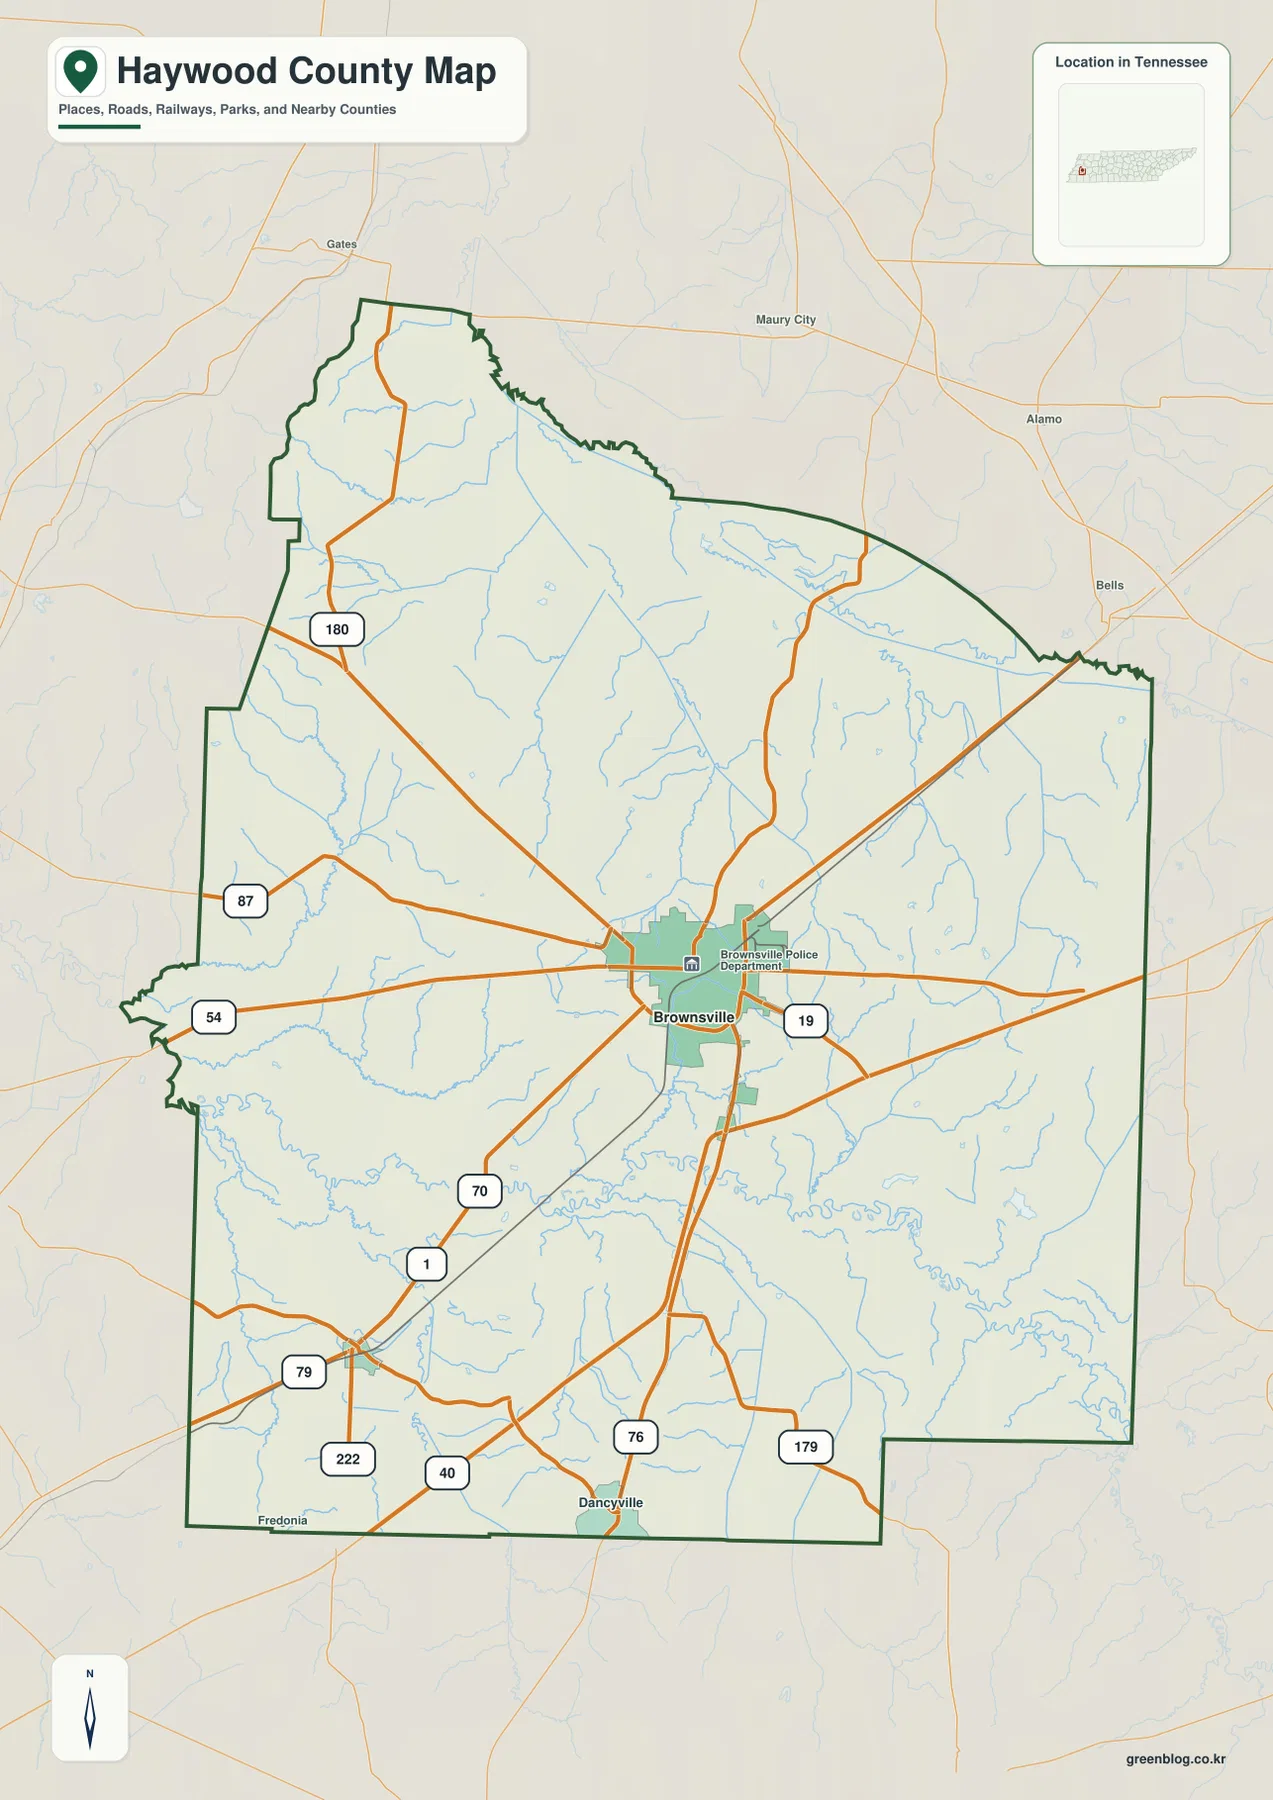
Route 54 is one of the clearest east–west lines through Brownsville. Routes 70 and 1 approach from the southwest, and Route 19 is visible on the eastern and southern side of the Brownsville area. In the northwest, Routes 180 and 87 provide outer references, while Routes 79, 222, and 40 help identify the southwestern road pattern.
Route 76 passes near Dancyville, and Route 179 reaches the southeastern side. Grouping the roads by destination keeps the map readable: Routes 54 and 87 are useful west of Brownsville, Routes 70, 79, and 222 help with the Stanton side, and Routes 40, 76, and 179 are better references for the southern edge.
The northern half has fewer large settlement labels, so long road segments and creeks carry more of the orientation. Route 180 runs through the northwestern interior toward the Gates side outside the county, while roads beyond the northeastern edge continue toward Maury City, Alamo, and Bells. The contrast between the dense Brownsville junction and the more widely spaced outer routes is one of the clearest features of the base map.
Hatchie River crosses the south while Forked Deer drainage occupies the northeast
Hatchie River is the strongest water feature on the map. It enters from the west and winds across the southern-central county before continuing east. Cypress Creek and Lagoon Creek reach the river from the western side, and the surrounding lowland forms a broad green band on the elevation map. This river corridor is much flatter than several of the upland areas around it.
South Fork Forked Deer River follows the northeastern side, giving that part of the county a different drainage reference. Nixon Creek runs from the north toward the central interior, while Mud Creek forms another eastern low corridor. Cannon Lake and Duffy Lake sit close together in the north-central area and are useful landmarks when matching the water layer to the road map.
Near the eastern stretch of Hatchie River, Shaw Lake and Powell Lake lie close to the main river. Massey Lake and Brickyard Pond are farther north, Coffee Lake lies south of the river near the central part of the county, and Bear Creek approaches the Hatchie lowland from the south. Starting with the river and then adding these named waters makes the drainage pattern far easier to follow than reading every tributary independently.
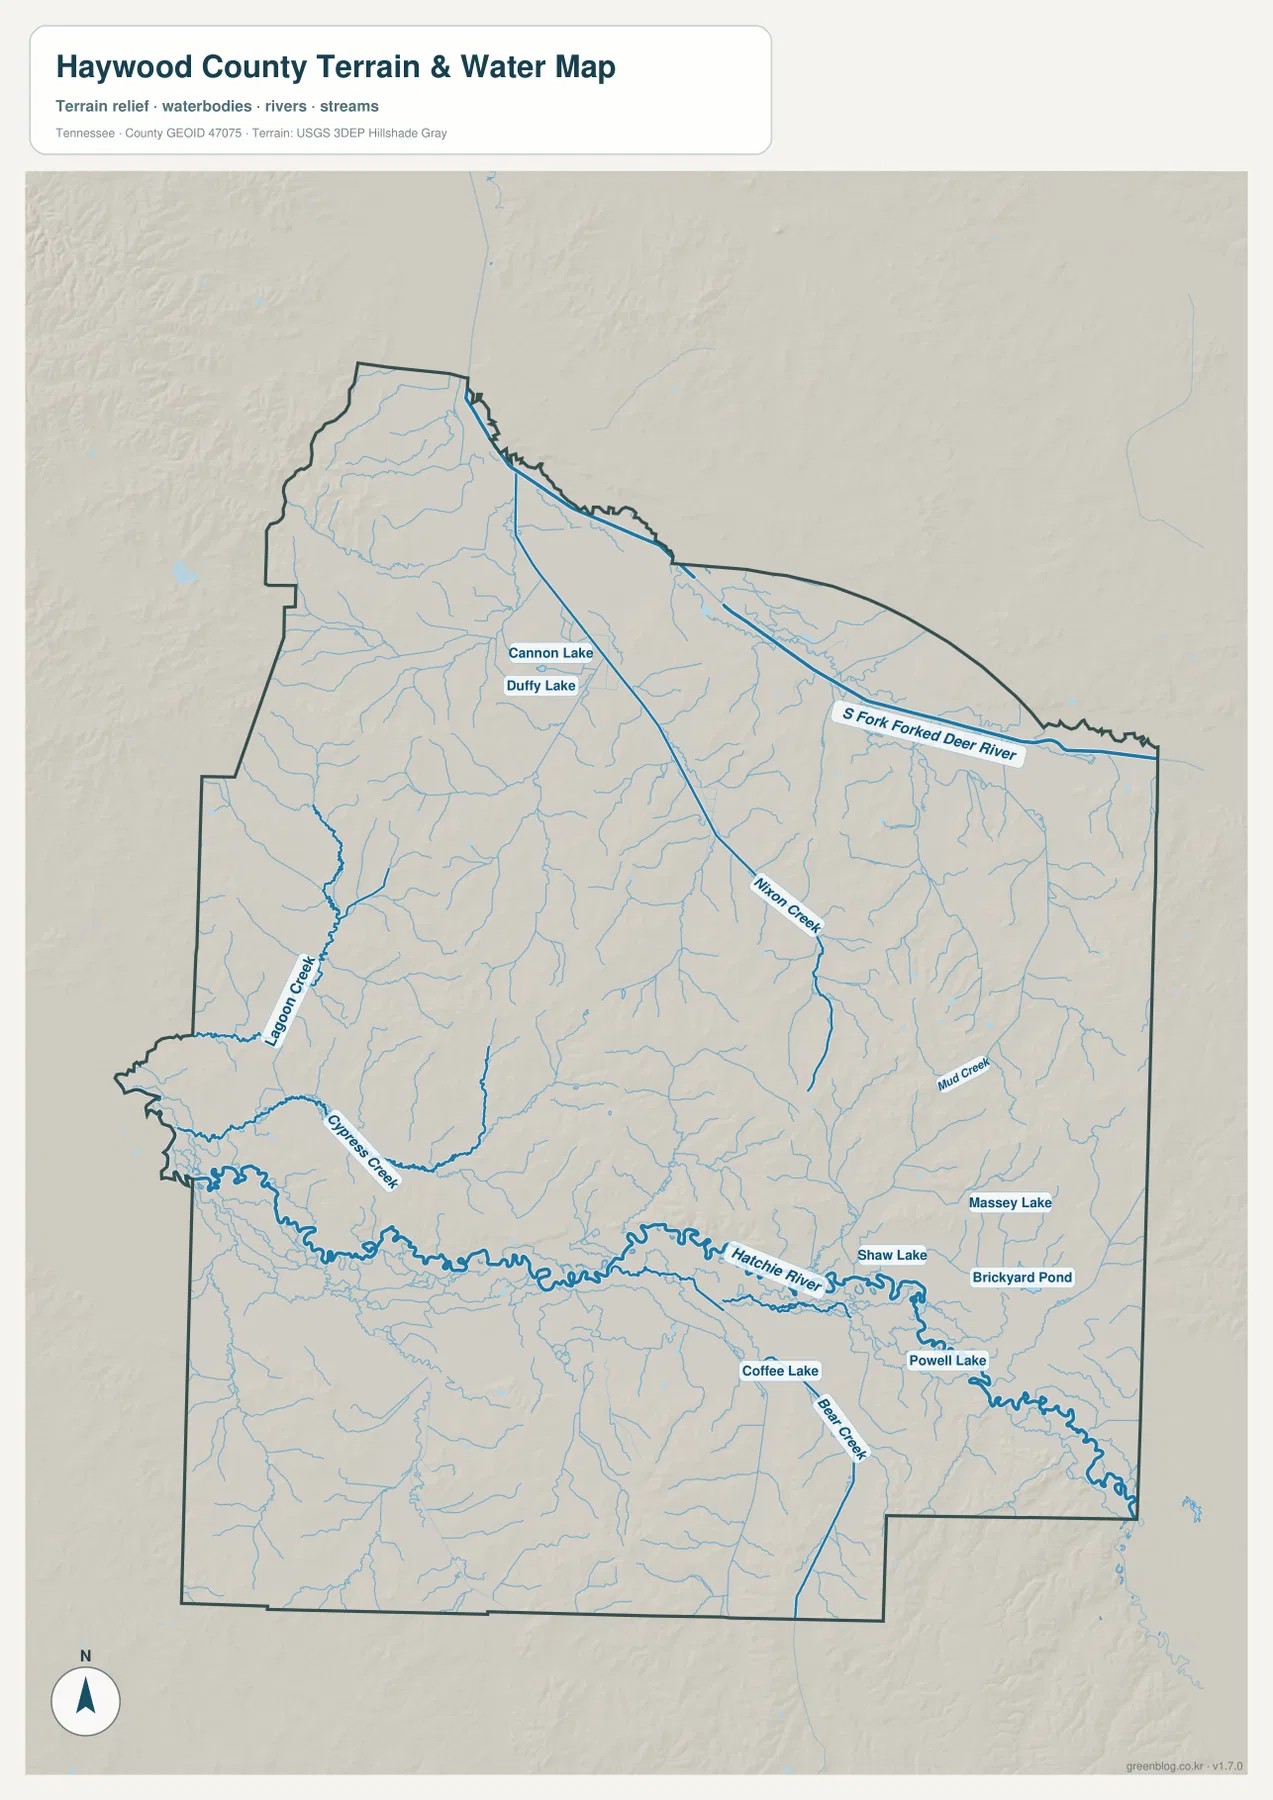
This water image is best used to locate the river corridor and its connected creeks relative to Brownsville, Stanton, and the main roads. It is not a live flood or navigation product, so changing water levels, crossing conditions, and parcel-scale boundaries require current information from the appropriate agencies. For this page, the useful question is where the major low corridors sit within the county.
A 79–151 m range reveals broad lowland around Hatchie River and higher rolling edges
The elevation map shows an actual range of about 79 to 151 meters, with a mean near 101 meters. The broadest dark-green lowland follows Hatchie River from west to east. Another relatively low area extends through the north-central county, while tan and brown uplands become more noticeable in the northwest, the east, and several southern pockets.
The northwestern corner contains closely spaced short ridges and drainage cuts. Around the Route 180 side, those higher surfaces descend toward the broad central lowland. Eastern Haywood County also has scattered rolling uplands, but elevations drop again where tributaries approach the Hatchie corridor.
The south is mixed rather than uniformly flat. Stanton and Dancyville are close to broad lower ground, yet higher patches rise nearby and farther east. Bear Creek and other small streams use the lower spaces between those uplands. The most accurate visual summary is a wide Hatchie River lowland with rolling terrain around its edges, not a county that steadily rises in only one direction.
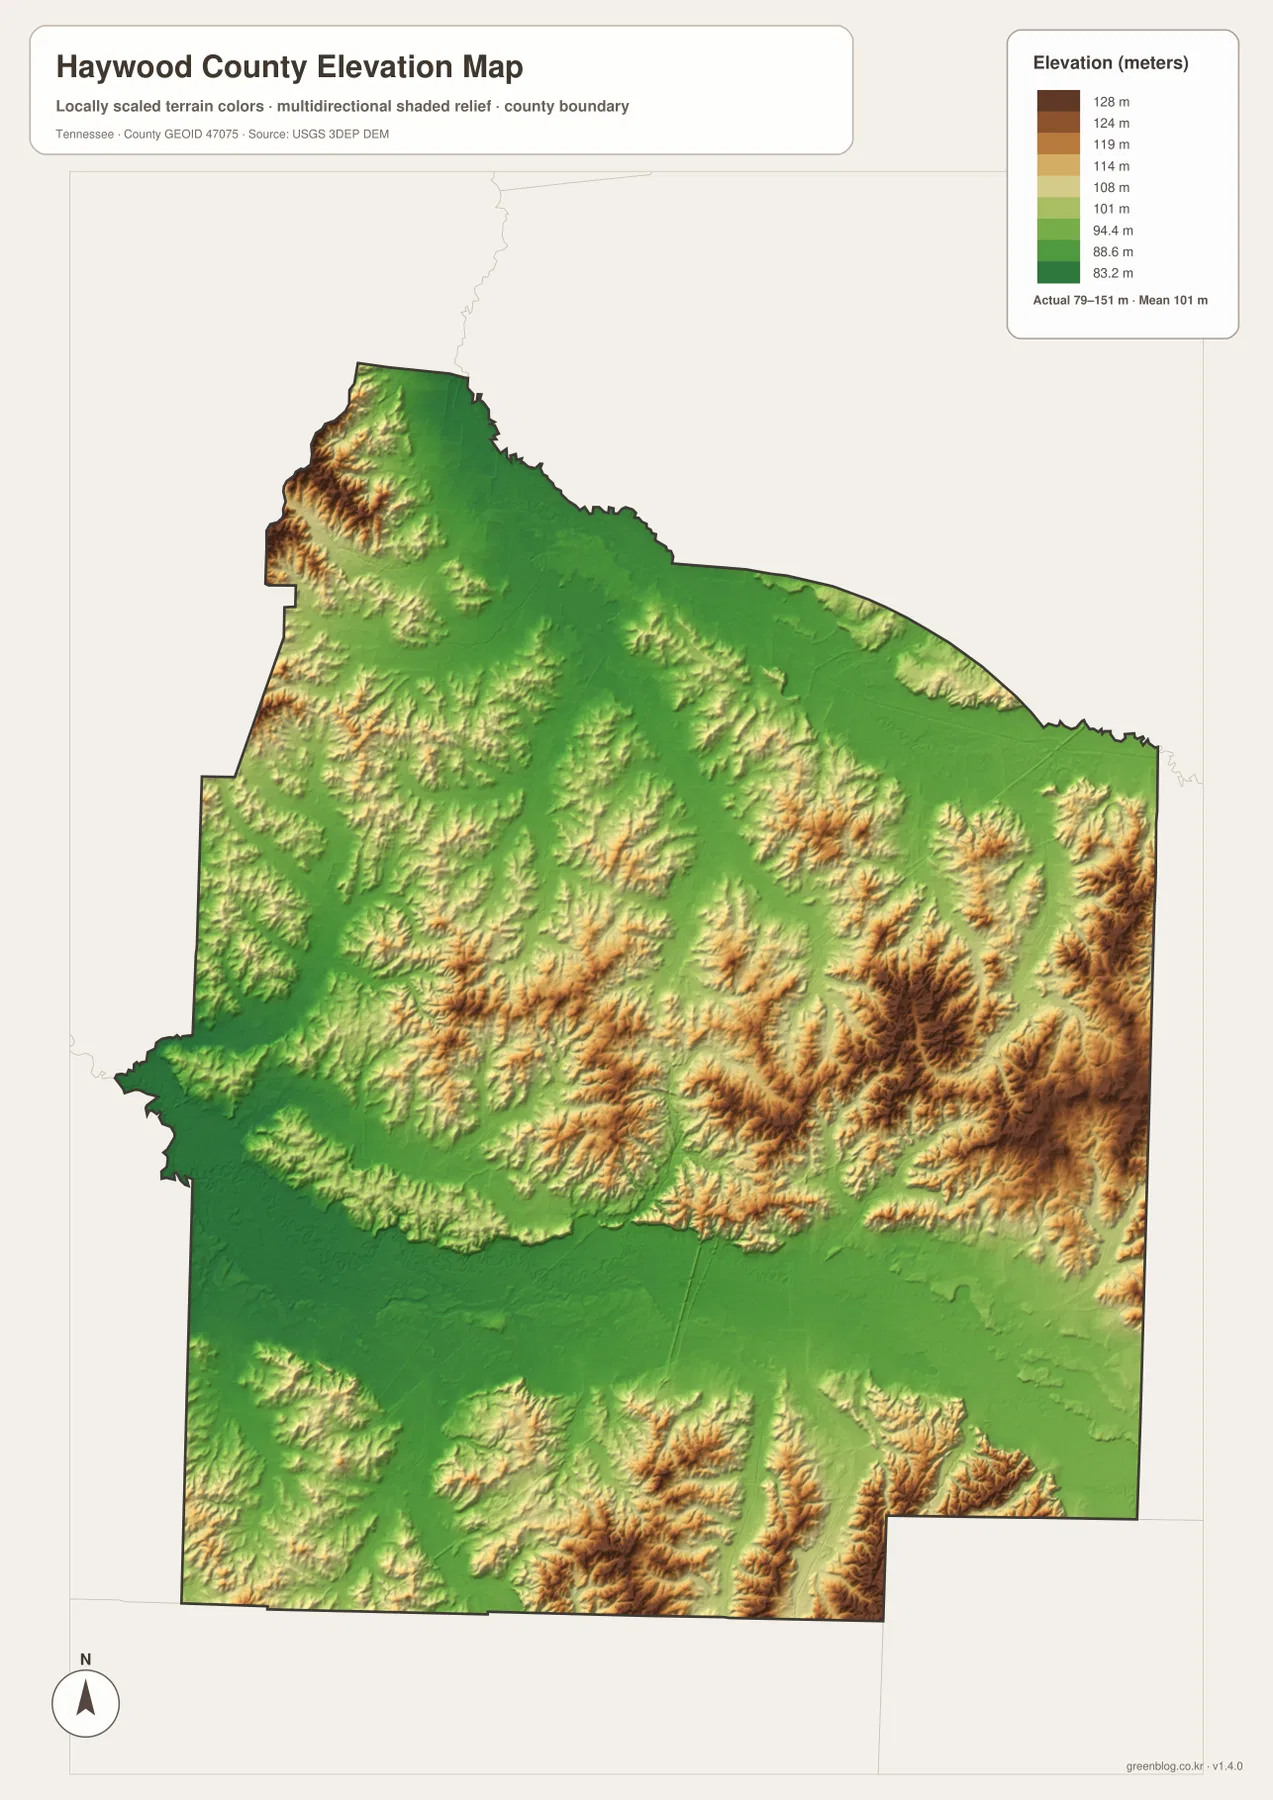
The terrain colors are meant for countywide comparison rather than exact elevation at a house or parcel. They are especially useful beside the water layer: the broad green Hatchie corridor matches the main river valley, while smaller green cuts correspond to tributaries such as Nixon Creek and Bear Creek. That comparison explains more about local relief than a single minimum or maximum number by itself.
Brownsville and Hatchie River provide two complementary ways to read Haywood County
The city map emphasizes Brownsville and Stanton, while the county map shows Brownsville as the point where several routes meet. The water layer shifts attention south to the Hatchie River, which crosses the county as a broad natural corridor. Together, those maps separate the human center from the river lowland instead of forcing every feature to revolve around one point.
The elevation layer adds a third piece. Low terrain spreads along the Hatchie, while the northwest and east contain more rolling ground. That difference helps explain why a road approaching Brownsville from the Stanton side passes through a different landscape from Route 180 in the northwestern interior. It also makes the county’s rural outer areas easier to understand when place labels are sparse.
Choose the city map when the question is simply Brownsville versus Stanton. Use the county map for route numbers and outer place names such as Dancyville or Fredonia. The water map is the best choice for Hatchie River, the Forked Deer side, and named lakes, while the elevation map shows where the broad lowlands give way to higher rolling terrain.
The WebP images on the page are convenient for quick browsing, but the JPG originals are better when route numbers, small creek names, or terrain shading need to remain clear at a larger size. A road-focused worksheet can use the county map, while a river-focused page can keep Hatchie River and the named lakes on the water layer without crowding the road labels.
The elevation image benefits from color printing because the 79–151 meter range is expressed through the transition from low green river flats to higher tan and brown uplands. The city layer stays intentionally simple, making it useful when a presentation needs only the two ranked city references rather than the full road and drainage network.
The ZIP below contains the high-resolution A3 JPG originals for the county, city, water, and elevation maps used in this article. It is the better choice for printing, close inspection, or offline use when the browser previews do not provide enough room for the smaller Haywood County labels.
Frequently Asked Questions
How do Brownsville and Stanton differ on the map?
Brownsville is the county seat near the center and is labeled at 9,622 residents. Stanton is much smaller at 704 and lies in the southwest. Using both points makes it easy to distinguish the county’s central road hub from its southwestern settlement area.
What does the elevation map show around Hatchie River?
The broad Hatchie corridor is one of the lowest parts of the county. The elevation layer shows about 79–151 meters overall, with higher rolling terrain around the northwest, east, and parts of the south, so the river valley stands out clearly against its surroundings.
Sources and reference data
County boundaries and general location can be compared with U.S. Census Bureau TIGER/Line. Local history and county reference material are available from the Tennessee State Library and Archives Haywood County fact sheet, and the road pattern can be checked against the Tennessee Department of Transportation Haywood County map.
For broader hydrography reference, see USGS National Hydrography. Elevation data can be compared with the USGS 3D Elevation Program. The discussion here stays with the Brownsville–Stanton city pattern, the mapped road network, Hatchie River and its tributaries, and the relief visible in the supplied Haywood County images.
Map File Information
The archive contains the A3 high-resolution JPG originals for the Haywood County county, city, water, and elevation maps shown on this page.
- Included Files: County map, city map, water map, elevation map
- File Type: ZIP containing 4 JPG files
Related Maps
- Alamo to Gadsden: A Crockett County Tennessee Map
- Altamont, Monteagle, and Plateau Valleys — Grundy County Tennessee Map
- Around Chattanooga: Hamilton County Tennessee Map
Green Map creates custom-edited map images using open geographic data sources such as geoBoundaries, Natural Earth, OpenStreetMap, and government open data. These maps are edited visual materials, not raw data files, and are provided for education, documents, presentations, and graphic reference.