You can download four high-resolution JPG maps of Stewart County in one ZIP from this page: a county-and-roads map, a city distribution map, a water map, and an elevation map. Together they show a county organized around Lumpkin and Richland, a low western edge along the Chattahoochee River, and a much more broken landscape of hills and creek valleys toward the interior and east. The maps are designed as county-scale references, so they are useful for orientation, classroom work, local research, and presentation graphics rather than parcel, flood, engineering, or navigation decisions.
Stewart County sits in west-central Georgia, and the four views make its geography easier to understand than a single boundary outline can. Lumpkin is the county seat and an important road junction inside the county. Richland is farther east and is the larger of the two major cities in the city index shown on the supplied map. West of the interior hills, the Chattahoochee River forms the dominant water feature, while Hannahatchee Creek, Hodchodkee Creek, Patula Creek, and many smaller streams cut across the county toward lower ground. The elevation surface then explains why those waterways follow such deeply incised corridors.
Table of Contents
Lumpkin as the road reference point
The county map makes Lumpkin the easiest place to use as an anchor. It lies slightly south of the county’s middle and is identified as the county seat in the supplied article and metadata. Routes labeled 1 and 27 run through the southern half of the county, while 39C crosses the Lumpkin area. Farther east, Richland sits close to routes 280 and 520. Route 39 and route 208 appear on the western side. The purpose is not to reproduce every local street; instead, the map shows enough of the larger road pattern to explain how the two cities connect with different parts of the county.
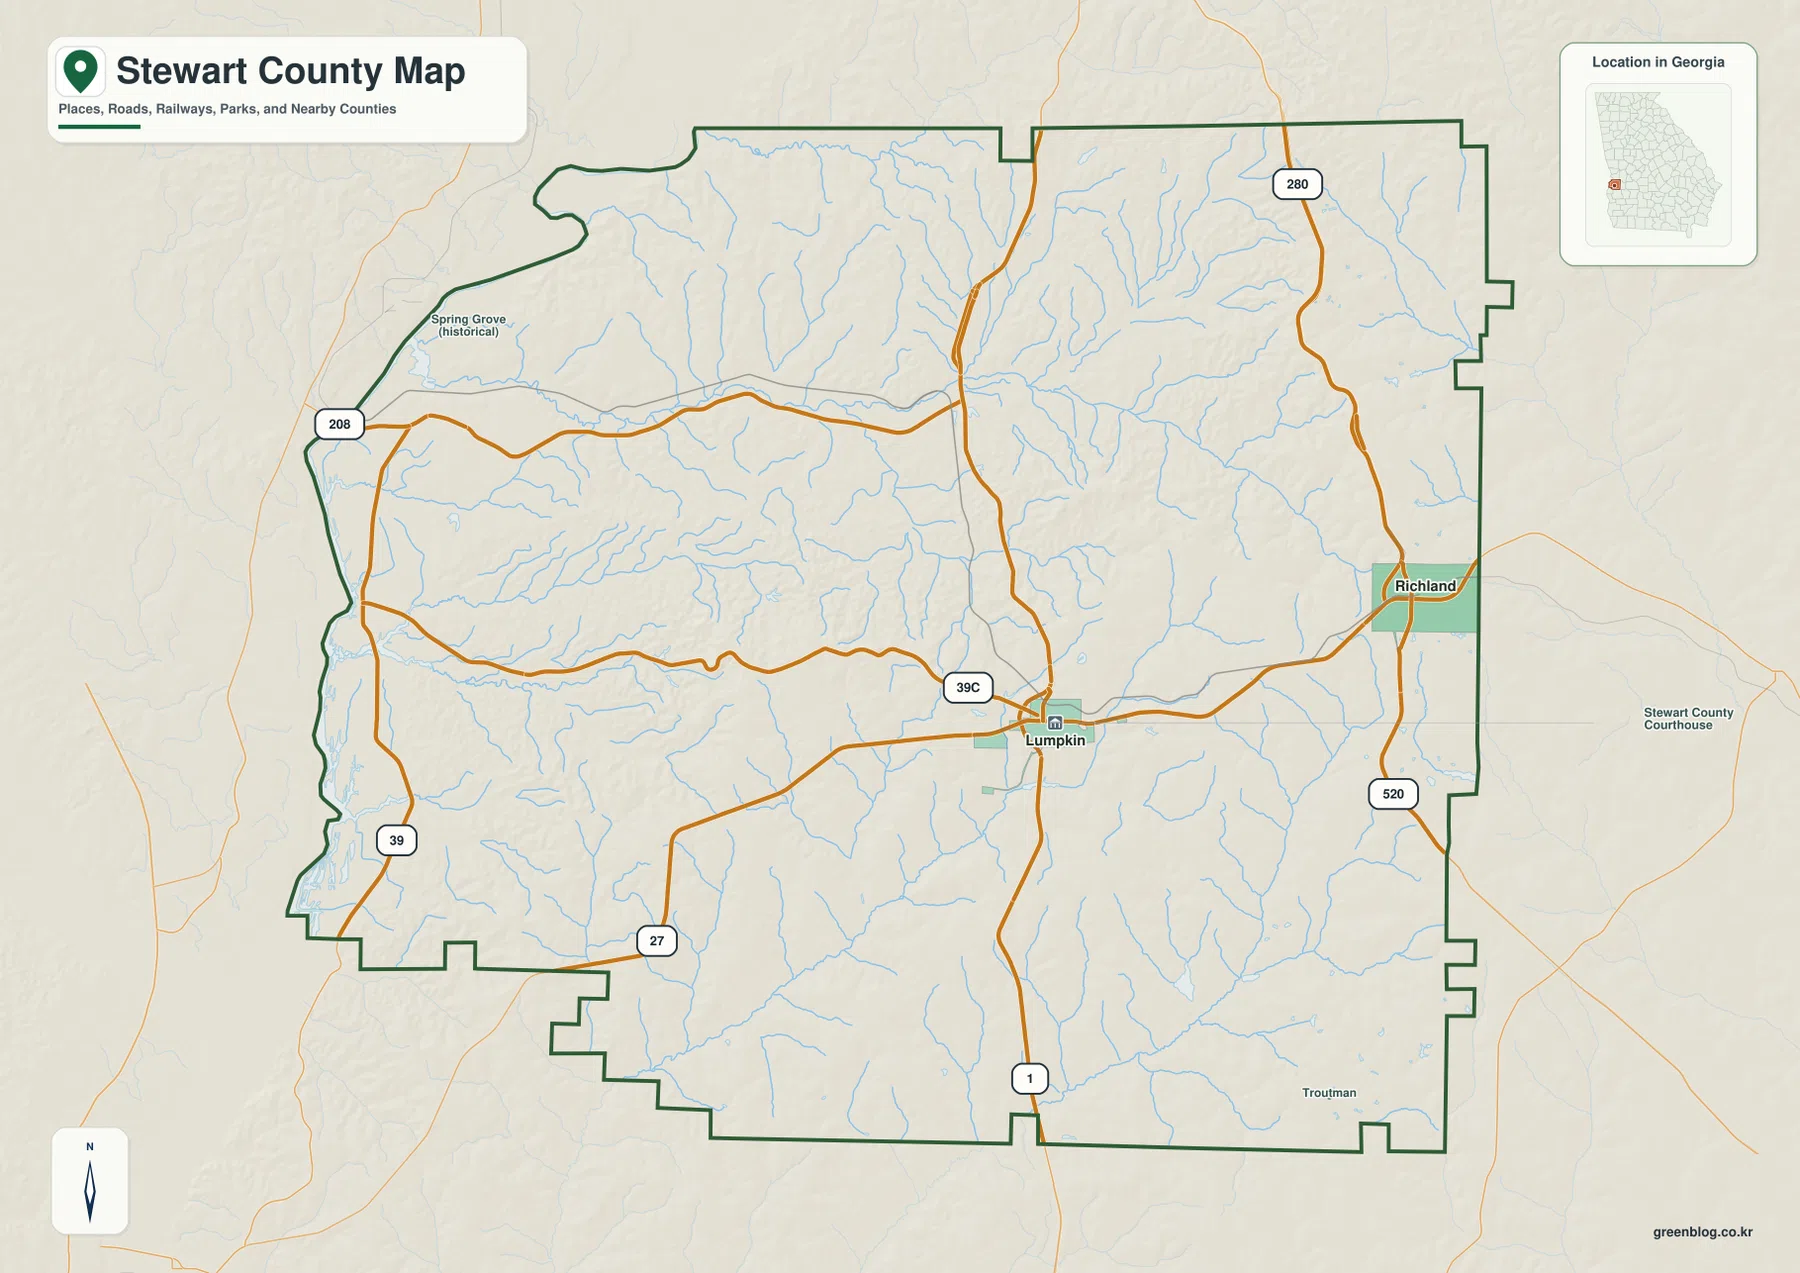
The boundary itself becomes more informative when it is compared with the water map. The western edge is irregular and closely associated with the Chattahoochee River corridor, while the eastern side reaches toward Richland and the larger road network there. This contrast matters because the county is not arranged around one simple east–west line. Lumpkin functions as an interior junction, Richland provides a second urban point to the east, and the road pattern branches around the ridges and drainage corridors that become clearer on the terrain maps.
What the two-city map adds
The city distribution map deliberately keeps the urban picture simple. Its city index lists Richland first at 1,595 and Lumpkin second at 1,000. Those values should be read as the figures used by the supplied map, not as a substitute for checking the latest population estimate. The U.S. Census Bureau link in the sources section is the better place to verify current statistics. What the map does very well is show the relative position of the two main cities without burying them under dozens of minor place labels.
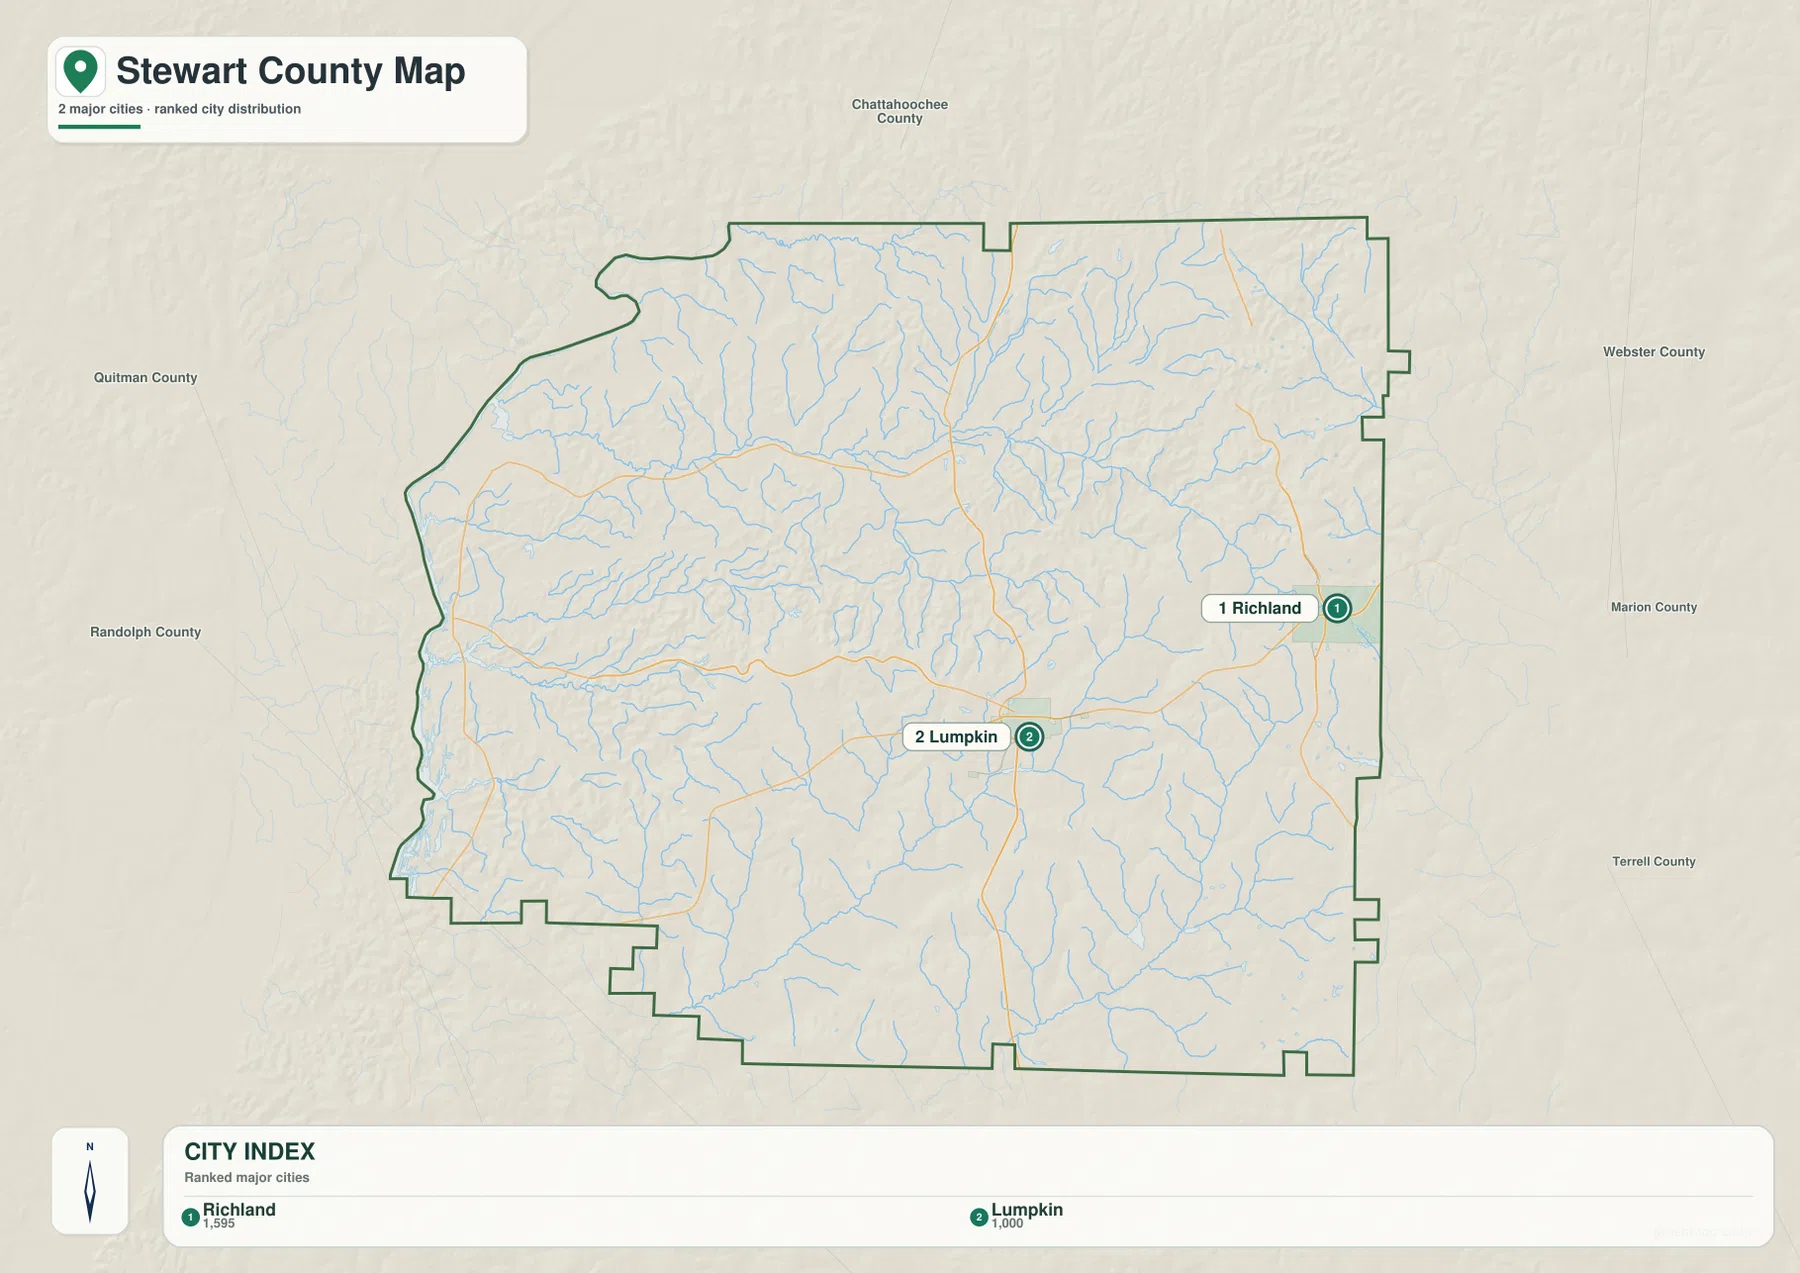
Administrative importance and the city index are not the same thing here. Lumpkin remains the county seat even though Richland has the larger value on the city map. That distinction is useful for readers who might otherwise assume that the largest labeled city must also hold the courthouse and county government. On the county map, Lumpkin’s central road connections reinforce its administrative role, while Richland’s eastern position ties it more directly to routes 280 and 520.
The Chattahoochee River and a network of creeks
The water map changes the visual emphasis completely. The Chattahoochee River dominates the western edge, and several named streams cross the county toward lower ground. Hannahatchee Creek is one of the clearest, extending across the central part of the map before reaching the west. Grass Creek and Turner Creek drain the west-central area. Farther south, Hodchodkee Creek and Patula Creek define separate drainage corridors, while Lime Sinker Creek appears in the northeast. These streams are accompanied by many smaller tributaries, which explains the dense branching pattern visible across the map.
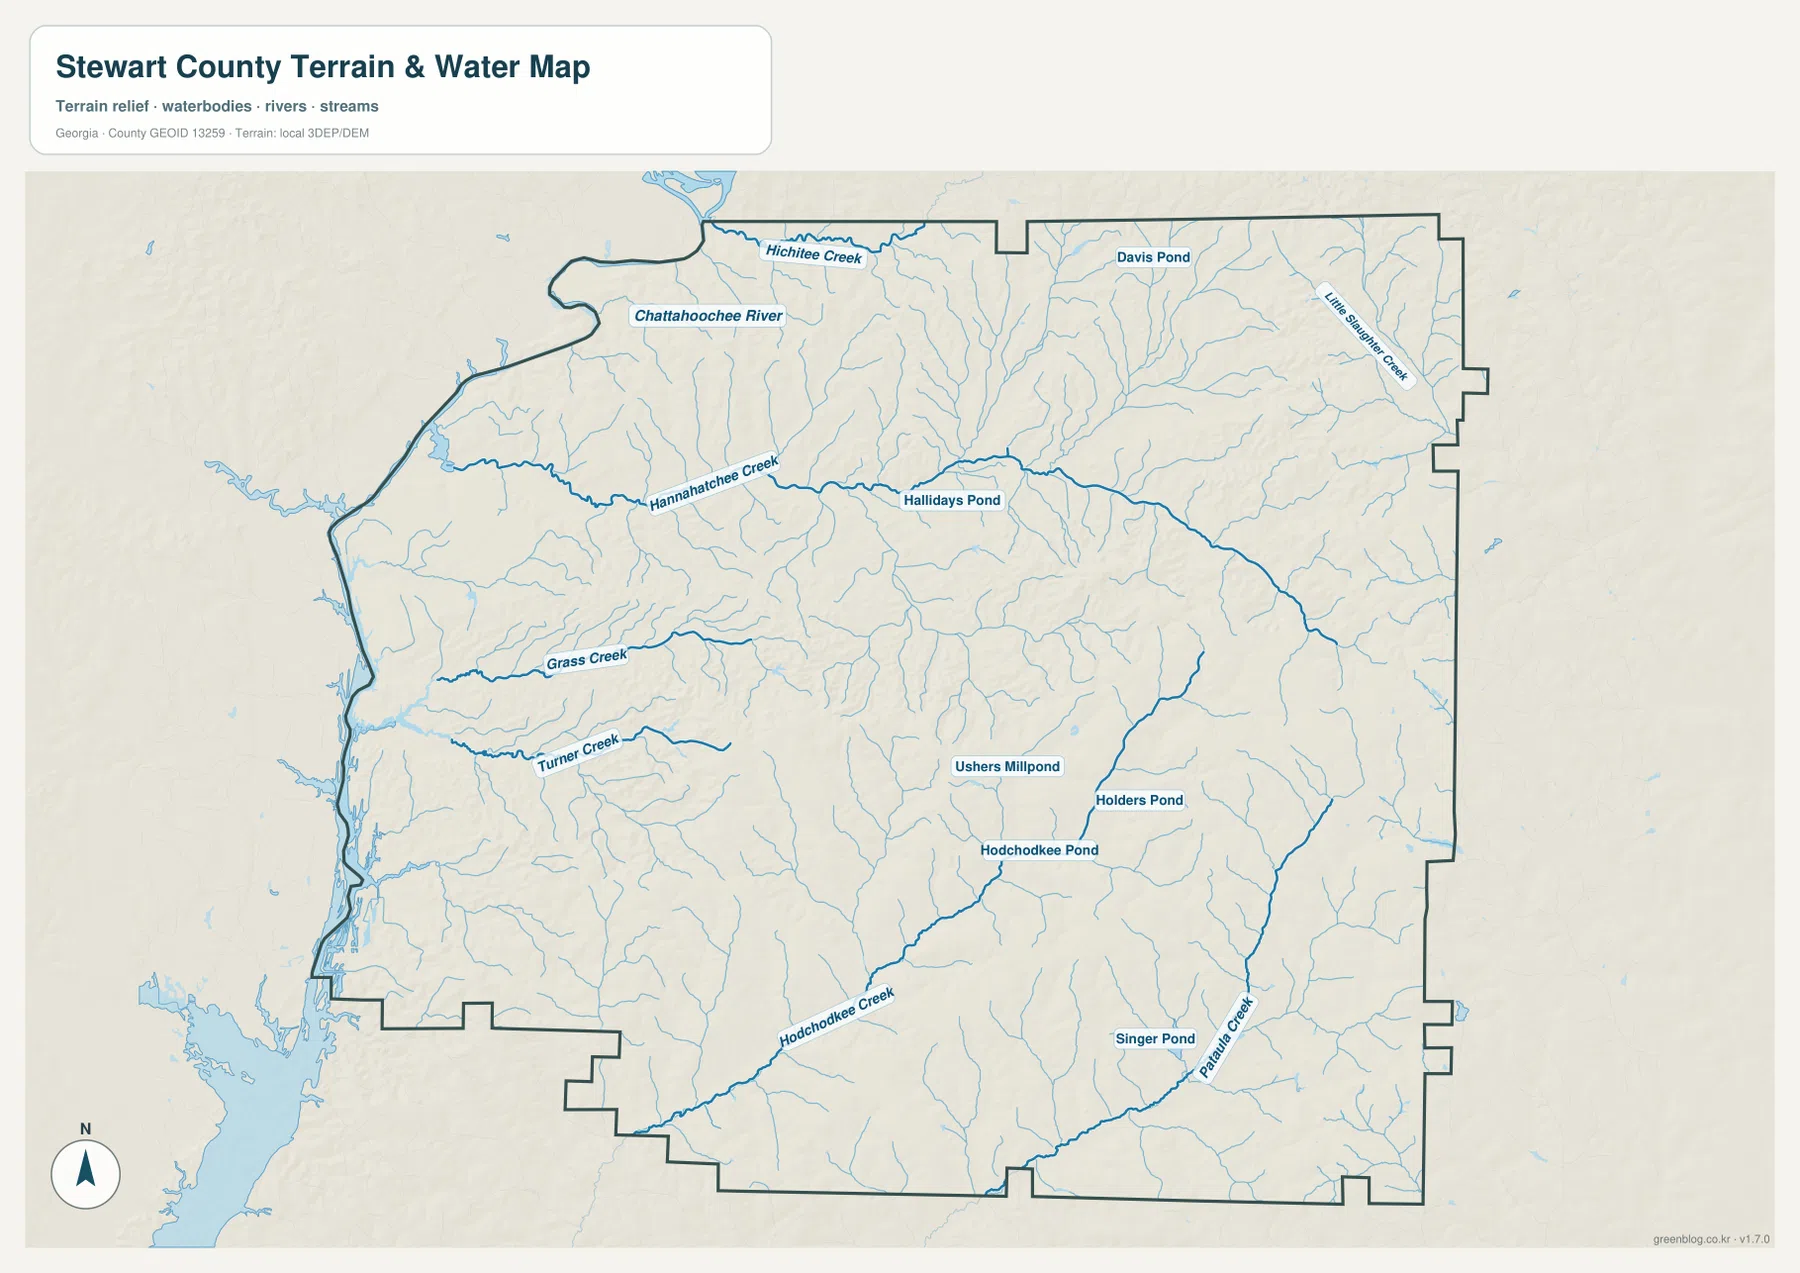
Several ponds and millponds help locate the smaller drainage systems. Davis Pond and Hallidays Pond are visible in the northern and central portions of the county, while Ushers Millpond, Holders Pond, and Hodchodkee Pond cluster around southern interior tributaries. Singer Pond appears near Patula Creek. The map should not be treated as a flood-zone, boating, fishing-access, or property-rights product. It identifies water features at county scale; legal access and current conditions require a different source.
Why the west is low and the east is hillier
The elevation map provides the clearest explanation for the creek pattern. The supplied surface reports an actual elevation range of about 57 to 218 meters, with a mean of about 127 meters. Low green terrain follows the western side near the Chattahoochee River and extends inland along stream valleys. Higher brown and tan ridges become more common in the east and northeast, and another group of higher hills stands out in the south-central part of the county.
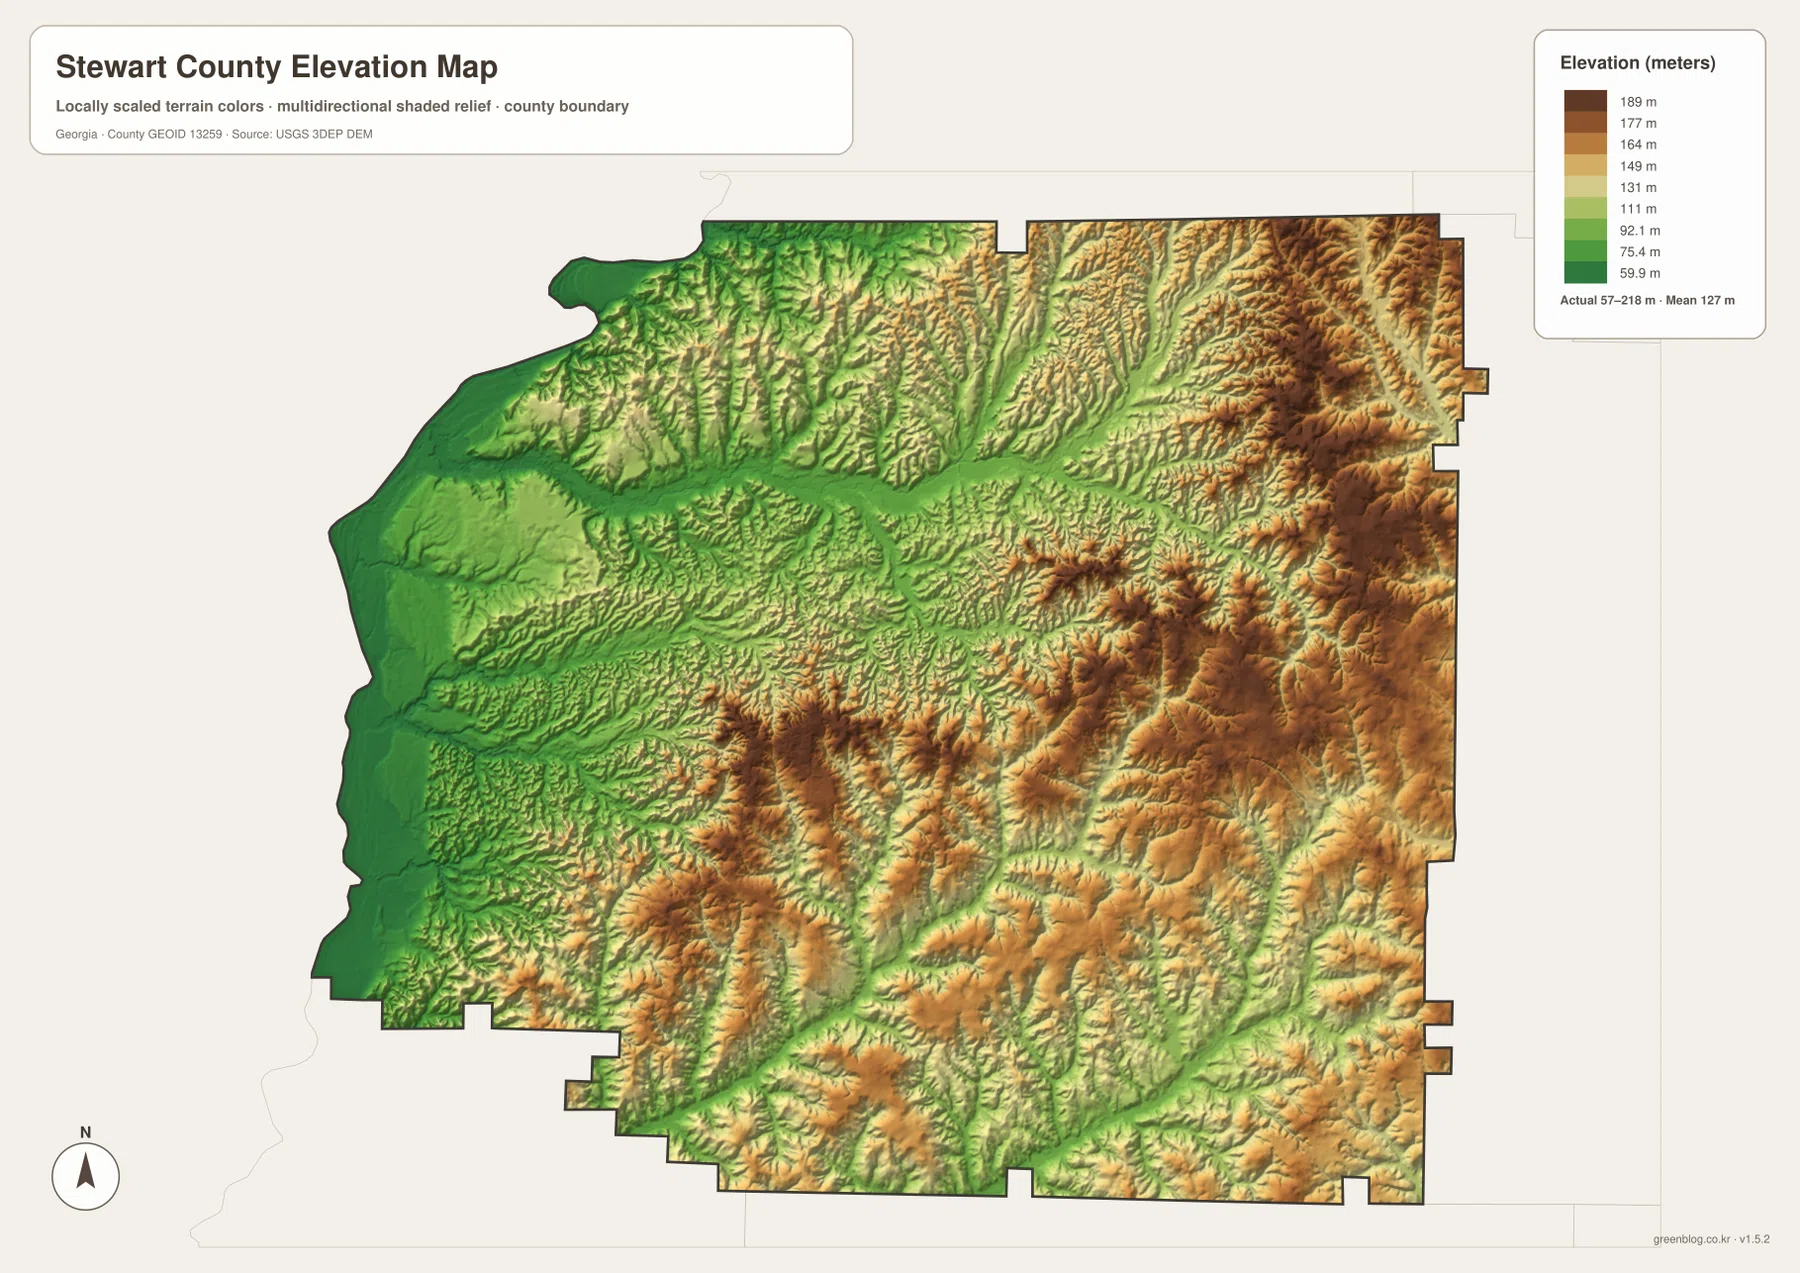
The change is not a single smooth rise from west to east. Creek valleys cut into the higher terrain, leaving narrow ridges between Hannahatchee, Hodchodkee, and other drainage lines. That is why the shaded surface looks strongly dissected even though the county’s maximum elevation is modest compared with mountain counties farther north in Georgia. The elevation map is generalized for county-scale comparison and should not be used as survey-grade or engineering-grade measurement.
Putting roads, water, and terrain together
Once the four views are compared, Stewart County stops looking like a simple rural outline. Lumpkin occupies an interior road junction, Richland forms a second city focus to the east, and the western half is strongly influenced by the Chattahoochee River and the low valleys feeding it. Higher ground in the east and parts of the south is repeatedly cut by tributaries. The relationship between those layers is more useful than memorizing a list of map types: roads explain access between the two urban centers, waterways mark the lower corridors, and elevation shows the ridges that separate them.
For classroom or local-history work, a practical sequence is to locate Lumpkin and Richland first, trace the major numbered roads, then switch to the water and elevation maps to compare the same parts of the county. Providence Canyon is part of the county context referenced in the existing article title, but these four maps are county-wide references rather than a detailed visitor map of the canyon. For driving, parcel research, flood decisions, or engineering work, use the appropriate current specialist source in addition to these maps.
Frequently Asked Questions
Is Richland the county seat because it ranks first on the city map?
No. Lumpkin is the county seat. Richland has the larger value in the supplied city index, but city rank and county-seat status describe different things.
Where is the Chattahoochee River on the Stewart County water map?
It runs along the western side of the county and is the largest water feature on the map. Hannahatchee Creek, Grass Creek, Turner Creek, and other tributaries connect the interior with that lower river corridor.
Can the elevation map be used for construction or surveying?
No. It is a county-scale terrain reference showing a generalized range of about 57 to 218 meters. Surveying, design, and site work require the original elevation data and appropriate field measurements.
Map File Information
The ZIP contains four high-resolution JPG files matching the county, city, water, and elevation views shown on this page. The body uses lighter WEBP previews, while the downloaded JPGs are intended for larger viewing, printing, classroom use, and presentation graphics.
- Included Files: county map, city map, water map, elevation map
- File Type: four high-resolution JPG files in one ZIP
Related Maps
Sources and references
- U.S. Census Bureau QuickFacts for Stewart County
- Official Stewart County history page
- U.S. Census Bureau TIGER/Line boundary and road data
- USGS National Hydrography
- USGS 3D Elevation Program
Green Map creates custom-edited map images using open geographic data sources such as geoBoundaries, Natural Earth, OpenStreetMap, and government open data. These maps are edited visual materials, not raw data files, and are provided for education, documents, presentations, and graphic reference.