You can download four high-resolution A3 JPG maps of McLennan County, Texas, in one ZIP directly from this page. The package includes a general county map, a ranked city map, a terrain-and-water map, and an elevation map. Together they show Waco, Hewitt, Robinson, Bellmead, Woodway, Lacy-Lakeview, several outlying communities, roads 6, 35, 77, 31, 84, 317, 340, and 164, the Brazos and Bosque river systems, and an actual elevation range of about 102 to 296 meters.
Waco is the most useful starting point because the county’s largest urban concentration sits around it, while major roads and rivers spread outward in several directions. Interstate 35 forms the clearest north-south reference through the Waco area, with West and Lacy-Lakeview to the north and Hewitt, Lorena, and Bruceville-Eddy toward the south. The water layer adds another organizing feature: the Brazos River passes through the central county, while the Bosque branches and Lake Waco occupy the western side. The elevation map then shows why the west feels more rugged, with high hills descending toward lower river valleys around Waco.
Table of Contents
Waco sits at the center of the county’s densest urban and road network
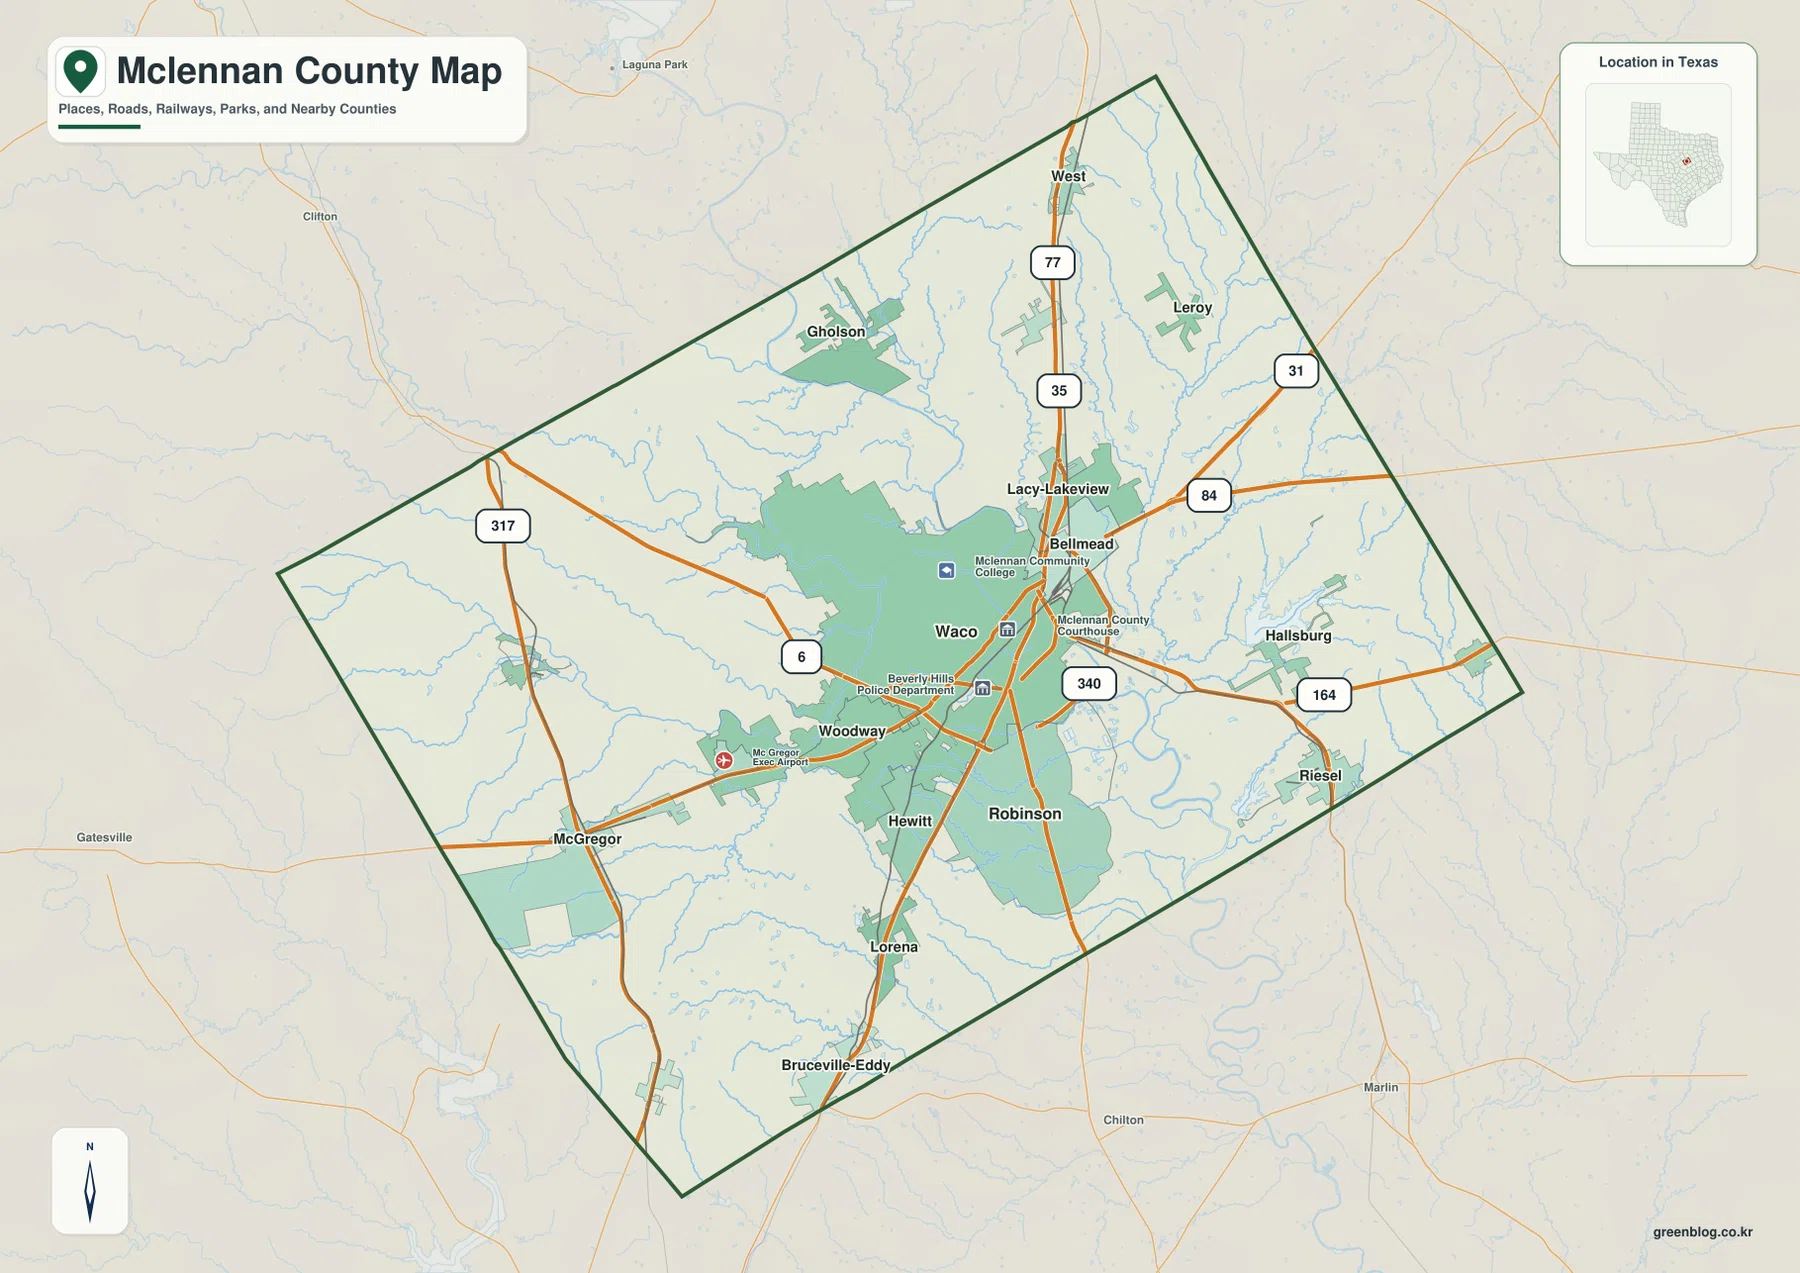
The general map gives Waco the largest developed footprint. Lacy-Lakeview and Bellmead lie immediately north and northeast, while Hewitt and Robinson are close to the south. Woodway sits on the western side of the urban area. Rather than reading these as isolated dots, it is more useful to see them as a broad cluster around Waco, with several major highways passing through or around the same built-up zone.
Interstate 35 is the strongest north-south road reference. Route 77 is labeled farther north near West, Route 6 crosses the western side of Waco near Woodway, and routes 31 and 84 extend toward the northeast and east. Route 340 appears southeast of central Waco, while Route 164 continues farther east toward the Riesel side. These roads make the county center much denser than the rural edges.
Outside the urban core, McGregor is an important western reference, with Route 317 nearby. Gholson sits northwest of Waco, West is farther north, and Leroy lies northeast. Hallsburg and Riesel mark the eastern side, while Lorena and Bruceville-Eddy extend the settlement pattern southward. The distances between these outer communities make the county’s scale easier to judge than looking only at the Waco city area.
The city index shows how six major communities cluster around Waco
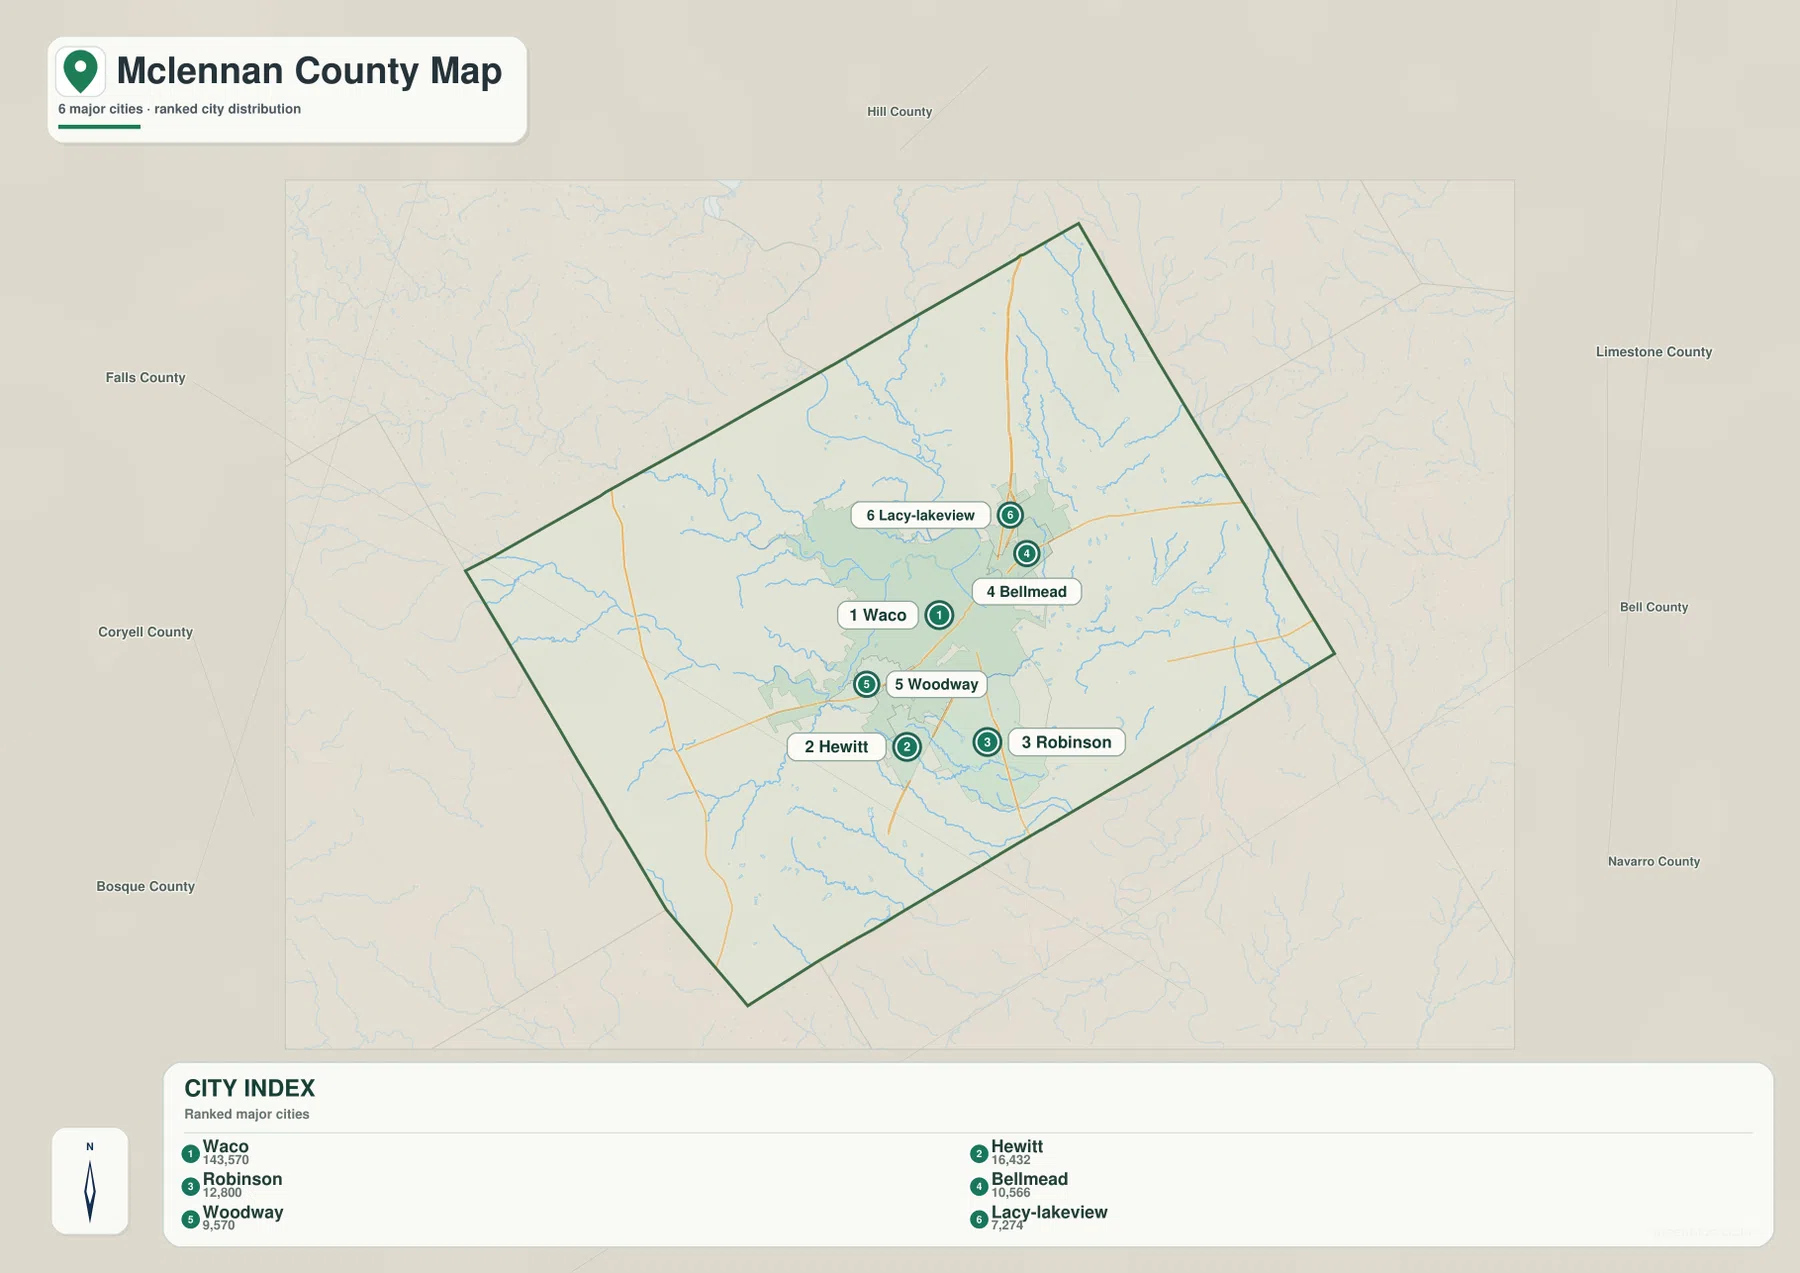
The ranked city map lists Waco first, Hewitt second, Robinson third, Bellmead fourth, Woodway fifth, and Lacy-Lakeview sixth. The lower index also prints the values 143,570, 16,432, 12,800, 10,566, 9,570, and 7,274. The supplied image does not identify a year for those figures, so this article treats them only as values shown on the map rather than presenting them as confirmed current population counts.
The arrangement is more useful than the ranking itself. Hewitt and Robinson occupy the southern side of the Waco cluster, Woodway lies west, and Bellmead and Lacy-Lakeview sit to the northeast and north. The six markers surround one dominant central city rather than forming a linear chain of similar settlements. That pattern explains why the general map shows such a large continuous developed area around Waco.
The simplified city map is best when settlement direction and spacing are the main questions. It removes most road labels, making the urban cluster easier to see. When the goal is to find Route 35, Route 6, McGregor, West, or Riesel, the general county map provides the necessary detail.
Lake Waco gathers several branches of the Bosque system on the western side
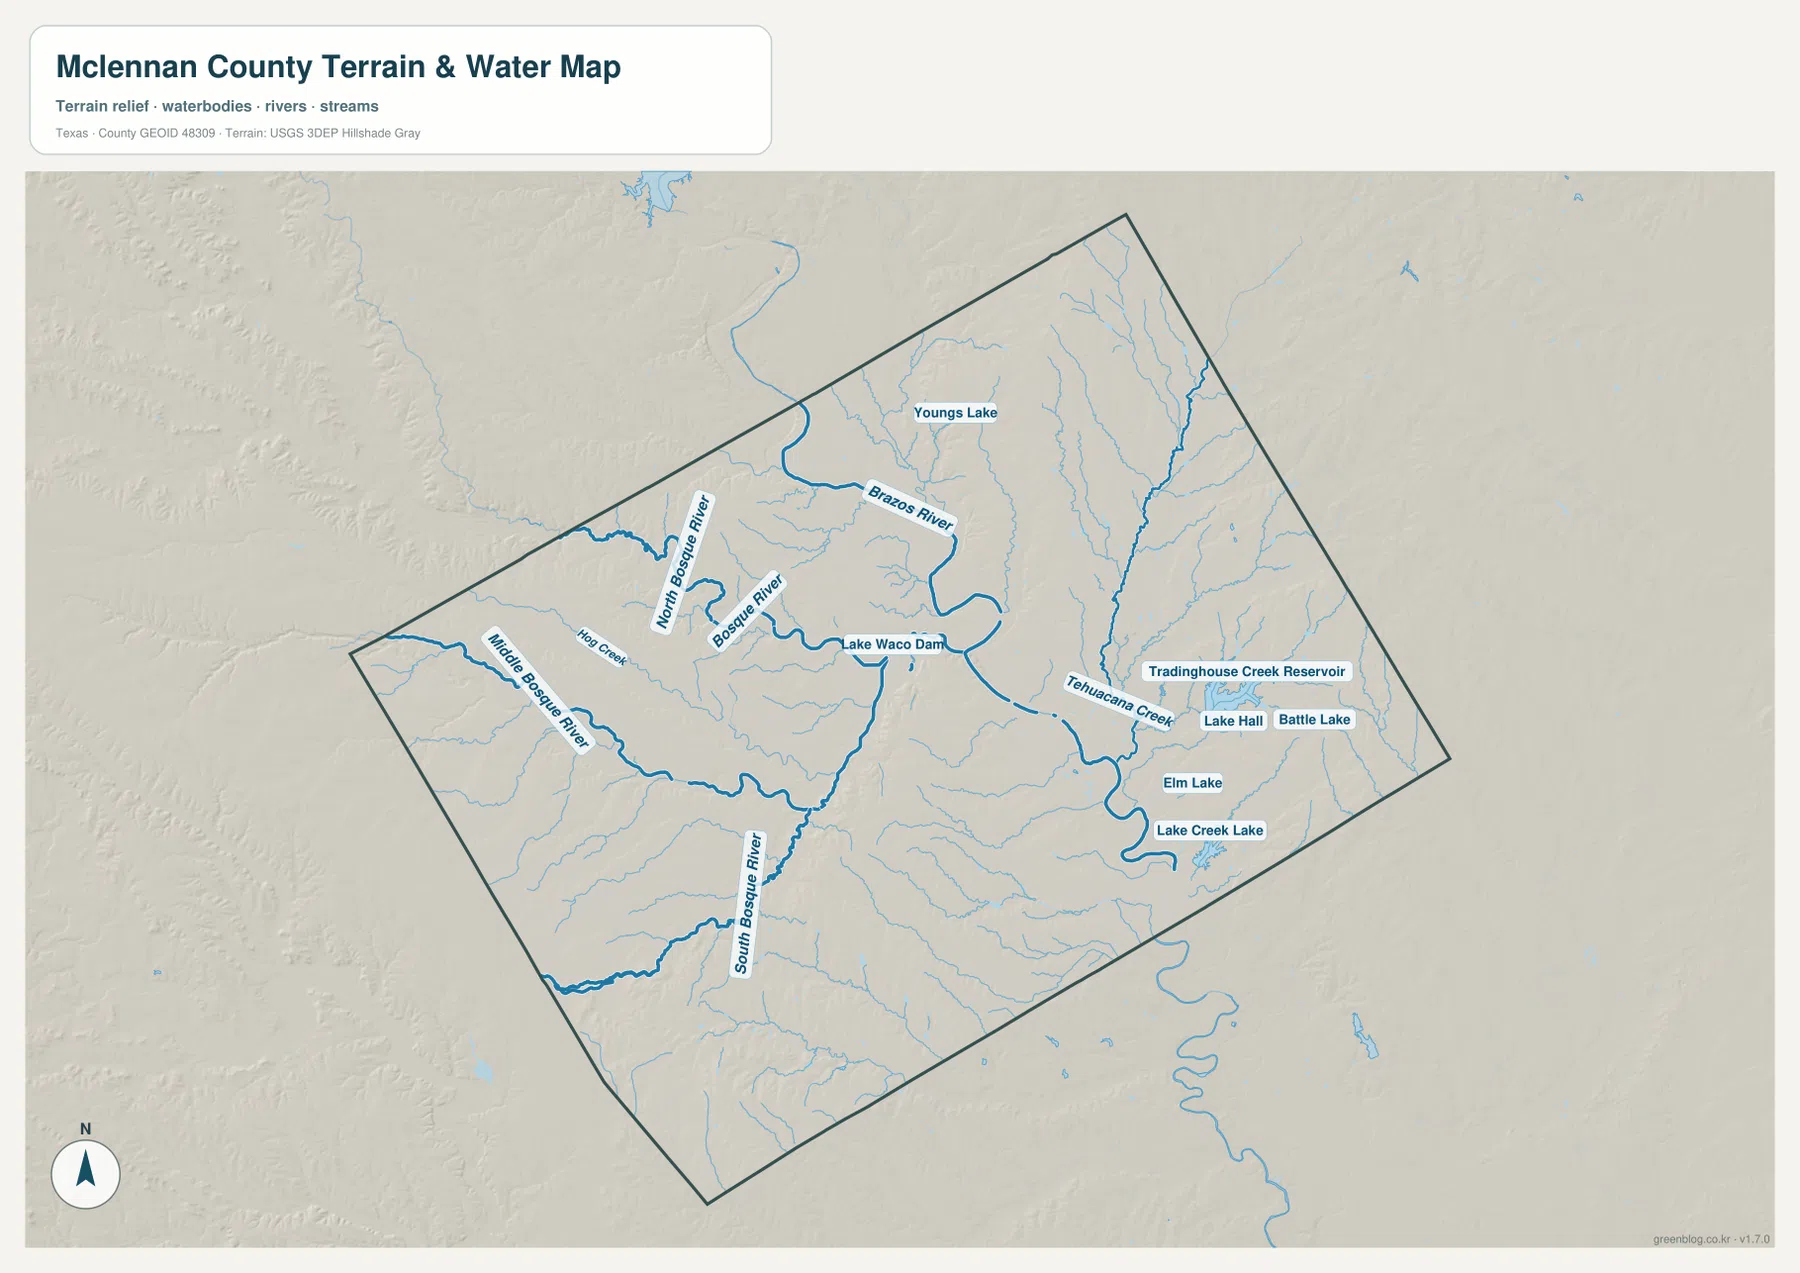
Lake Waco Dam is one of the clearest water references west of the Waco urban area. North Bosque River approaches from the north, while Middle Bosque River and South Bosque River come in from the west and southwest. Bosque River is also labeled near the lake-and-river corridor. Together, these names make the western drainage much easier to follow than it appears on the road map.
This area broadly corresponds with the Woodway and McGregor side of the general map. Once roads and settlement shading are removed, the western half is revealed as a series of tributary valleys feeding the Lake Waco area. Hog Creek is another named western waterway, adding a smaller reference between the larger Bosque branches.
Youngs Lake is labeled farther north, surrounded by additional thin tributaries. Not every small blue line carries a name on the supplied map, so this article does not assign names that are not visible. The important point is that the northwest and west are divided by multiple watercourses rather than dominated by one simple river channel.
Brazos River links the Waco area with the lower eastern drainage
Brazos River is the longest and most prominent named river on the terrain-and-water map. It enters the central-northern part of the county, passes through the Waco area, and bends toward the southeast. When the city and water maps are compared, the river provides a clear physical reference through the same broad area occupied by Waco, Bellmead, and Robinson.
East of the river, Tehuacana Creek follows a long drainage corridor, while Tradinghouse Creek Reservoir is labeled farther east. Lake Hall and Battle Lake sit nearby, and Elm Lake and Lake Creek Lake provide additional references toward the southeast. This side of the county looks different from the large Bosque branches in the west: smaller creeks, reservoirs, and lakes are distributed across a broader eastern landscape.
The terrain-and-water layer is intended for geographic reference. It is useful for locating the Brazos and Bosque rivers, Lake Waco, named creeks, reservoirs, and lakes relative to the county boundary, but it is not a flood-hazard map, legal water-boundary product, parcel map, or navigation chart. For road access or settlement locations, match the same area back to the general county map.
High western and southwestern hills descend into the Brazos and Bosque valleys
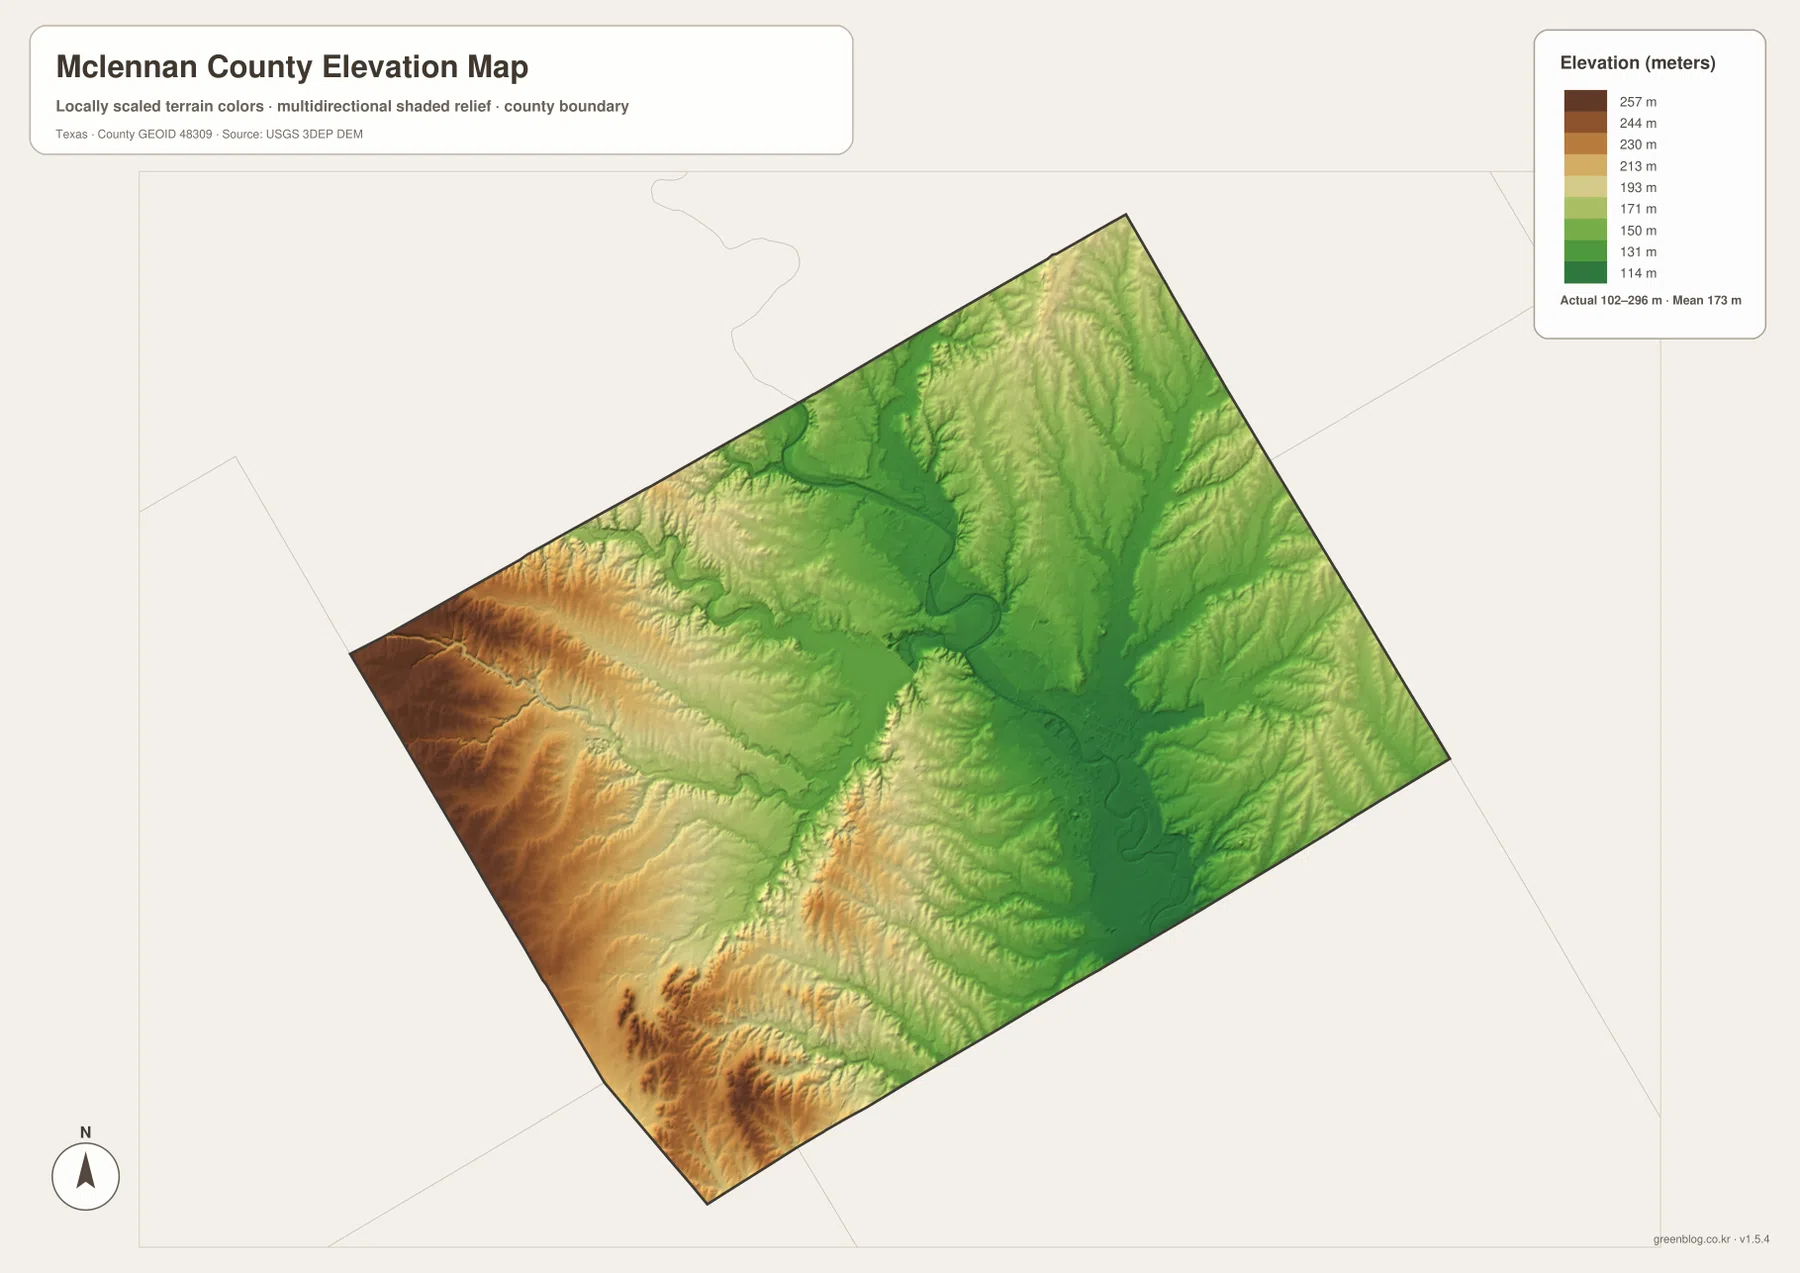
The elevation map reports an actual range of about 102 to 296 meters and a mean elevation of about 173 meters. The highest browns are concentrated along the western and southwestern side, while lower greens occupy much of the central river network. The Brazos corridor and the Bosque system around Lake Waco form broad low areas that stand out against the higher western ridges.
The western uplands are not smooth. Middle Bosque River, South Bosque River, and smaller tributaries cut narrow green valleys through tan and brown terrain. Moving toward Lake Waco and Waco itself, the low areas widen and connect with the Brazos corridor. This transition helps explain why the western edge looks more strongly dissected than the central urban area.
The eastern half is generally lower than the far west but still contains rolling terrain. Tehuacana Creek and smaller tributaries occupy lower channels, with light-green and yellow ridges between them. The difference between the displayed minimum and maximum elevation is about 194 meters, enough to create a clear contrast between the western hills and the central-to-eastern river valleys.
The elevation layer is best used for relative terrain comparison rather than survey-grade or engineering-grade measurement. Its value here is to connect the Waco urban area, Lake Waco, Brazos River, Bosque branches, and western hills into one physical picture of the county.
Comparing both sides of Waco reveals two different landscapes
Start at Waco on the general map and move west toward Woodway and McGregor. The road view shows Route 6 and Route 317, while the water map replaces much of that road emphasis with Lake Waco and the Middle and South Bosque branches. The elevation map then shows the same direction climbing into higher hills. This side gives the clearest road-water-relief transition in the county.
Moving east from Waco produces a different sequence. Bellmead, Hallsburg, and Riesel appear along roads 84 and 164, while the water map adds Tehuacana Creek, Tradinghouse Creek Reservoir, and several lakes. The elevation surface remains lower overall than the western edge, with rolling ridges separated by creek valleys rather than broad high uplands.
Use the ranked city map when the Waco-centered urban cluster is the main question, the general map for numbered roads and outlying communities, the terrain-and-water map for rivers, Lake Waco, creeks, and reservoirs, and the elevation map for the west-to-central relief contrast. Smaller labels are often easier to inspect in the downloadable high-resolution JPG files than in the browser previews.
Frequently Asked Questions
Which communities are ranked on the McLennan County city map?
The map ranks Waco first, Hewitt second, Robinson third, Bellmead fourth, Woodway fifth, and Lacy-Lakeview sixth. The numerical values in the city index are not dated on the supplied image, so this article does not present them as confirmed current population counts.
Which rivers and lakes are easiest to identify?
Brazos River is the strongest central reference. West of Waco, Lake Waco Dam and the North, Middle, and South Bosque rivers are clearly labeled. East of the Brazos, Tehuacana Creek, Tradinghouse Creek Reservoir, Lake Hall, Battle Lake, Elm Lake, and Lake Creek Lake provide additional references.
What elevation range is shown for McLennan County?
The supplied elevation map reports an actual range of about 102 to 296 meters and a mean of about 173 meters. The west and southwest are generally higher, while the Brazos and Bosque river valleys form lower corridors through the central county.
Sources and Reference Data
- U.S. Census Bureau TIGER/Line Shapefiles — official county-boundary and road geometry for geographic reference.
- USGS National Hydrography — official resources for rivers, lakes, creeks, reservoirs, and other water features.
- USGS 3D Elevation Program — official elevation resources used for terrain information.
- USGS The National Map Viewer — an official viewer for comparing geographic layers.
Map File Information
Download four high-resolution A3 JPG maps of McLennan County, Texas, in one ZIP file.
- Included Files: county map, ranked city map, terrain and water map, elevation map
- File Type: JPG
Related Maps
- Williamson County Texas map
- Somervell County
- Robertson County Texas map
- Navarro County Texas map
- San Saba County Texas map
Green Map creates custom-edited map images using open geographic data sources such as geoBoundaries, Natural Earth, OpenStreetMap, and government open data.
These maps are edited visual materials, not raw data files, and are provided for education, documents, presentations, and graphic reference.