Download the Fisher County map set on this page as a ZIP containing high-resolution A3 JPG county, city, water, and elevation maps. Fisher County in west-central Texas is organized around a small set of widely spaced communities rather than a dense town corridor. Roby sits near the middle of the county where U.S. 180 meets State Highway 70, while Rotan lies to the northwest at the junction of SH 70 and SH 92. The Clear Fork Brazos River bends through the north-central part of the county, the Double Mountain Fork Brazos River lies farther northwest, and numerous creeks cut across the interior. Elevation rises across the west and southwest and falls toward the east, giving the four supplied map views a clear geographic relationship from the start.
A useful way to read the county is to start with Roby and Rotan, then add the roads, drainage lines, and terrain around them. Roby is the central road reference, Rotan is the northwestern city reference, and McCaulley and Sylvester appear more sparsely placed in the eastern half. The pattern is not a single straight settlement belt. Instead, major roads connect a few small centers across a broad landscape that is crossed by creek valleys and shaped by a noticeable west-to-east drop in elevation.
Table of Contents
Roby, Rotan, and the Roads That Organize Fisher County
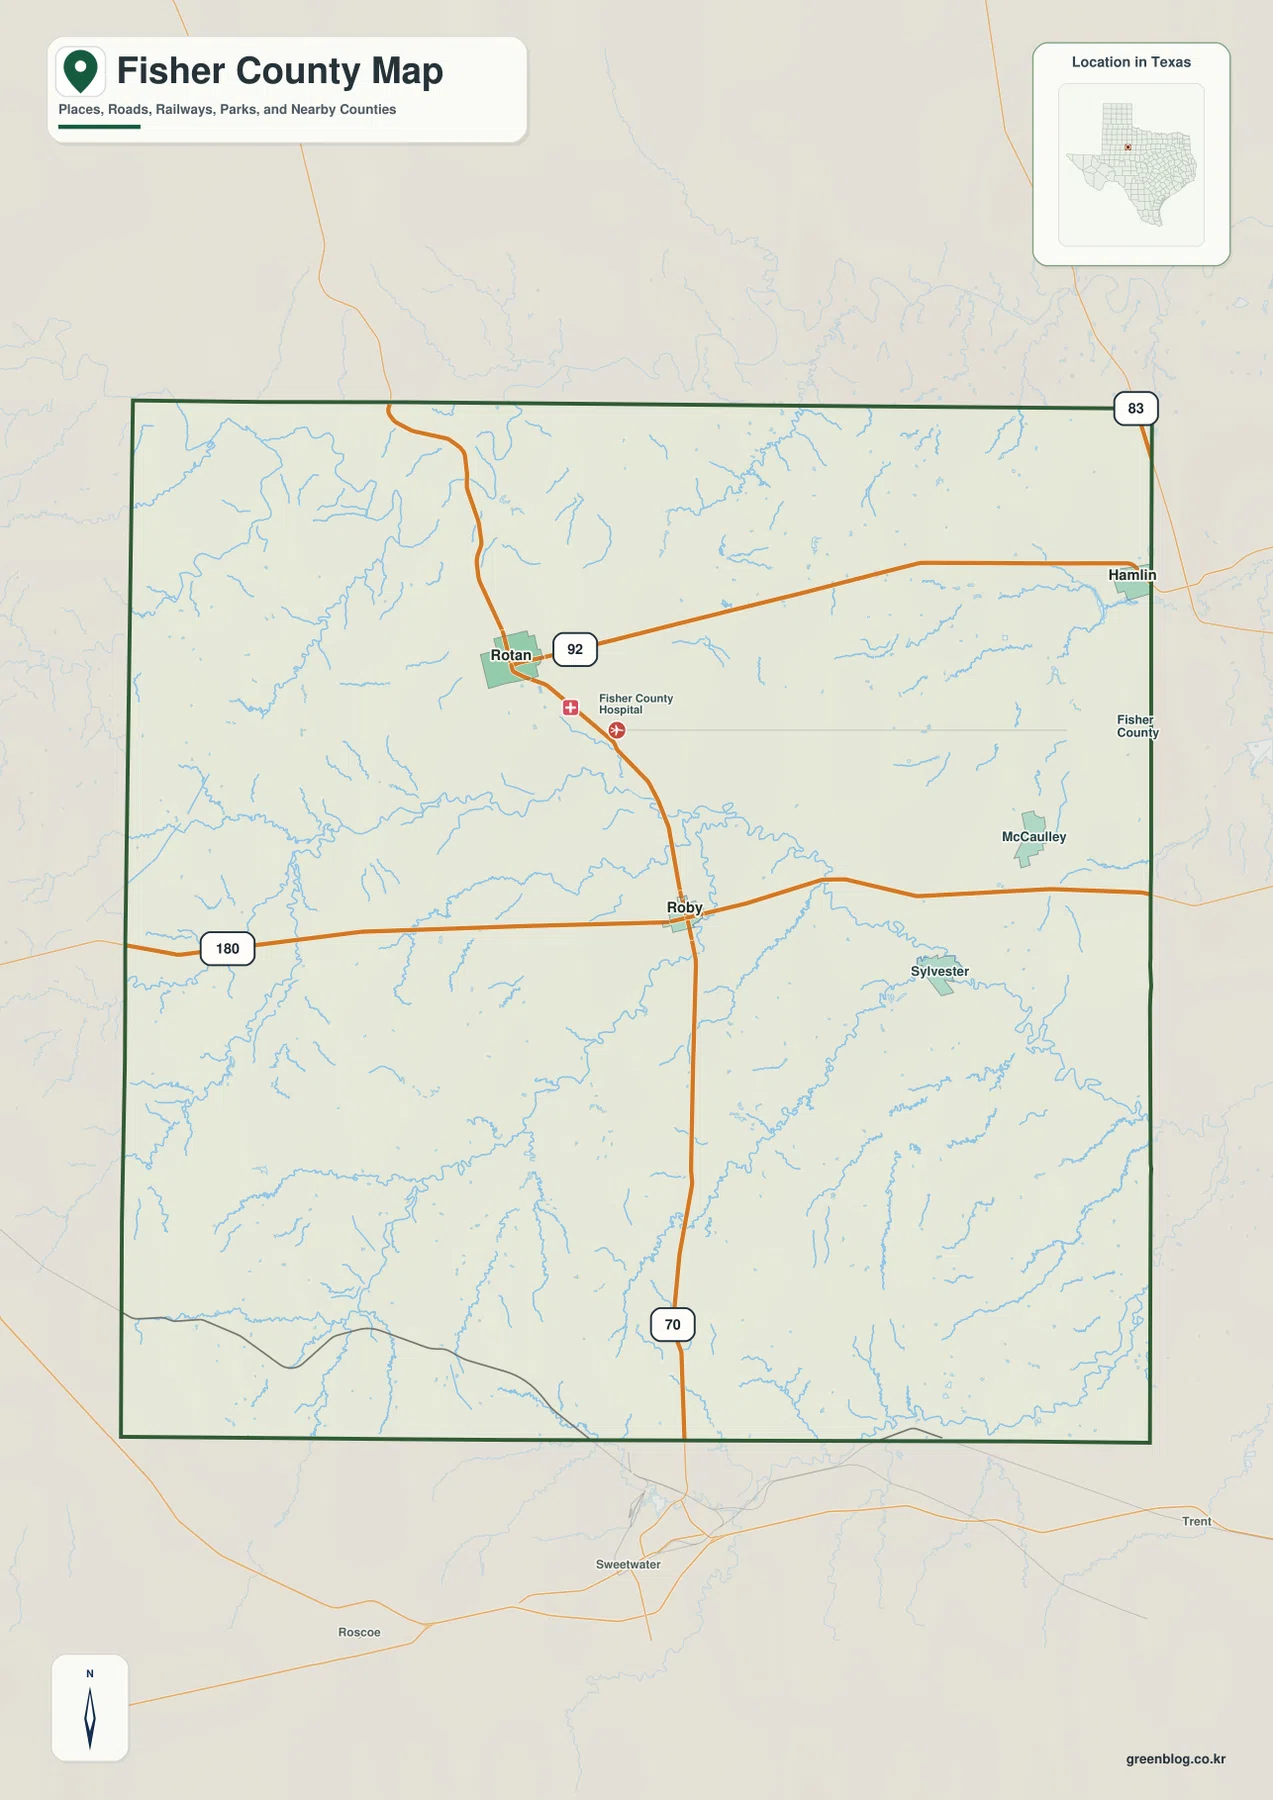
The county map gives Roby the clearest central role. U.S. 180 enters from the west, passes through Roby, and continues east across the county. State Highway 70 approaches from the south, reaches Roby, and then bends northwest toward Rotan. At Rotan, State Highway 92 extends east toward Hamlin. Those three routes explain most of the large-scale road pattern shown on the map: Roby connects the east-west and north-south movement, while Rotan has its own eastward link across the northern part of the county.
McCaulley and Sylvester are more lightly connected in the map view. McCaulley sits near the eastern side of the county north of U.S. 180, while Sylvester lies southeast of Roby in an area where smaller roads and drainage lines are more visually prominent than a large numbered highway. This spacing is important because it shows why the county should not be read as a continuous urban strip. The general map is especially helpful for seeing which communities sit directly on a major road and which are separated from those stronger corridors by open land and smaller local routes.
The Two-City Index Makes Rotan and Roby Stand Out
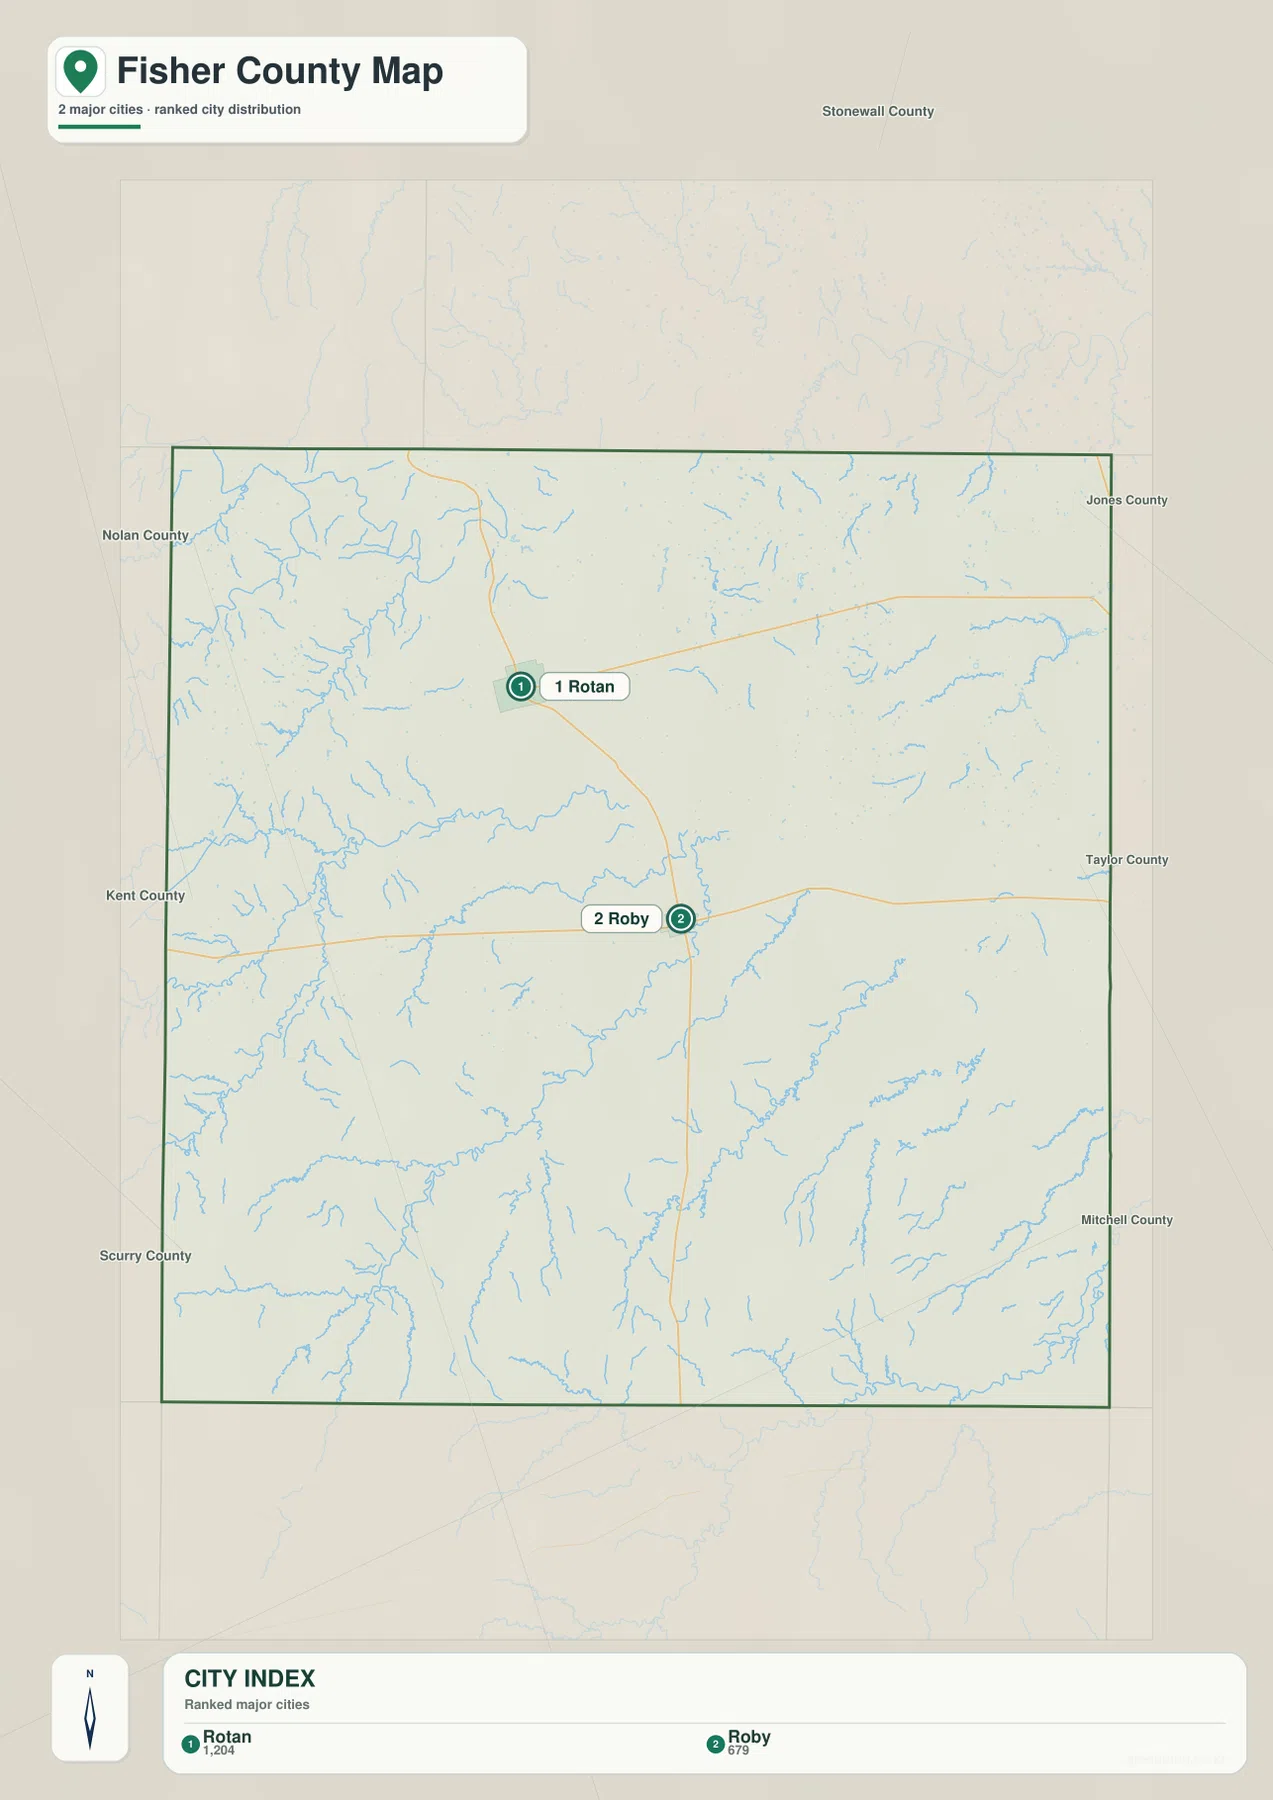
The city map deliberately simplifies Fisher County by highlighting only two major cities. Rotan is ranked first and Roby second in the city index at the bottom of the map. Their positions form a diagonal from northwest to southeast, which matches the direction of State Highway 70 on the general county map. Rotan therefore reads as the main northwestern city, while Roby remains the administrative and road reference closer to the county center.
This version does not print a connector mileage between the two cities, so it should be used for relative position and ranking rather than for estimating an exact distance. The labels outside the county frame are also less useful for geographic orientation than the features inside the county itself. A cleaner workflow is to use the city map to identify the Rotan-Roby relationship, then switch back to the county map to see SH 70 and the roads that branch away from each place.
Clear Fork Brazos River and a Dense Network of Creeks
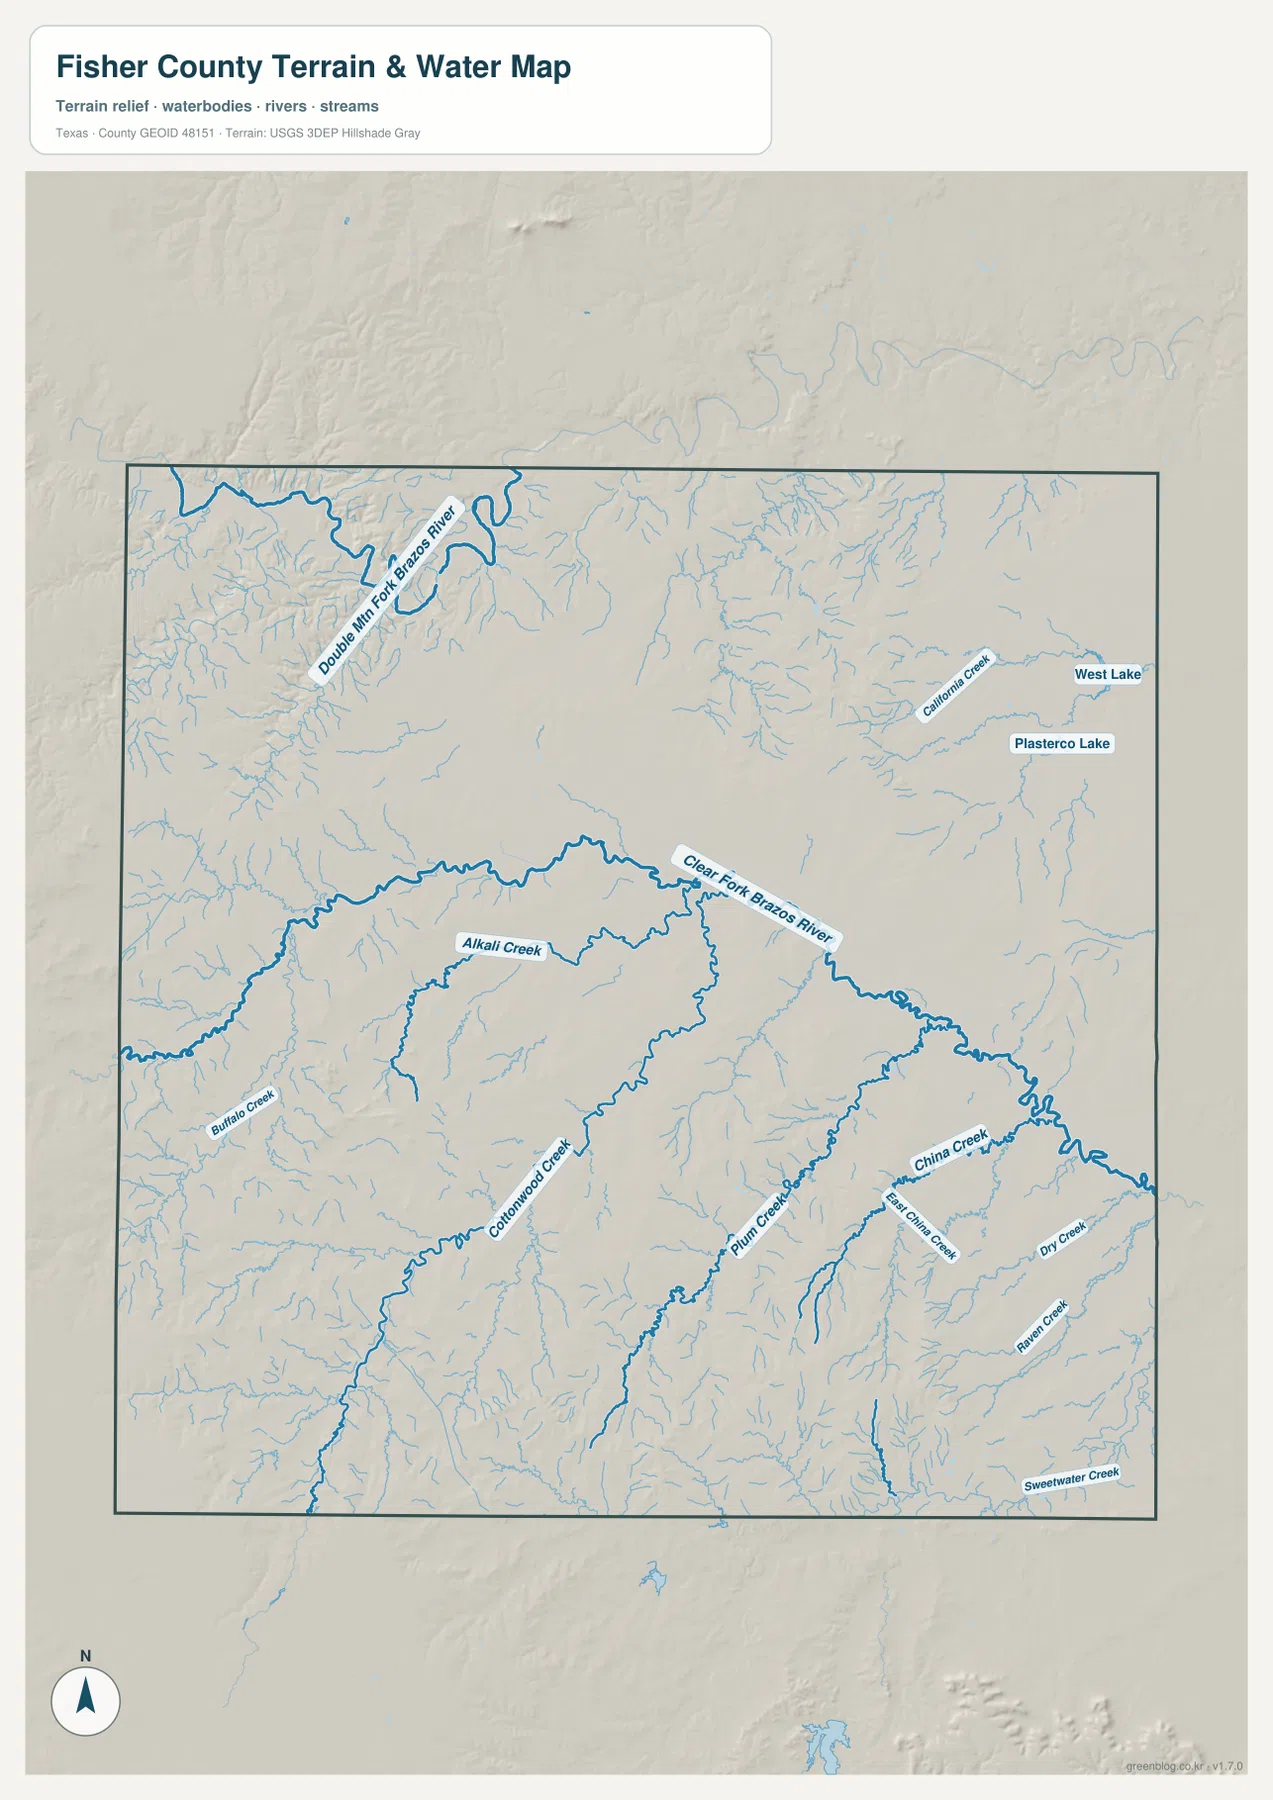
The water map is dominated by the Clear Fork Brazos River, which enters from the west, bends across the north-central part of Fisher County, and continues toward the east. Farther northwest, the Double Mountain Fork Brazos River appears as a separate large channel. Seeing both rivers on one sheet is useful because it prevents the county’s drainage from being reduced to a single river line. The northwestern corner and the central interior belong to different visible drainage patterns, even though both are part of the broader Brazos system.
Several named creeks make the interior pattern much more detailed. Alkali Creek runs toward the Clear Fork from the west-central area, while Cottonwood Creek and Plum Creek cut through the southern half. China Creek and Muddy China Creek are marked farther east, with Dry Creek and Raven Creek continuing toward the eastern and southeastern side. Buffalo Creek appears in the west, and Sweetwater Creek is labeled near the southern edge. In the northeast, California Creek is shown near West Lake and Plasterco Lake. The result is a branching set of valleys rather than a few parallel streams.
This is a reference map for locating rivers, creeks, and small lakes in relation to the county landscape. It is not a flood-zone map, parcel map, legal shoreline document, depth chart, or navigation product. Its strongest use is county-scale comparison: locate the Clear Fork Brazos River first, find the Double Mountain Fork in the northwest, and then trace the smaller named creeks that enter the larger drainage corridors.
A 524–735 Meter Elevation Range Sloping from West to East
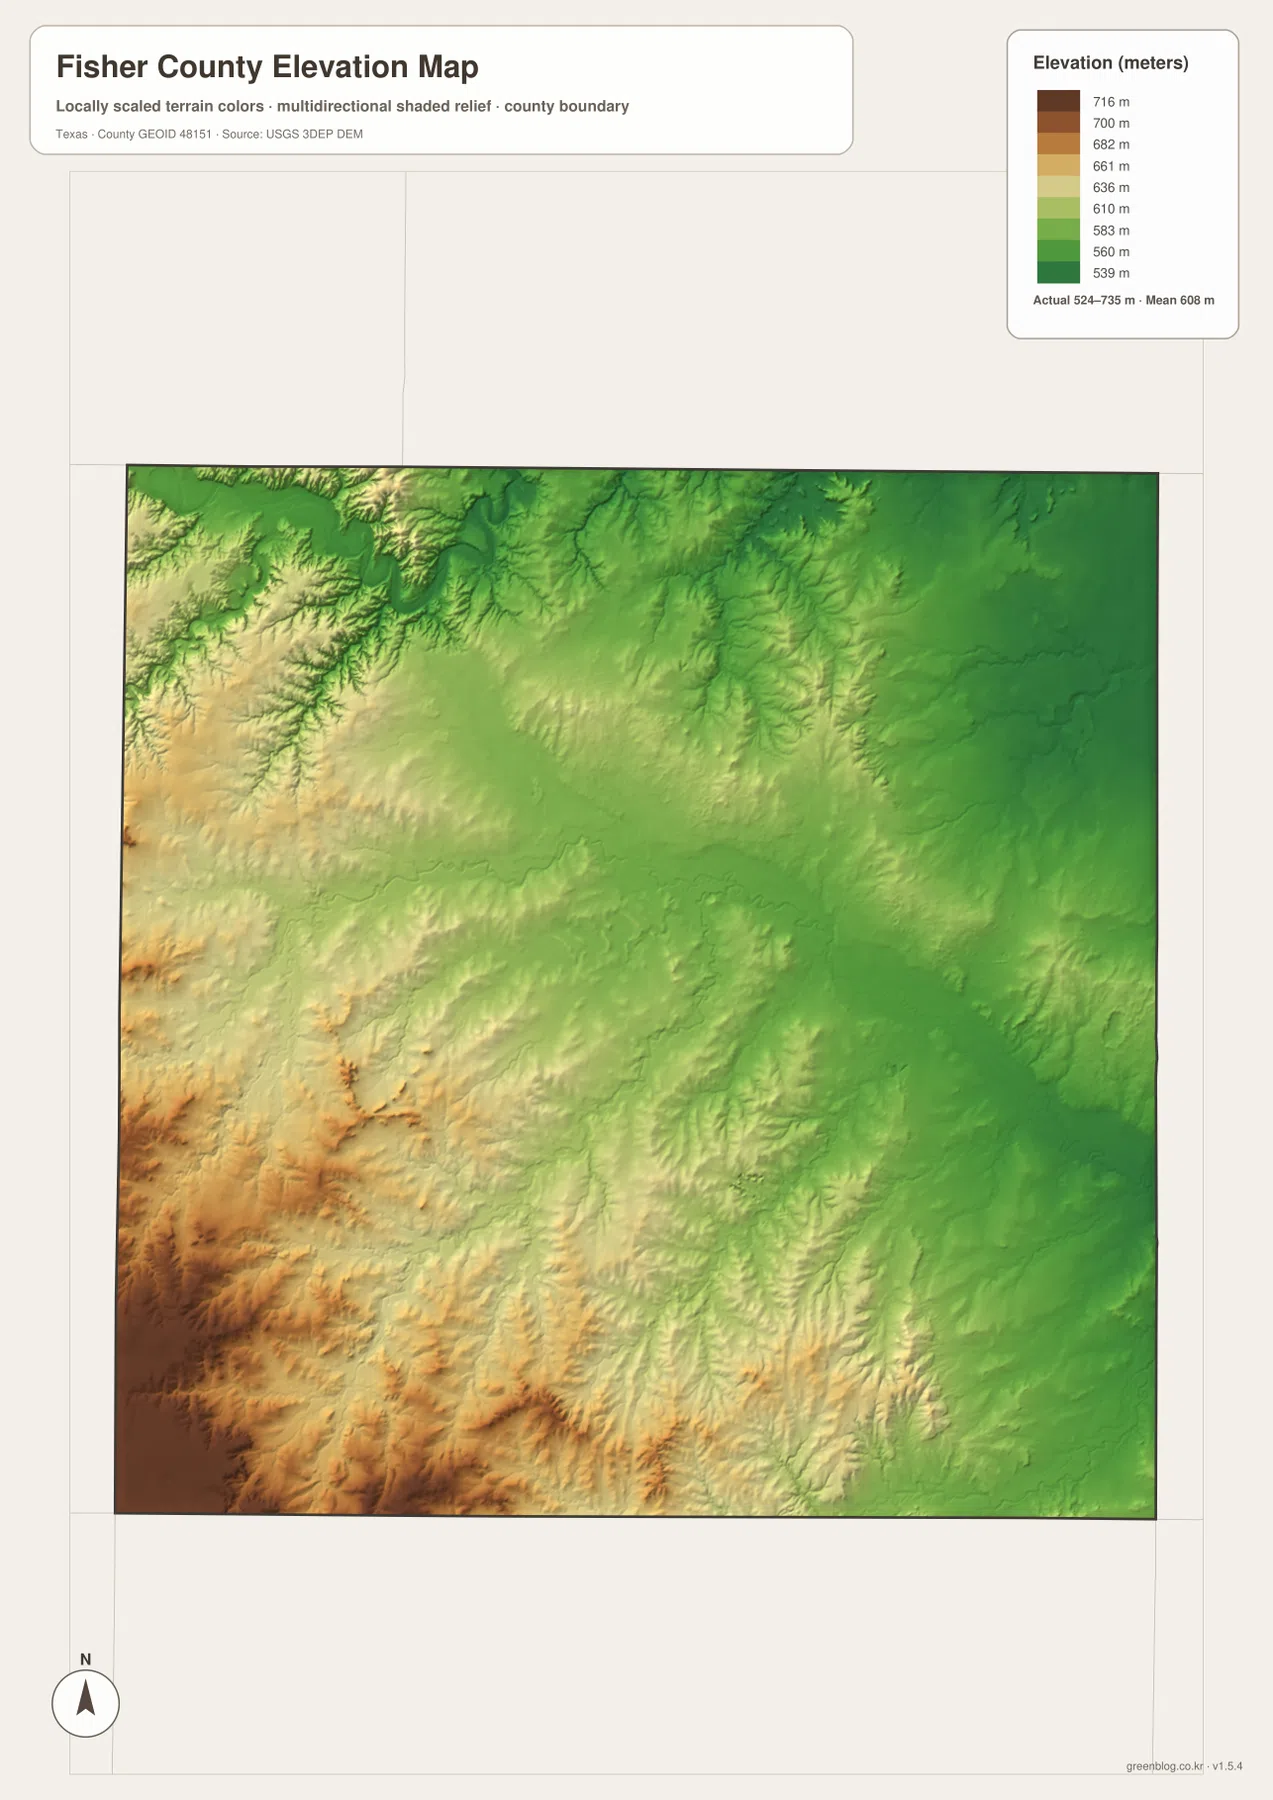
The supplied elevation map reports an actual range of about 524 to 735 meters and a mean near 608 meters. The highest broad terrain appears in the west and especially the southwest, where brown and tan colors cover ridges and rolling uplands. The eastern and northeastern portions are much greener, indicating lower ground. The county is therefore not simply a level plain: the overall surface drops eastward while creek valleys carve narrower low areas into the higher western terrain.
The connection between water and elevation is visible when the two maps are compared. Lower green bands often follow stream valleys, including the Clear Fork Brazos corridor across the north-central area and several creek valleys farther south. Cottonwood Creek and Plum Creek, for example, occupy lower cuts through terrain that becomes higher toward the west. This creates a textured surface of ridges and channels rather than a uniform slope. The western high ground is broad, but it is repeatedly dissected by drainage.
The elevation colors are generalized for county-scale reading. They are useful for identifying which parts of Fisher County are relatively high or low and for seeing how valleys fit into the broader terrain, but they are not survey-grade measurements for engineering, construction, drainage design, or parcel-level elevation work. For those purposes, a site-specific elevation source is required.
Reading Roads, Water, and Height Together Around Roby
Roby is the easiest place to combine information from all four maps. On the county map, U.S. 180 and SH 70 meet there. On the water map, the Clear Fork Brazos River runs north of the city and a network of smaller tributaries crosses the surrounding countryside. The elevation map places Roby below the highest western and southwestern uplands but above portions of the lower eastern terrain. Switching among the maps turns Roby from a single town symbol into a clear geographic reference for roads, drainage, and relief.
Rotan provides a useful contrast. It is the first-ranked city on the city-index map and sits northwest of Roby where SH 70 meets SH 92. The northwestern part of the elevation map is generally higher than the east, and the Double Mountain Fork Brazos River is visible still farther northwest on the water map. Roby and Rotan are connected by the same highway, but the routes leaving each city, the nearby drainage pattern, and their position within the county’s west-to-east elevation change are not identical.
Which Fisher County Map Fits the Question?
Use the county map when you need community names, numbered highways, the boundary, and general drainage in one view. The city map is cleaner for comparing Rotan and Roby without the extra road detail. The water map is the best choice for the Clear Fork Brazos River, Double Mountain Fork Brazos River, and named creeks, while the elevation map gives the clearest picture of the higher west and lower east. Choosing the sheet that matches the question is usually faster than trying to extract every type of information from one map.
For a Roby-focused project, begin with U.S. 180 and SH 70 on the county map, check the Clear Fork Brazos River and nearby tributaries on the water map, and then compare the local height with the western uplands on the elevation map. For Rotan, the city map establishes its rank and position before the county map shows SH 70 and SH 92. The ZIP below contains the same map types as high-resolution JPG files, which are better suited to larger printing and offline reference than the web previews.
Frequently Asked Questions
How are Roby and Rotan connected on the Fisher County map?
State Highway 70 links Roby with Rotan. U.S. 180 crosses Roby from west to east, while SH 92 extends east from Rotan, so each city connects to a different east-west route even though they share the same north-south highway.
Where does the Clear Fork Brazos River cross Fisher County?
On the supplied water map, the Clear Fork Brazos River enters from the west and bends across the north-central part of the county before continuing east. Alkali Creek and smaller tributaries feed the system, while the Double Mountain Fork Brazos River is shown farther northwest.
Which part of Fisher County is highest and which is lowest?
The elevation map shows the highest broad terrain in the west and southwest and the lowest broad terrain toward the east and northeast. The mapped actual range is about 524 to 735 meters, with a mean near 608 meters.
Sources and Reference Data
- USGS The National Map Viewer — Official map viewer for terrain, roads, hydrography, and other geographic layers.
- USGS National Hydrography — Official reference for rivers, streams, lakes, and hydrographic data.
- USGS 3D Elevation Program — U.S. Geological Survey elevation and terrain data program.
- U.S. Census Bureau TIGER/Line Shapefiles — Official source for county boundaries, roads, and related base geography.
Map File Information
Download the Fisher County county map, city map, water map, and elevation map as high-resolution A3 JPG files. The ZIP contains the same map types shown on this page.
- File Type: JPG
Related Maps
- Scurry County Texas map
- Stonewall County Texas map
- Taylor County Texas map
- Shackelford County Texas map
- Sterling County Texas map
Green Map creates custom-edited map images using open geographic data sources such as geoBoundaries, Natural Earth, OpenStreetMap, and government open data.
These maps are edited visual materials, not raw data files, and are provided for education, documents, presentations, and graphic reference.