Among adults classified in the richest 60% of their country’s income distribution, access to an account or mobile money is high in many places but far from universal everywhere. The World Bank’s 2024 FX.OWN.TOTL.60.ZS data contain 138 economies with a numeric observation. Their median is 81.3% and the mean is 75.1%. The lower mean reflects a long lower tail: a group of economies records much lower access even within this relatively higher-income segment.
The denominator is essential. This is not the account-ownership rate for all adults, and it is not a measure of how wealthy a country is. The indicator looks at people age 15 and older who fall in the “richest 60%” subgroup and reports the share who have an account at a financial institution or personally used a mobile-money service during the previous 12 months. It therefore answers a subgroup access question rather than a whole-population one.
The source table contains 217 country and economy rows. Seventy-nine rows have no 2024 value, leaving 138 numeric observations for the statistics. Missing values are kept missing rather than converted to zero. A gray area on the map therefore means that the 2024 observation is unavailable or that the low-resolution boundary file lacks a separate polygon; it does not mean that account or mobile-money access is 0%.
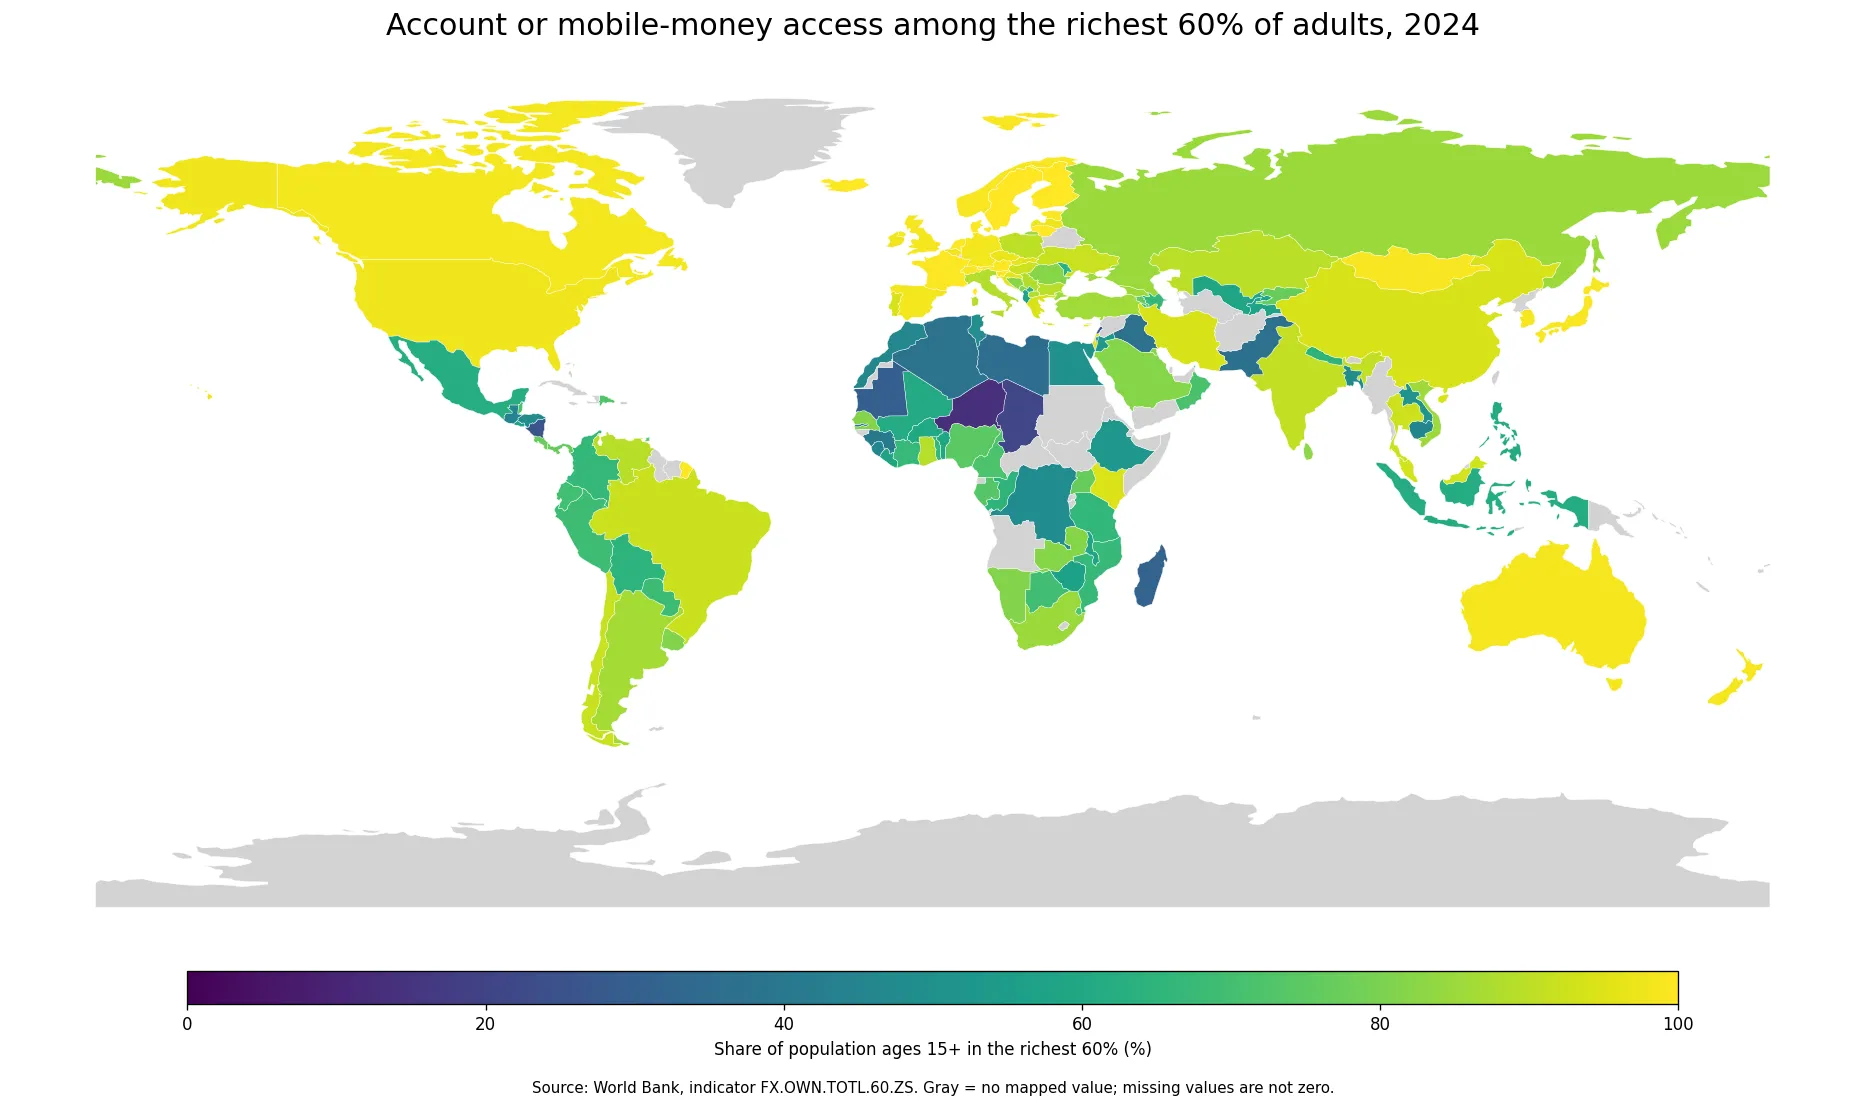
Table of Contents
A high median still hides a very wide country range
The 25th percentile is 60.2% and the 75th percentile is 94.2%, meaning that even the middle half of reporting economies spans roughly 34 percentage points. The 10th percentile is 45.7%, while the 90th percentile is 98.9%. Forty-seven economies are at or above 90%, but 22 are below 50% and five are below 30%. The distribution therefore combines near-universal access in one group with much more limited access in another.
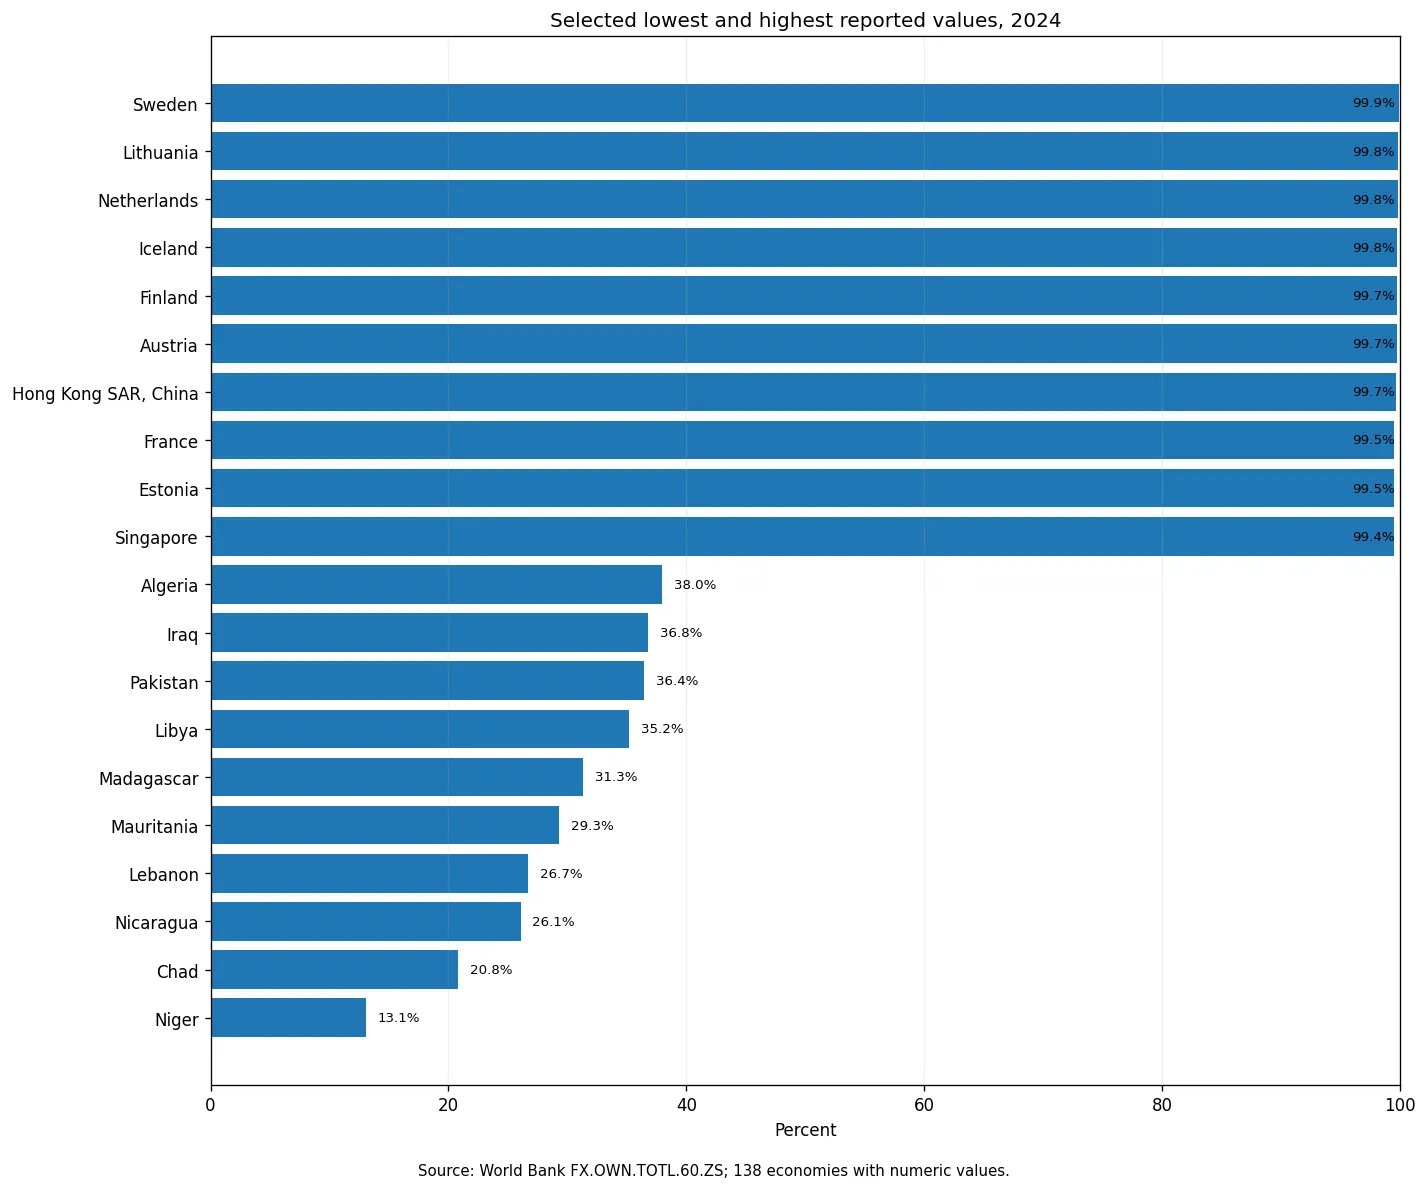
Sweden has the highest reported value at 99.86%, followed closely by Lithuania at 99.80%, the Netherlands at 99.78%, Iceland at 99.76% and Finland at 99.74%. Niger is the lowest at 13.05%, followed by Chad at 20.79%, Nicaragua at 26.06%, Lebanon at 26.69% and Mauritania at 29.31%. The difference between the maximum and minimum is about 86.81 percentage points. That scale of separation matters more than small decimal differences inside the top group.
What the “richest 60%” label does—and does not—mean
The indicator’s account definition includes two routes. A respondent may report having an account at a bank or another financial institution, or may report personally using a mobile-money service in the prior 12 months. This makes the measure broader than conventional bank-account ownership alone. At the same time, it does not measure balances, transaction frequency, savings behavior, access to affordable credit, insurance coverage, service quality or financial resilience.
The “richest 60%” label is relative to each economy’s income distribution; it should not be read as a common global income threshold. A person in the richest 60% of one economy need not have the same income as a person in the same subgroup elsewhere. The metric is therefore useful for comparing how well financial access reaches the relatively higher-income 60% within each economy, not for ranking the absolute wealth of those groups.
High access extends beyond one region
Many European economies cluster near the top, but very high values also appear in other regions. Japan records 99.09%, Singapore 99.45%, Hong Kong SAR, China 99.66%, Australia 98.81%, Canada 98.26% and the United States 97.98%. China is 93.80%, India 90.83%, Brazil 91.89% and Kenya 94.27%. The map therefore shows a broad set of high-access economies rather than a pattern confined to a single continent.
Variation within regions is just as informative. Canada and the United States are both around 98%, while Mexico is 61.97%. Brazil and Chile are above 91%, but Peru is 69.06% and Colombia 66.49%. In Asia, Japan, China and India exceed 90%, whereas Indonesia is 61.59%, Bangladesh 48.19% and Pakistan 36.41%. Regional labels can summarize geography, but they can also conceal large country-level gaps.
Highest and lowest reported observations
The table places the ten highest and ten lowest 2024 observations under the same indicator definition. Values at the top are packed tightly near 100%, while the bottom group spreads from roughly 13% to 38%. The table is most useful as a scale comparison, not as a claim that a few tenths of a percentage point create a meaningful difference in rank.
| Country or economy | Account/mobile-money access in richest 60% |
|---|---|
| Sweden | 99.9% |
| Lithuania | 99.8% |
| Netherlands | 99.8% |
| Iceland | 99.8% |
| Finland | 99.7% |
| Austria | 99.7% |
| Hong Kong SAR, China | 99.7% |
| France | 99.5% |
| Estonia | 99.5% |
| Singapore | 99.4% |
| Niger | 13.1% |
| Chad | 20.8% |
| Nicaragua | 26.1% |
| Lebanon | 26.7% |
| Mauritania | 29.3% |
| Madagascar | 31.3% |
| Libya | 35.2% |
| Pakistan | 36.4% |
| Iraq | 36.8% |
| Algeria | 38.0% |
Spatial clusters are descriptive, not causal
On the map, much of northern and western Europe forms a high-value cluster, but similarly high observations also appear across parts of East Asia, North America, Oceania and South America. Lower values are visible in parts of Sub-Saharan Africa, North Africa and the Middle East, South Asia and Central America. Some neighboring economies share similar values, while others differ sharply across short geographic distances.
Those geographic patterns do not identify a cause. Banking infrastructure, mobile networks, identification systems, regulation, urbanization, remittance channels and income structure may all be relevant, but this single indicator cannot determine which factor explains a country’s position. The safe use of the map is to locate high and low access and identify comparisons worth investigating with additional evidence.
Small islands and separately reported territories present another mapping limitation. Of the 138 numeric observations, 132 connect to a polygon in the low-resolution world boundary layer used for the visualization. The remaining numeric observations still contribute to the mean, median, percentiles and rankings. A cartographic omission is therefore kept separate from a missing source observation.
Four interpretation mistakes to avoid
- The 81.3% median is not a global adult account-ownership rate. It is the median of 138 economy-level percentages for the richest-60% subgroup.
- A high value does not show how actively accounts are used or whether people have access to affordable credit, insurance or other financial products.
- The cross-country differences do not prove that income position causes financial access. The data describe a subgroup; they do not establish causality.
- Missing rows are not zero. They are excluded from numerical summaries and shown separately in the map.
Data and method
The analysis uses the World Bank’s 2024 observation for indicator FX.OWN.TOTL.60.ZS, formally titled “Account ownership at a financial institution or with a mobile-money-service provider, richest 60% (% of population ages 15+).” The unit is percent. Of 217 country and economy rows, 138 contain a numeric value and 79 remain source-missing. The mean, median, percentiles, bands and highest/lowest observations are calculated directly from the 138 available values.
For the map, ISO3 identifiers are joined to a low-resolution Natural Earth boundary layer. Known blank ISO entries for France, Norway and Kosovo are repaired by country name before joining. Small islands and some separately reported economies do not have their own polygon in that boundary layer, so their numeric values remain in the statistical analysis even when they cannot be shaded as a separate shape.
Frequently Asked Questions
Does this indicator cover all adults?
No. It covers people age 15 and older within the richest-60% subgroup, not the entire adult population.
Does the measure include mobile money?
Yes. It includes an account at a financial institution or personal use of a mobile-money service during the previous 12 months.
Is the richest 60% based on one global income cutoff?
No. The subgroup is relative to each economy’s income distribution, so it should not be interpreted as a common absolute income threshold across countries.
How many economies have a numeric 2024 observation?
There are 138 numeric observations. The other 79 source rows are missing and are not treated as zero.
Related Articles
Green Map creates custom-edited map images using open geographic data sources such as geoBoundaries, Natural Earth, OpenStreetMap, and government open data.
These maps are edited visual materials, not raw data files, and are provided for education, documents, presentations, and graphic reference.