Buena Vista County lies in northwestern Iowa, where Storm Lake forms the strongest settlement and water landmark in the southwest while US 71 provides a clear north-south reference through the county. The Little Sioux River system crosses the north, the North Raccoon and Raccoon river system occupies the east and southeast, and the elevation map shows noticeably higher ground along much of the western side. The maps in this article separate those subjects so roads, communities, waterways, and relief can be examined without crowding them into a single image. High-resolution JPG versions are also available together in a downloadable ZIP file for larger viewing or printing.
A useful way to learn the county is to begin at Storm Lake and then move outward. Alta sits northwest of the lake, Lakeside touches its eastern side, and Newell lies farther east across the southern part of the county. Farther north, US 71 reaches Sioux Rapids, while Marathon and Albert City help define the northeastern and eastern interior. Water and elevation add another layer to this pattern: the west contains higher terrain cut by small streams, while broad lower corridors become more visible around the Little Sioux and Raccoon systems.
Table of Contents
Storm Lake and US 71 provide the quickest orientation to Buena Vista County
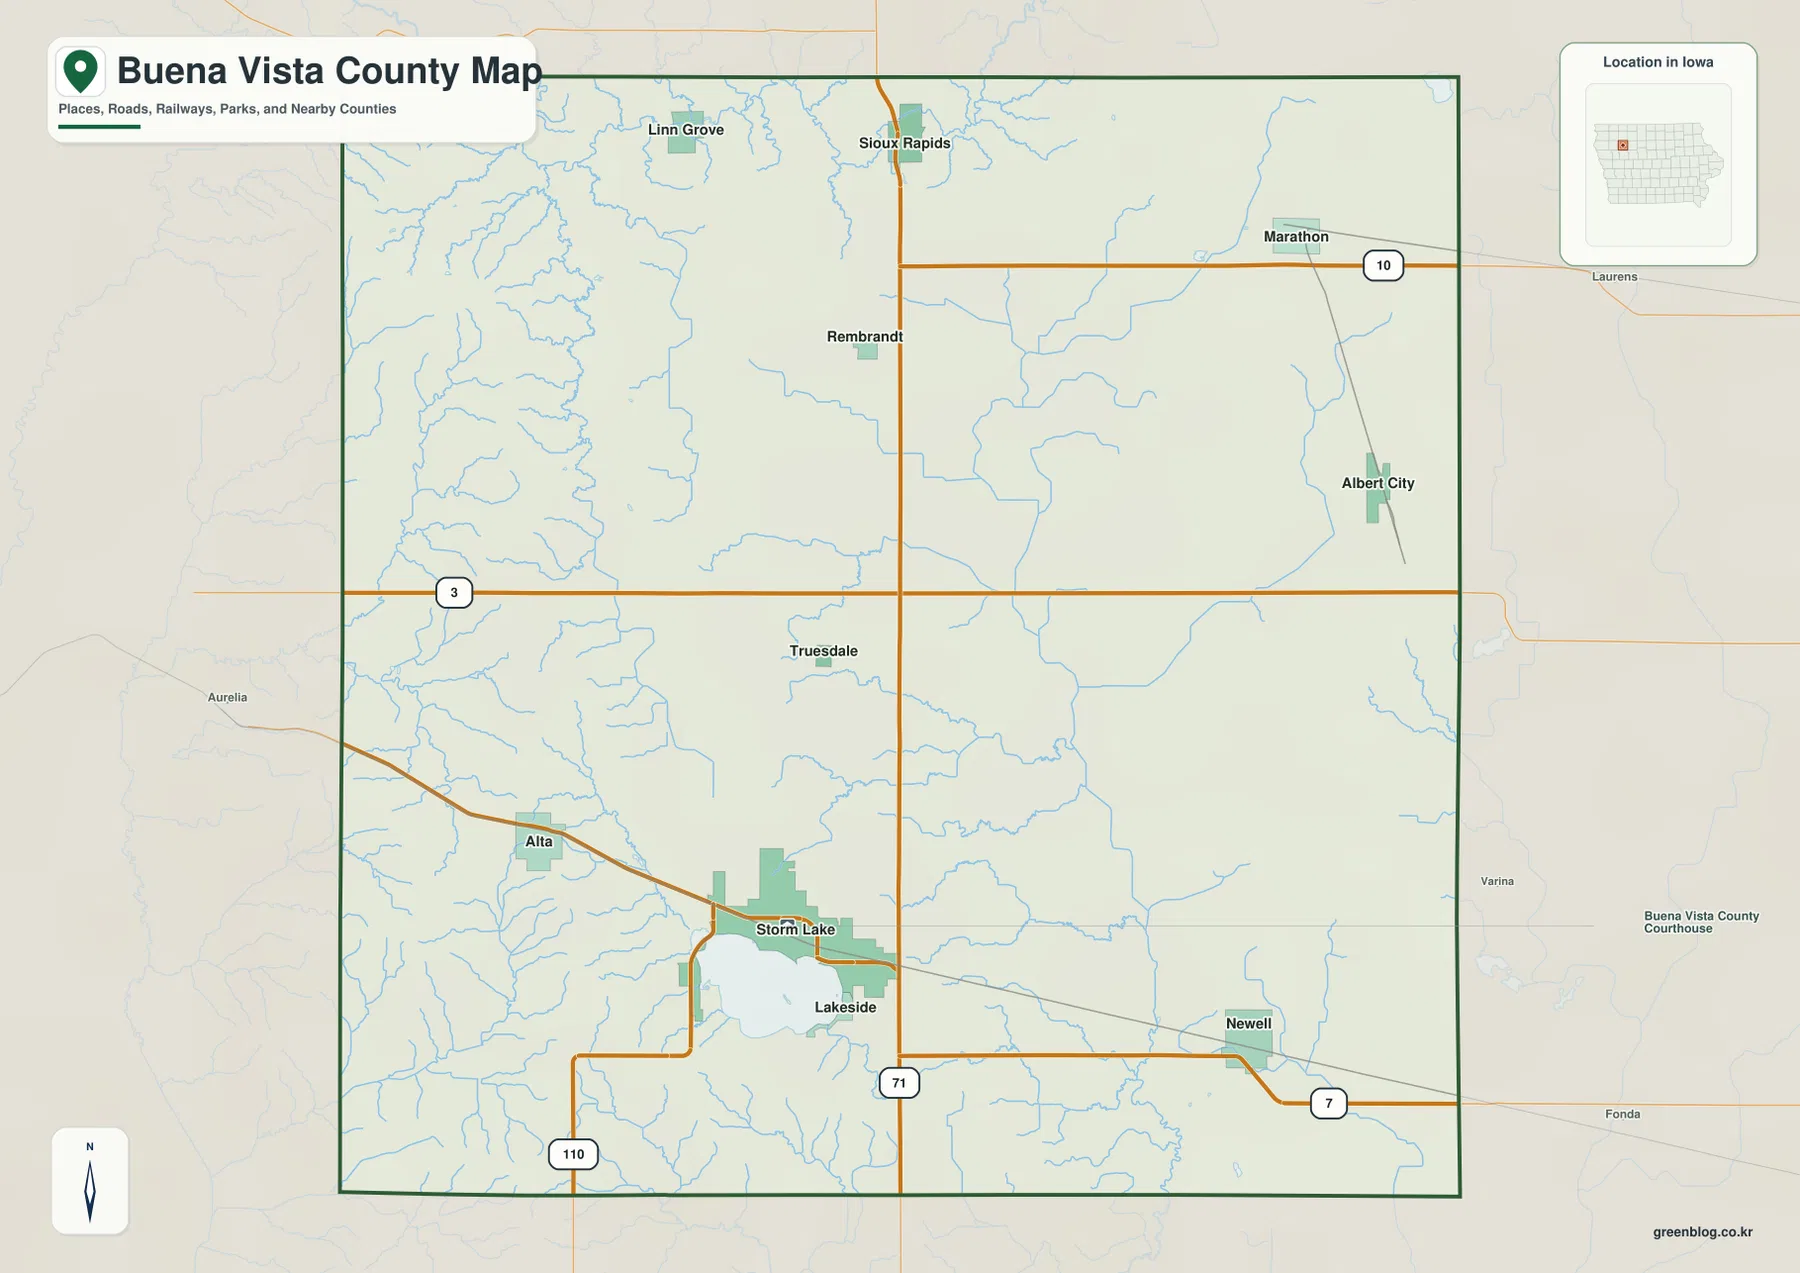
Storm Lake is the most obvious place name on the general county map. The city occupies the southwest interior along the north and west sides of the lake, with Lakeside immediately to the east of the water. Alta is northwest of Storm Lake, and Newell is farther east in the southern part of the county. Locating those four places first creates a simple framework for reading the southern half of the map.
US 71 is the clearest road reference because it runs almost straight north and south through the center of the county. It passes Sioux Rapids near the northern edge, continues by Rembrandt, crosses Iowa 3 in the middle, and then runs just east of Storm Lake before leaving the county to the south. US 10 crosses the northern part near Marathon, Iowa 7 passes through Newell in the southeast, and Iowa 110 approaches the Storm Lake area from the southwest. Together these roads make it possible to place the main towns without relying on a dense local street network.
The general map is best treated as a county-wide reference rather than a turn-by-turn navigation map. It emphasizes the county boundary, larger communities, through highways, rail lines, park areas, and a visible network of rivers and creeks. For a fast overview, use Storm Lake for the southwest, US 71 for the central north-south line, US 10 for the north, and Iowa 3 for the middle. Albert City and Marathon then provide eastern references, while Linn Grove marks the northwestern side.
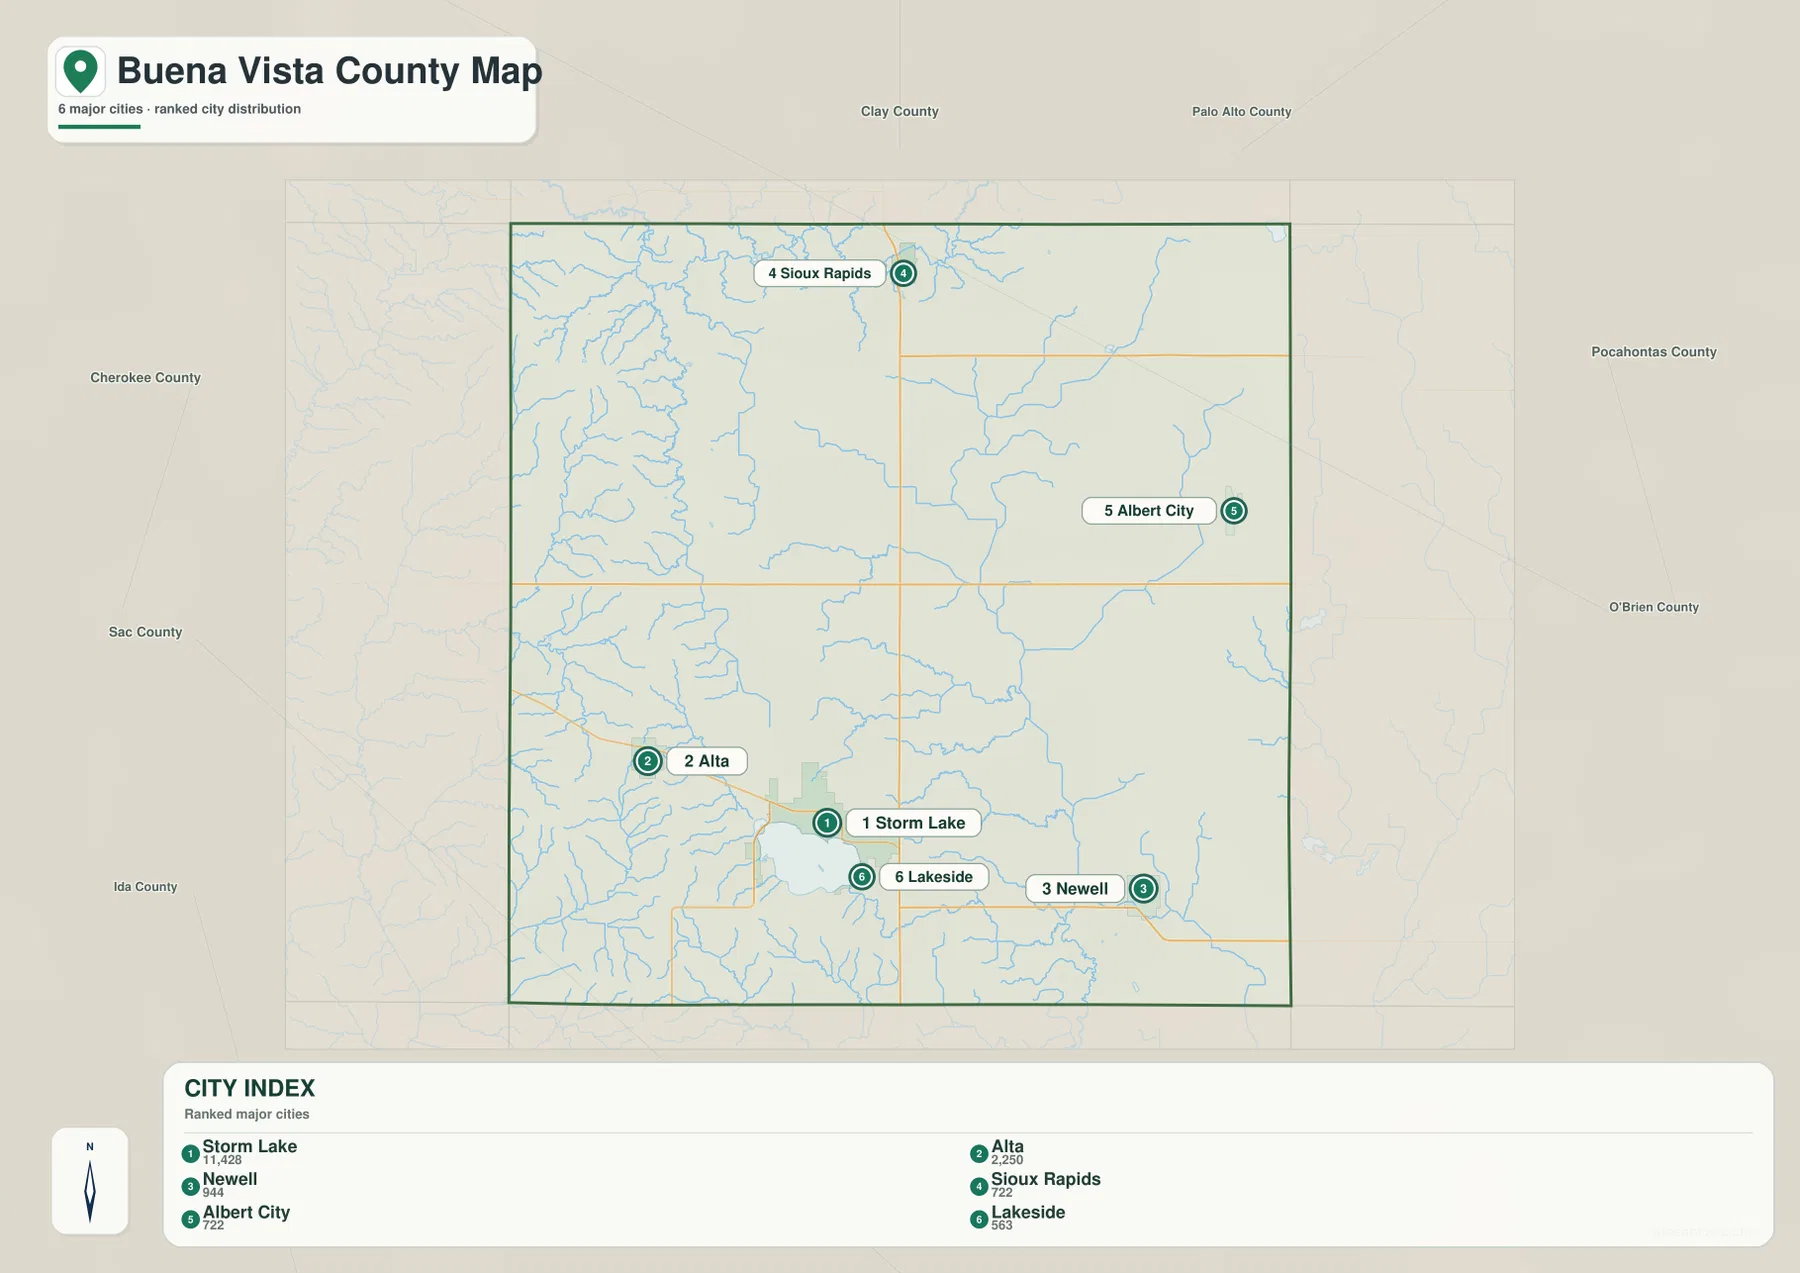
The six-city map shows a Storm Lake center surrounded by widely spaced smaller communities
The supplied city map ranks six communities: Storm Lake, Alta, Newell, Sioux Rapids, Albert City, and Lakeside. The printed index values are 11,428 for Storm Lake, 2,250 for Alta, 944 for Newell, 742 for Sioux Rapids, 722 for Albert City, and 563 for Lakeside. Those numbers are reproduced from the supplied map as comparison values rather than presented as newly calculated current population estimates. Anyone who needs an official population for a specific year should use the appropriate U.S. Census release.
The locations tell an important part of the story. Storm Lake and Lakeside form the closest pair because both sit directly around the same lake, while Alta is a short distance to the northwest. Newell is separated to the east across the southern interior. Sioux Rapids is near the northern boundary, and Albert City sits well to the east of the Storm Lake cluster. This gives Buena Vista County a strong southwest center without turning the county into one continuous urban corridor.
Road context makes the city pattern easier to understand. Storm Lake and Sioux Rapids can both be located from US 71, Newell is tied to the Iowa 7 corridor, and Alta works as a western reference just beyond the main lake-side settlement. Albert City provides a useful marker for the east-central interior where waterways and lower elevation become more prominent. When a worksheet or regional description needs to explain where people are concentrated, this map is more useful than simply listing city names.
Little Sioux waters in the north contrast with the Raccoon River system in the east
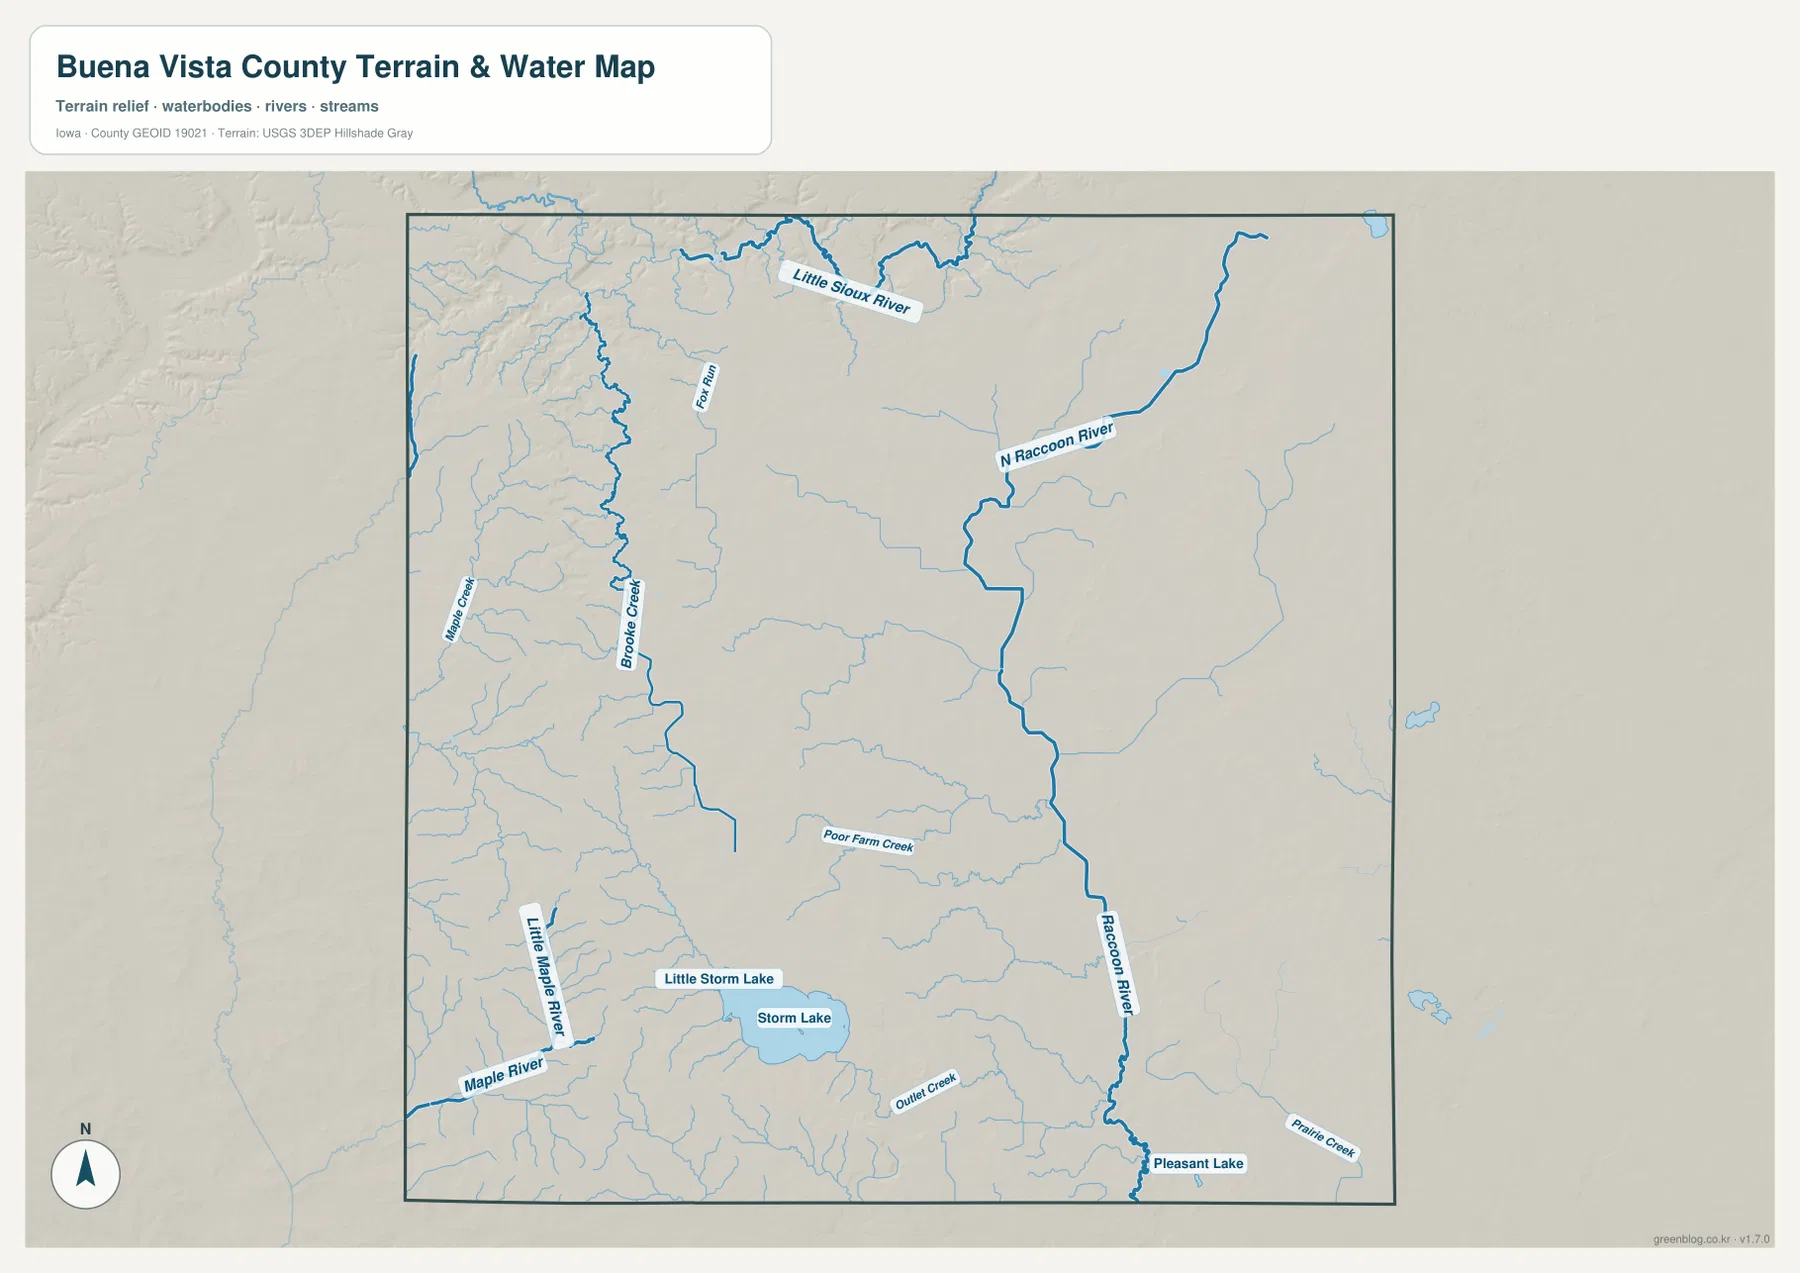
The terrain-and-water map separates Buena Vista County into several recognizable drainage areas. The Little Sioux River is the strongest named waterway across the northern part of the county. Willow Creek, Brooke Creek, and Fox Run appear in the western and north-central interior, showing smaller channels that occupy the higher western landscape before reaching larger valleys. This northern network provides useful context for Sioux Rapids and the communities near the top of the county.
Farther east, the North Raccoon River enters the northeastern interior and bends southward, continuing into the Raccoon River along the eastern and southeastern side. Poor Farm Creek and Prairie Creek are among the smaller labeled tributaries in this half of the map, and Pleasant Lake appears near the southeast. The difference between the northern Little Sioux system and the eastern Raccoon system is one of the clearest physical patterns shown in the county’s map set.
Storm Lake defines a third water-focused area in the southwest. Little Storm Lake is labeled northwest of the main lake, while the Maple River and Little Maple River lie farther west. Outlet Creek extends away from Storm Lake toward the east. Looking at these features together shows that Buena Vista County is not organized around one single river valley; a large lake, northern river system, eastern river system, and numerous smaller creeks all contribute to the local geography.
This water map is intended for geographic reference. It does not identify flood zones, parcel boundaries, legal water boundaries, safe boating routes, current water levels, or public access rights. Those questions require current specialized sources. The map is most useful for seeing where named rivers, creeks, and lakes sit in relation to one another and for comparing those low corridors with the elevation surface.
Higher western ground falls toward lower central and eastern river corridors
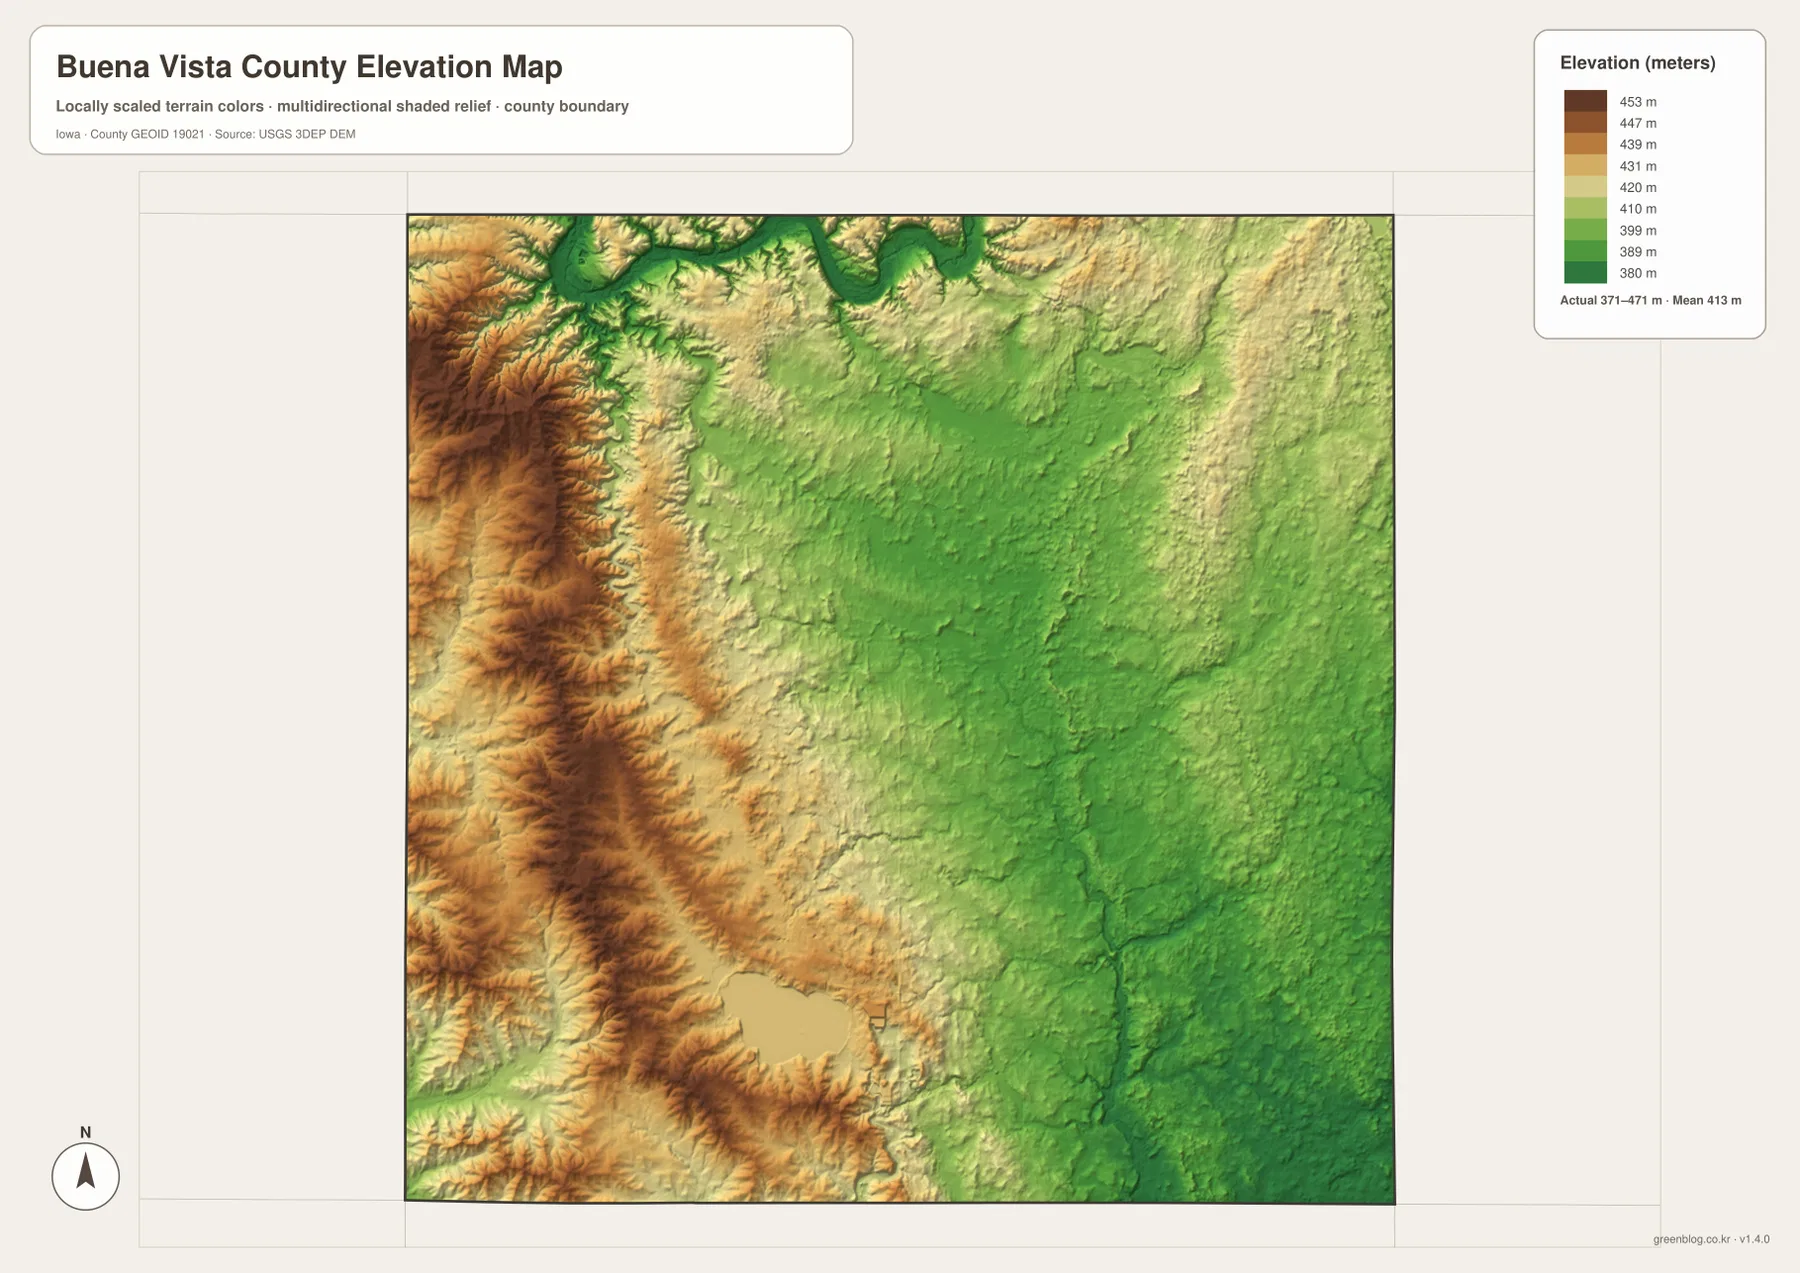
The elevation map makes the west-to-east terrain contrast immediately visible. Its legend reports an actual range of about 371 to 471 meters with a mean near 413 meters. Brown and tan colors occupy much of the western edge and northwest, indicating the higher part of the county. Greens become more common through the central and eastern interior, where the major river corridors and numerous tributary valleys occupy lower ground.
The transition is not a simple smooth slope. Narrow lower valleys cut into the western uplands, and darker green channels can be followed through the east where the North Raccoon and Raccoon rivers run. The Little Sioux River also follows a lower northern corridor. Around Storm Lake, the water body interrupts the surface while nearby higher ground becomes more apparent to the west and northwest. Comparing the water map with the elevation map makes these valley relationships much easier to recognize.
The colors should be read as generalized county-scale relief, not as survey measurements for an individual property. Brown does not mean mountainous land, and green does not automatically mean wetland or flood-prone ground. Engineering design, drainage calculations, construction, and precise site elevations require professional survey or detailed elevation sources. Here, the elevation map is best for understanding the broad contrast between western high ground and the lower valleys toward the center and east.
Storm Lake is where settlement, roads, and water are most tightly connected
The southwest stands apart because several map themes overlap in a small area. Storm Lake’s built-up area follows the north and west sides of the lake, Lakeside sits directly to the east, and Alta lies nearby to the northwest. US 71 passes just east of the main Storm Lake urban area and gives the county its strongest north-south road reference. The city map also marks Storm Lake as the largest community in the six-city index, reinforcing the visual concentration seen on the general map.
Water and relief add more detail to that concentration. Little Storm Lake lies northwest of the main lake, while the Maple and Little Maple rivers are farther west. The elevation image shows higher terrain rising to the west and northwest of the lake rather than a uniformly flat surface. For local orientation, it is therefore helpful to think of Storm Lake not only as a town and lake name but as the point where the county’s most prominent settlement, major road access, surface water, and changing relief come together.
Sioux Rapids and Albert City mark very different parts of the county
Sioux Rapids is close to the northern boundary and sits near both US 71 and the Little Sioux River. That combination makes it a natural reference for the county’s north. Linn Grove lies to the northwest, while Marathon is east along the US 10 corridor. The northern part of Buena Vista County therefore becomes easier to describe when river position is used together with roads rather than when the towns are treated as isolated labels.
Albert City plays a different role in the east-central interior. It is well removed from the Storm Lake settlement cluster and lies near the North Raccoon drainage network. Newell, farther south on the Iowa 7 corridor, provides a second eastern reference. Comparing Sioux Rapids, Albert City, and Newell across the water and elevation maps shows how the county shifts from the Little Sioux basin in the north toward the Raccoon system in the east and southeast.
Start with roads for orientation, or start with water when terrain is the main question
For a first visit to the county map, begin with Storm Lake and US 71. Follow the highway north toward Sioux Rapids, then use Iowa 3, US 10, and Iowa 7 to place the central, northern, and southeastern communities. The ranked city map works well as the next step because it strips away some detail and makes the strong Storm Lake center and more widely scattered outer towns easy to compare.
For physical geography, reverse that order. Find the Little Sioux River in the north, the North Raccoon and Raccoon rivers in the east, and Storm Lake with the Maple River system in the southwest. Then move to the elevation map to see which channels occupy lower ground and where the western uplands rise above them. Returning to the general map afterward connects those landforms back to roads and communities without requiring technical GIS interpretation.
The embedded WebP images are convenient for normal online reading, but the original JPG files are better when more detail or a larger print is needed. Each of the four supplied JPG maps measures 3638 × 2572 pixels. Because the county, city, terrain-and-water, and elevation maps are separate files, a presentation can use the general map for road context, a classroom worksheet can use the water map for river systems, and a regional comparison can pair the water and elevation maps side by side.
Use county-scale maps for context and specialized sources for precise decisions
These maps are designed to make Buena Vista County understandable at a county-wide scale. They show major communities, through roads, a representative stream network, lakes, and broad elevation differences, but they do not include every local road, building, parcel boundary, drainage ditch, or contour. The terrain-and-water map is not a flood map, and the elevation surface is not survey-grade. Property, construction, emergency, access, and site-specific elevation decisions should rely on the appropriate current official source.
For orientation, education, regional comparison, and planning before detailed navigation, the simplified view is useful. A reader can establish Storm Lake and US 71, separate the Little Sioux and Raccoon river systems, and then use elevation colors to compare western uplands with lower central and eastern valleys. The maps are intentionally divided by subject so each one can answer a clear geographic question without forcing every feature into a single crowded graphic.
Frequently Asked Questions
Which map is best for comparing Storm Lake and Sioux Rapids?
Start with the general county map and follow US 71. Storm Lake is in the southwest interior just west of the highway, while Sioux Rapids is near the northern boundary along the same north-south road. The city map is useful as a second view because it also shows the large difference between Storm Lake and Sioux Rapids in the supplied six-city index.
Where is the strongest elevation contrast in Buena Vista County?
The supplied elevation map shows the clearest contrast between higher terrain along much of the west and lower river corridors through the center and east. Its legend gives an actual range of about 371 to 471 meters and a mean near 413 meters. The Little Sioux and Raccoon river valleys are especially useful for matching the lower green areas to named waterways.
Does the downloadable ZIP only cover the Storm Lake area?
No. The archive covers the whole county and includes four high-resolution JPG files: the general county map, ranked city map, terrain-and-water map, and elevation map. Each image is 3638 × 2572 pixels, so the files provide more room for zooming or printing than the WebP images embedded in the article.
Map File Information
The ZIP contains high-resolution JPG versions of the Buena Vista County general map, city map, terrain-and-water map, and elevation map. Download the archive when you need larger files for zooming, printing, presentations, or offline reference.
- File Type: ZIP containing 4 JPG files
Related Maps
Sources and references
For current county information and more detailed conservation, boundary, hydrography, and elevation data, consult the following official sources.
- Buena Vista County Government – official county information
- Buena Vista County Conservation – county parks, natural areas, and conservation information
- U.S. Census Bureau TIGER/Line Shapefiles – county boundaries, roads, and related geographic data
- USGS National Hydrography – rivers, streams, and hydrography data
- USGS 3D Elevation Program – elevation data
Green Map creates custom-edited map images using open geographic data sources such as geoBoundaries, Natural Earth, OpenStreetMap, and government open data.
These maps are edited visual materials, not raw data files, and are provided for education, documents, presentations, and graphic reference.