Toombs County has no single land-cover class that overwhelms the 2025 map. Agriculture accounts for 24.79%, wetlands for 24.51%, and forest for 22.23%, so the county reads as a mixed rural landscape rather than a broad field or forest block. The clearest developed concentration sits across the west-central part of the county, while farm fields, wooded areas, and wetlands break into smaller pieces across the rest of the boundary. The four maps on this page separate those patterns into current cover, forest and farmland, impervious surface, and mapped change from 1985 to 2025.
The page uses WebP previews for on-screen viewing, and the download contains the four original JPG maps in one ZIP. That set is useful when the same county needs to be compared across a report, lesson, presentation, or local reference sheet. Because the legends answer different questions, the maps should not be treated as interchangeable: developed land is not the same measurement as impervious surface, and the change map is not a simple urban-growth map.
Table of Contents
A three-way rural mix: agriculture 24.79%, wetlands 24.51%, and forest 22.23%
The general land-cover map is unusually balanced among its three largest categories. Yellow agricultural areas appear throughout the county, but they are repeatedly divided by dark-green forest and teal wetlands. Wetlands trail agriculture by only 0.28 percentage points, and forest remains close behind. This balance matters because a countywide percentage alone could suggest one continuous agricultural landscape when the image instead shows many farm blocks separated by wooded and wet corridors.
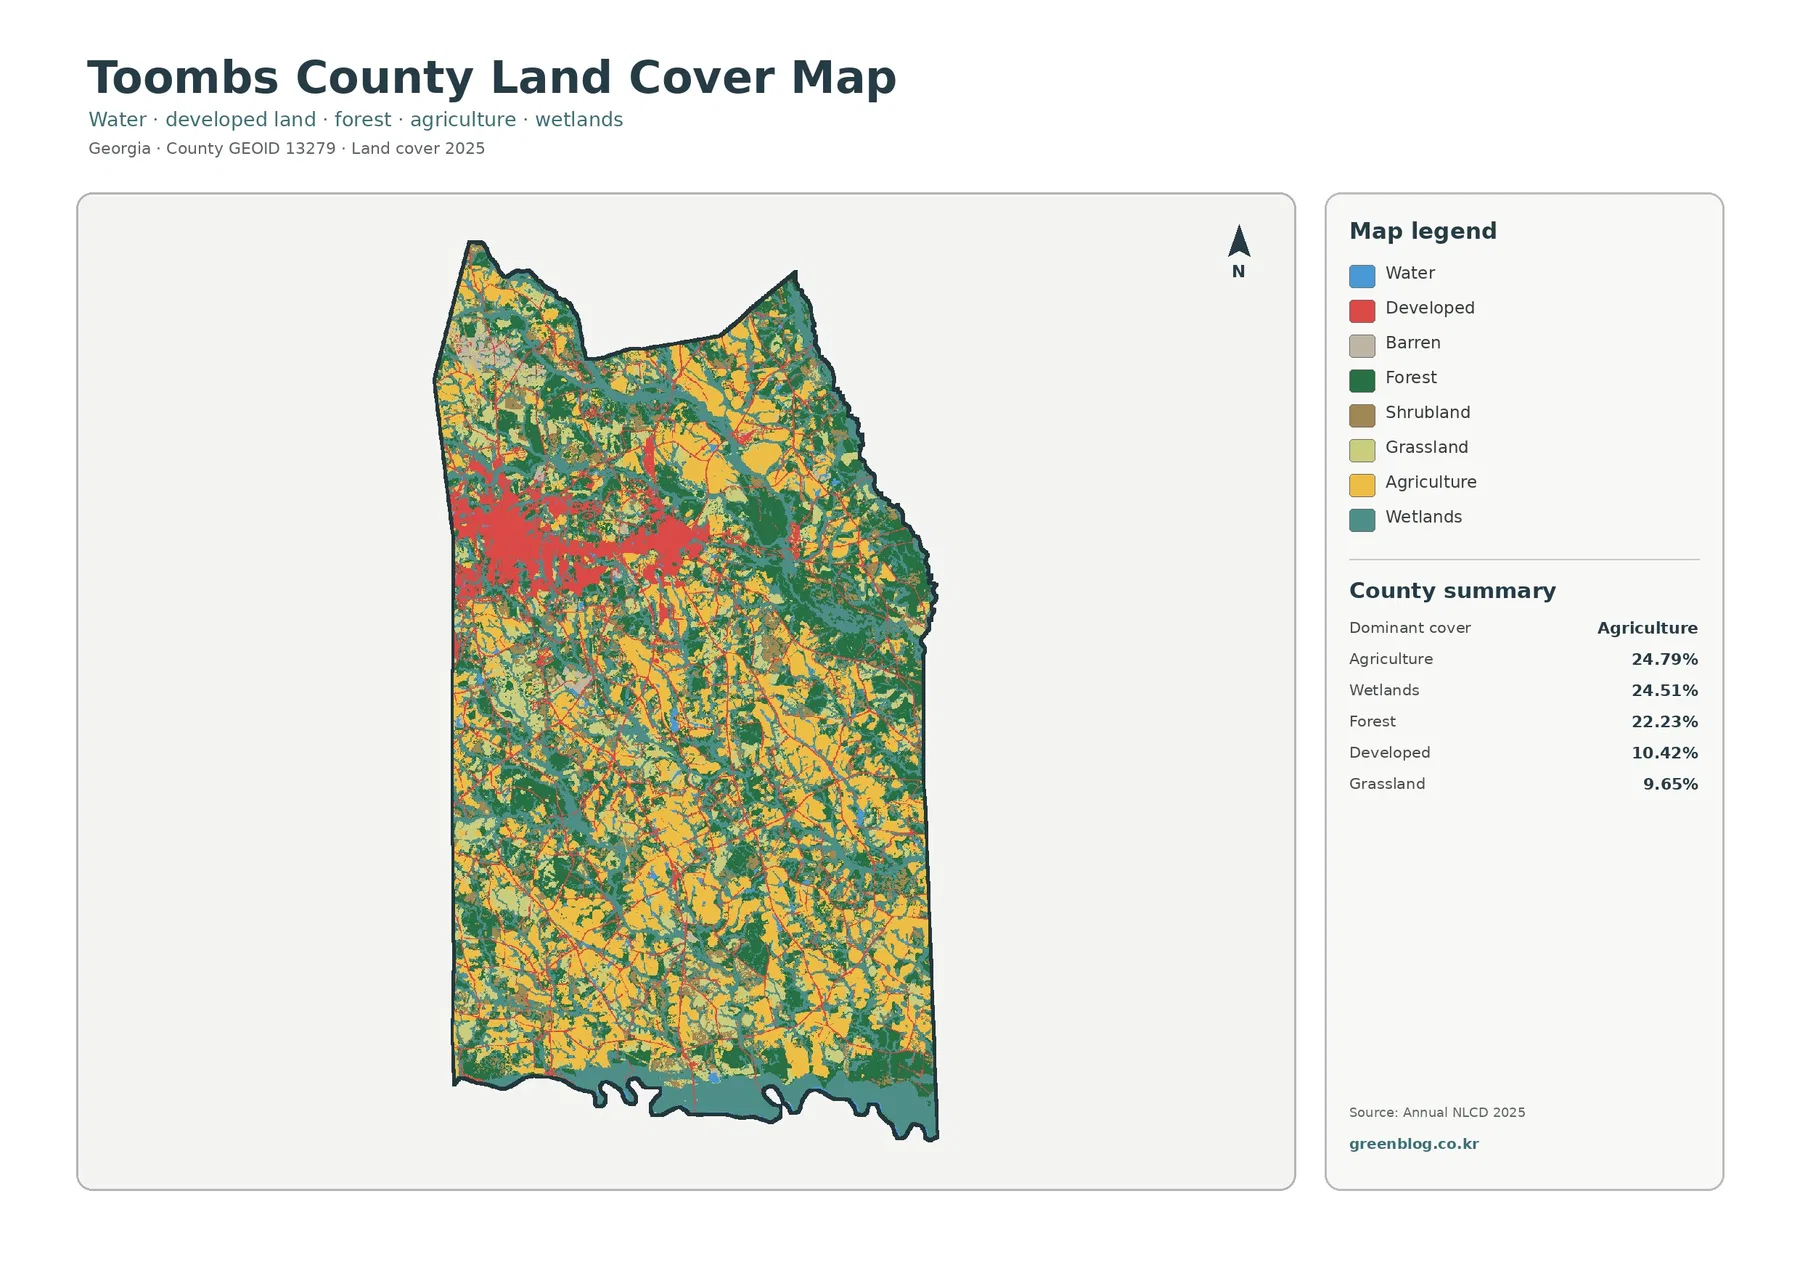
Developed land covers 10.42%. It is far smaller than the combined rural classes, yet the red area is visually prominent because much of it is concentrated rather than evenly dispersed. A broad west-central band stands out, with thinner developed lines and small clusters extending away from it. The Georgia Department of Community Affairs comprehensive-plan material for Toombs County describes recent growth in the Greater Vidalia/Lyons area and between those two cities. That planning context helps explain where to look, although the NLCD image itself does not draw municipal boundaries or label individual roads.
Grassland represents 9.65% and shrubland 6.22%. Both appear in scattered pieces among farm fields, forest, wetlands, and developed areas rather than forming one dominant zone. Water is listed separately at 1.47%. Wetlands and open water therefore should not be merged when reading the legend: a teal wetland cell is not automatically a lake or river channel. Barren land is present in the legend, but the supplied county summary does not provide its percentage, so no remainder has been calculated to invent one.
| 2025 land-cover summary | Share |
|---|---|
| Agriculture | 24.79% |
| Wetlands | 24.51% |
| Forest | 22.23% |
| Developed | 10.42% |
| Grassland | 9.65% |
| Shrubland | 6.22% |
| Water | 1.47% |
These percentages describe classified surface cover, not zoning or legal land use. An agricultural cell does not mean that the parcel is legally restricted to farming, and a developed cell does not establish whether a site can be built on. NLCD groups the visible surface into land-cover classes. Ownership, parcel boundaries, zoning, permits, crop type, and conservation status come from different records and should be checked separately when a decision depends on them.
The hardest surfaces stay concentrated inside a much larger developed footprint
The impervious-surface map narrows the question from “where is land developed?” to “where are roofs, pavement, and other surfaces that resist water infiltration most concentrated?” Toombs County has a mean impervious value of 2.32%, and only 0.88% of the county is mapped at 50% impervious or higher. Those figures are much smaller than the 10.42% developed-cover share because developed classes can include lawns, trees, bare soil, and other surfaces that still allow some water to enter the ground.
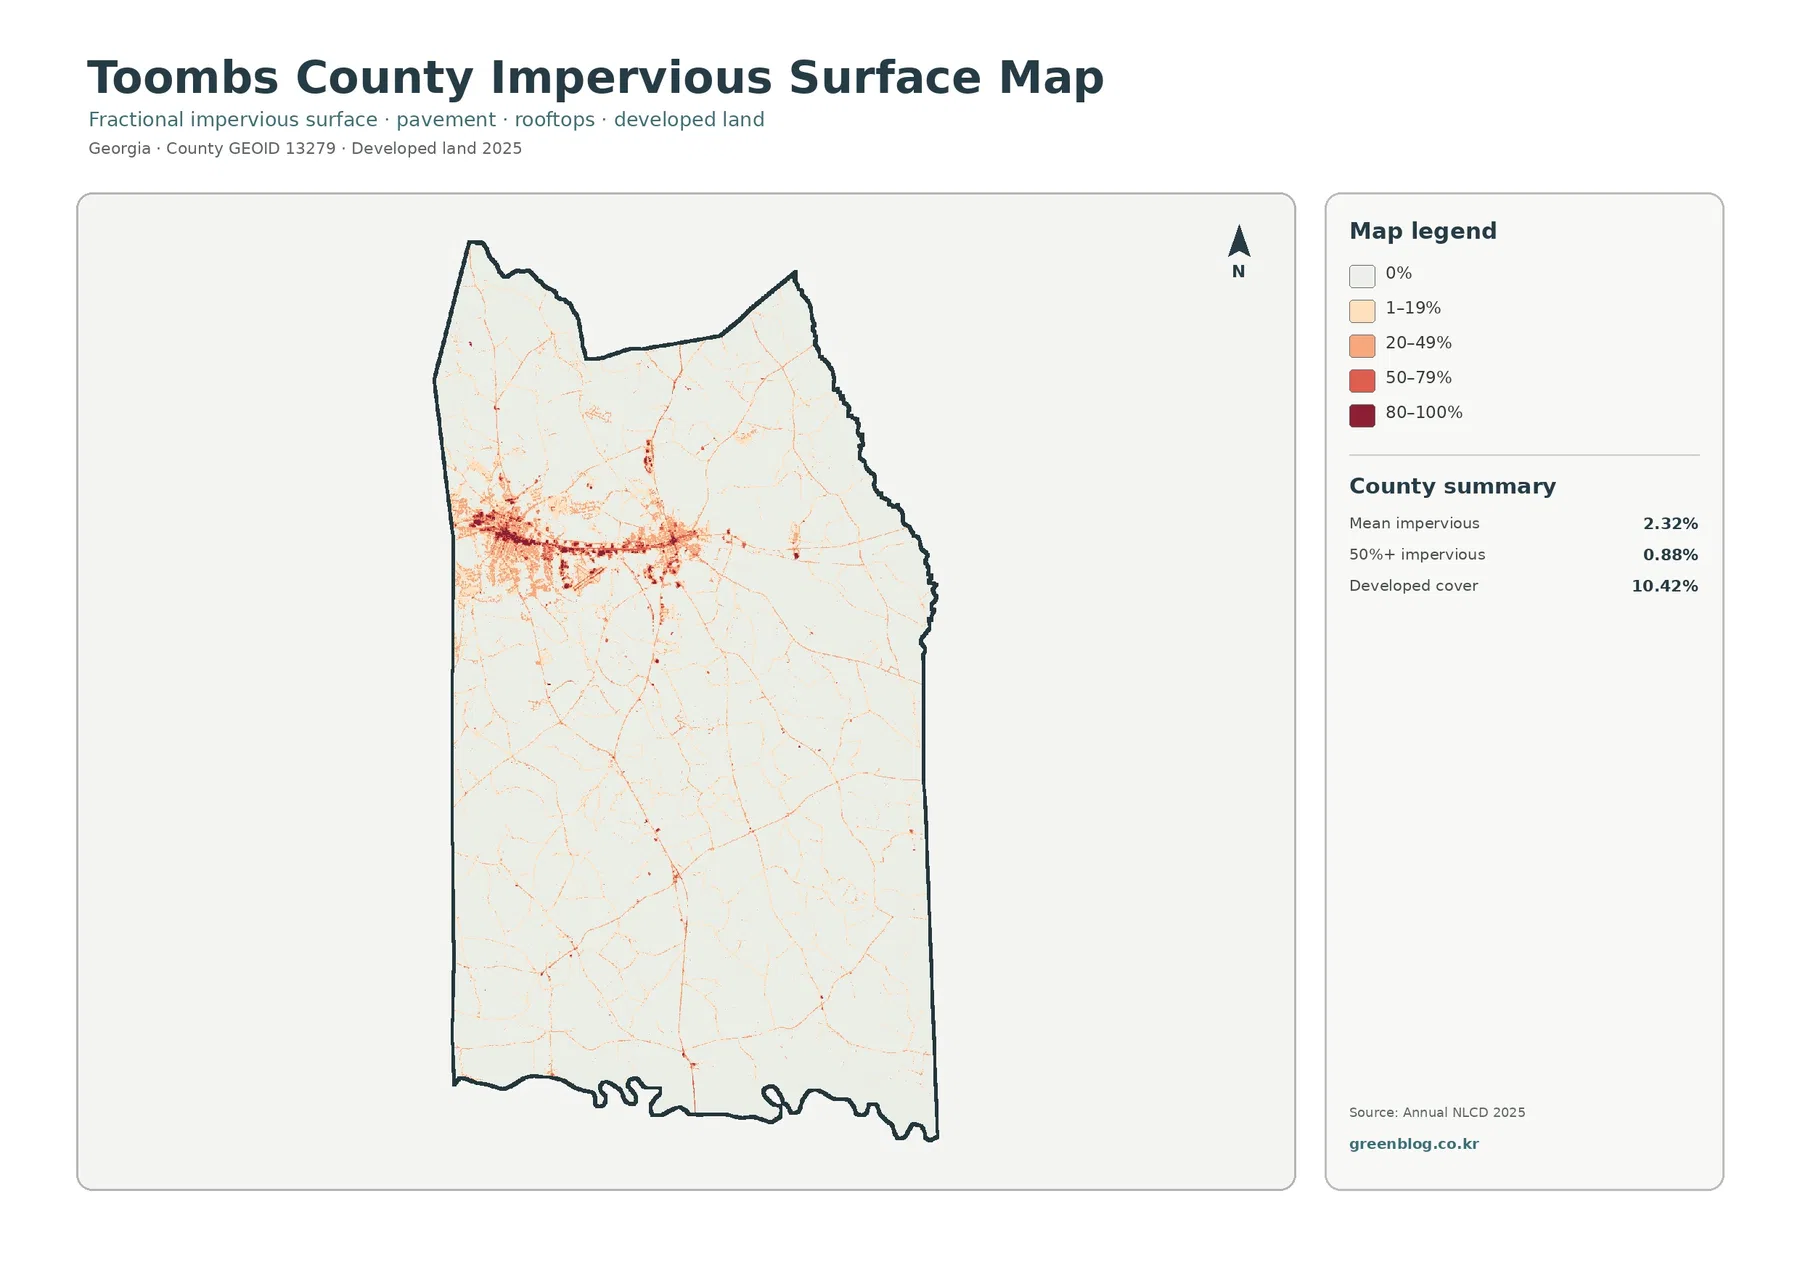
The darkest cells form a compact concentration across the west-central portion of the county. From that core, narrow lines extend east and into other rural sections, while most of the southern and eastern interior remains very light. The DCA comprehensive plan describes commercial and other growth around Vidalia and Lyons, including the U.S. 280 area and corridors connecting the communities. The similarity in location is useful context, but the map preview has no road labels, so this article does not assign a specific highway name to every line of impervious pixels.
Impervious percentage should not be read as a direct runoff or flood-risk calculation. A hard surface can increase the amount of rainfall that stays above ground, but actual runoff also depends on rainfall, soil, slope, drainage infrastructure, vegetation, and local site design. This map is best used to compare the relative concentration of hard surfaces across the county. Parcel-level stormwater design or flood decisions require more detailed engineering and hydrologic information.
| Impervious and developed summary | Share |
|---|---|
| Mean impervious surface | 2.32% |
| Area at 50%+ impervious | 0.88% |
| 2025 developed cover | 10.42% |
Forest and farmland are interwoven with wet corridors rather than separated into clean zones
A different pattern becomes easier to see after developed and miscellaneous cover are muted on the forest-and-farmland map. Agricultural yellow is widespread, but it repeatedly breaks around dark forest blocks and teal wetlands. The western and northern parts contain many farm patches, while the eastern and southern portions show long natural-cover pieces mixed with agriculture. The result is a mosaic in which field edges, wooded cover, grass and shrub areas, and wet ground meet frequently.
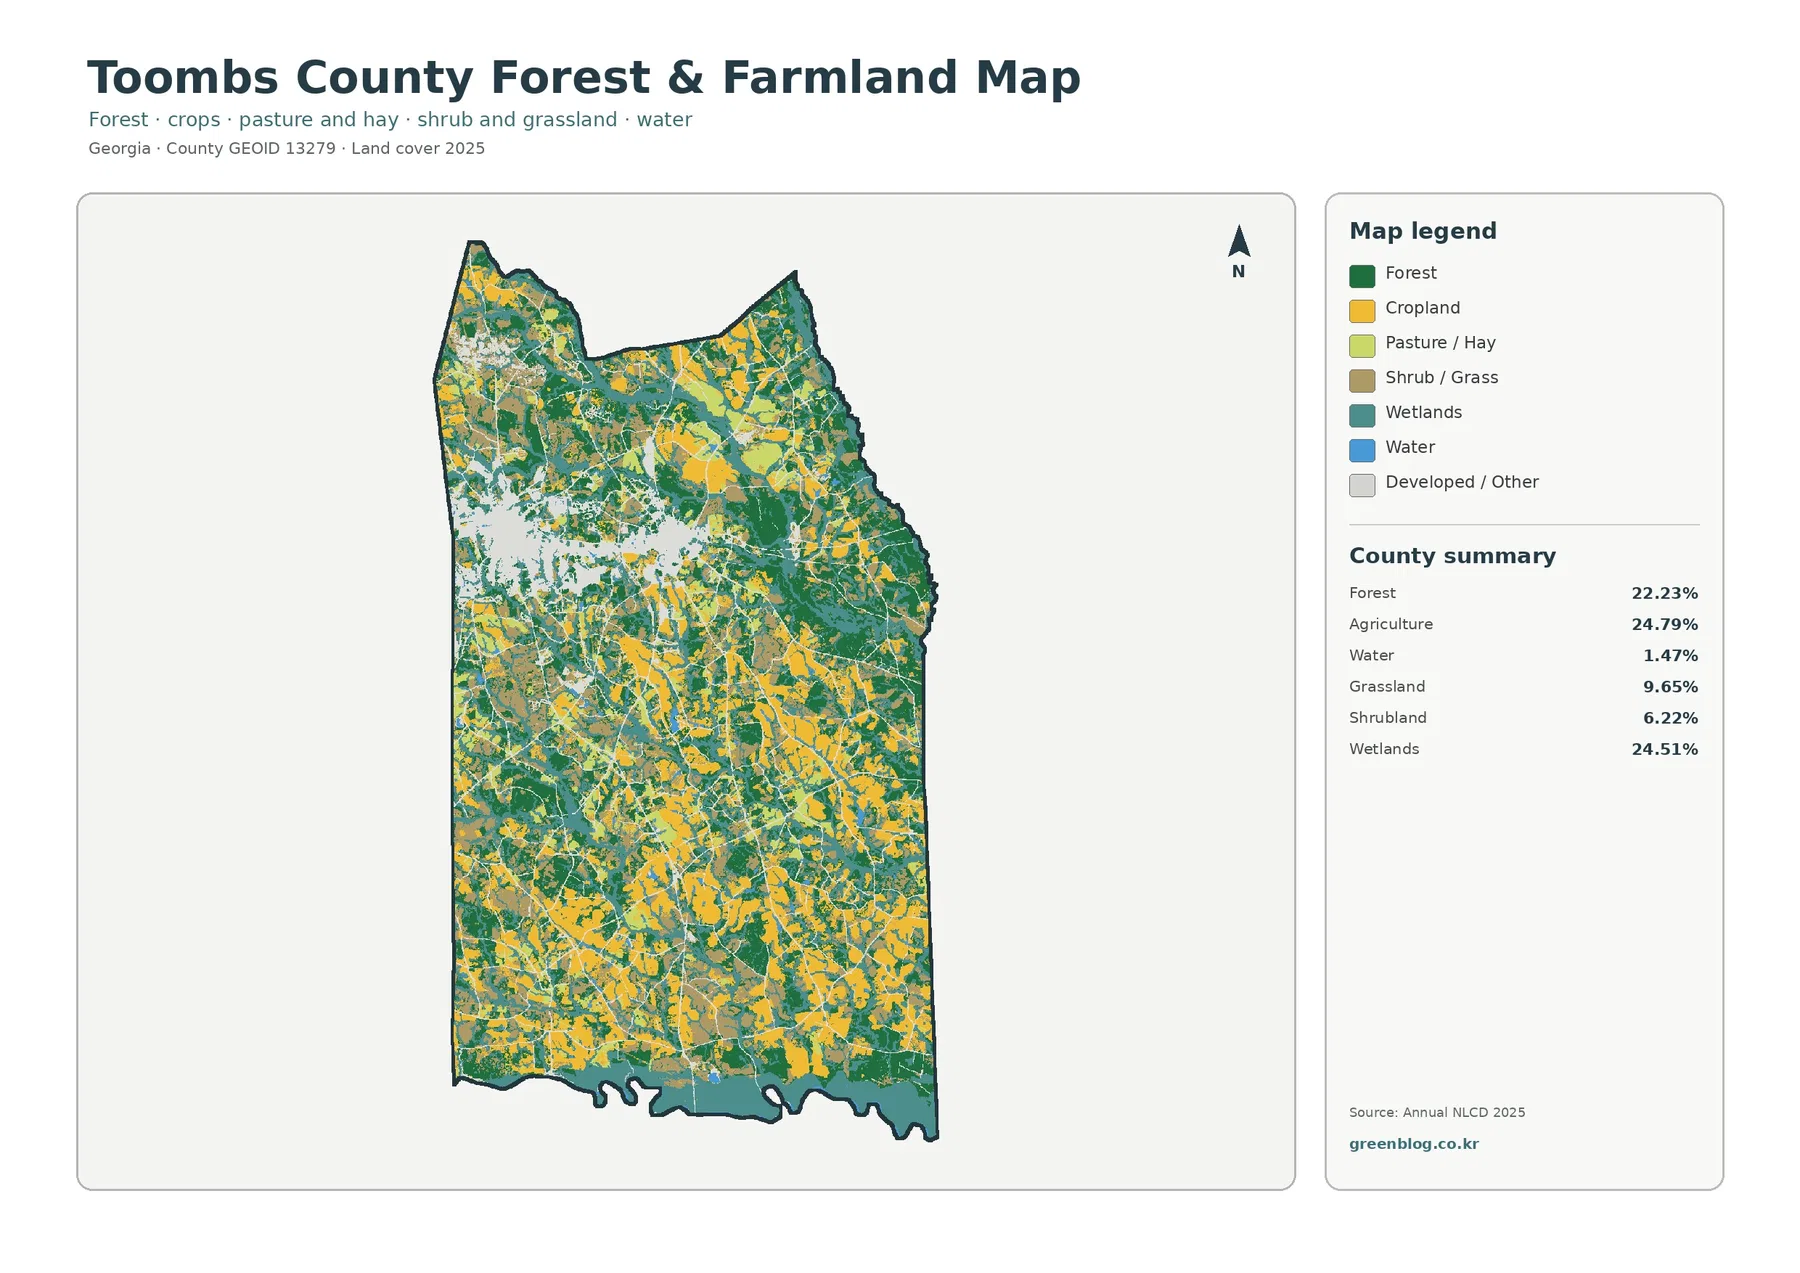
UGA Extension Toombs County lists agriculture among its local educational programs and offers research-based advice for production crops. That source confirms agriculture as an important local subject, but it does not allow the yellow NLCD cells to be assigned to individual crops. A land-cover map cannot distinguish a Vidalia onion field from another crop simply by its agricultural color. Crop identity, planting rotation, irrigation, and farm management require agricultural statistics or field-level records that are outside this package.
Forest needs the same caution. A forest-class cell indicates tree-dominated cover, not who owns the land, which species are present, whether timber is managed, or whether the site is protected. Wetland classification also does not define a regulatory wetland boundary. The forest-and-farmland view works well for county-scale comparisons, habitat discussions, or showing where natural cover intersects the agricultural landscape, but legal or parcel questions need the relevant official datasets.
A continuous-looking band of wetlands and water is visible along parts of the southern edge, and wet cover also threads through the interior. Toombs County planning material identifies the Altamaha River among important natural resources, but the supplied map contains no hydrographic labels. For that reason, this article describes the visible southern wet-and-water pattern without naming every mapped channel. Matching a specific river or stream to the raster should be done with a labeled hydrography layer.
Why 37.14% mapped class difference is not a 37.14% urbanization rate
The 1985–2025 change map summarizes cells whose class differs between the two mapped years. The overall class-difference value is 37.14%. Within that total, 2.90% is classified as developed change, 12.75% as forest loss, 9.46% as agricultural loss, and 9.90% as other difference. A wetland-difference color is included in the legend, but the supplied summary does not list a separate percentage for it, so no residual value has been calculated.
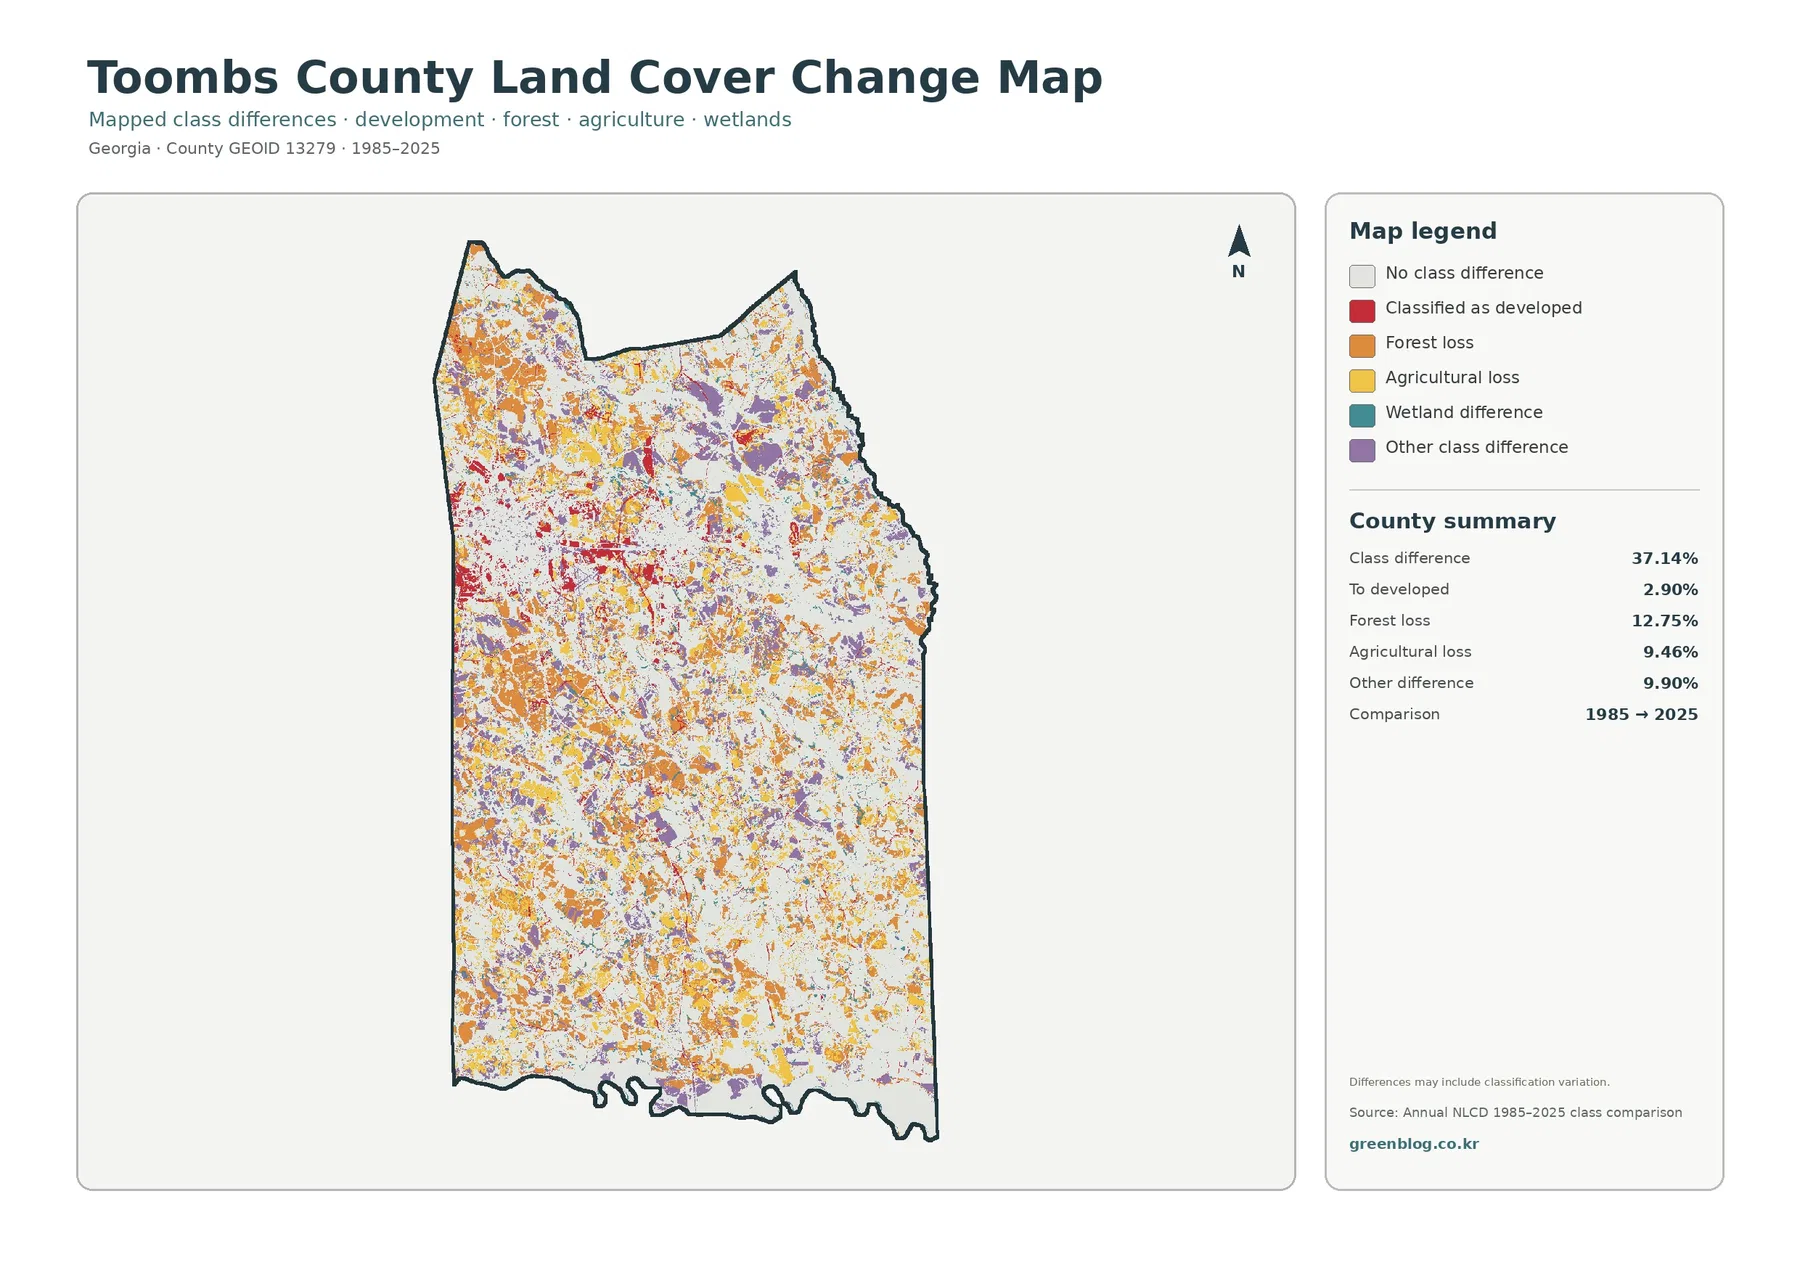
Orange forest-loss cells and yellow agricultural-loss cells are scattered widely instead of forming one simple front. Red developed-change cells become more noticeable around the current west-central developed concentration, while several change colors remain mixed throughout rural parts of the county. This is why the 37.14% figure cannot be read as land newly converted to urban use. The explicitly mapped developed-change category is only 2.90%, and the rest includes several different kinds of class difference.
The map itself also warns that differences may include classification variation. Satellite-based comparisons can record genuine land-cover change, but boundary cells, mixed pixels, seasonal conditions, and classification methods can influence which class is assigned in a given year. A small patch that changes color is therefore a clue to investigate, not a deed-level history of land conversion. Recent aerial photography or local records are better sources when the history of a specific site matters.
| 1985–2025 mapped change summary | Share |
|---|---|
| Total class difference | 37.14% |
| Classified as developed | 2.90% |
| Forest loss | 12.75% |
| Agricultural loss | 9.46% |
| Other class difference | 9.90% |
The current-cover map and the change map answer two separate questions. Developed cover at 10.42% describes the 2025 surface, while 2.90% describes cells placed in the developed-change category between 1985 and 2025. Likewise, 22.23% forest is a current share, whereas 12.75% forest loss is a mapped comparison category. Keeping the year and legend visible prevents these values from being combined or compared as though they measured the same thing.
Local planning context explains the west-central focus without turning NLCD into a zoning map
The Toombs County comprehensive-plan archive covers the county together with Lyons, Santa Claus, and Vidalia. Its planning documents describe a concentration of growth in the Greater Vidalia/Lyons area and along important transportation corridors. That official context is useful because the impervious and developed maps also place their strongest concentration in the west-central part of the county. Still, a comprehensive-plan map and an NLCD raster are built for different purposes, and neither should be substituted for the other.
The same documents describe agriculture, forestry, conservation, and natural resources as important parts of the county’s rural character. That statement fits the broad visual balance of agriculture, forest, and wetlands on the 2025 map, but it should not be turned into a causal claim about individual pixels. The land-cover image tells us what surface class was mapped at a location. Planning documents explain community policy and development context. Keeping those roles separate lets the article add local meaning without overstating what the map proves.
Administrative names also need care. The provided map does not draw the city limits of Vidalia, Lyons, or Santa Claus, even though those places appear in official county planning material. If a presentation needs to label a particular developed patch with a municipal name, a Census TIGER/Line boundary layer or another official municipal boundary should be added. The raster alone is enough to describe the pattern of development, but not to place every pixel inside a named city.
Choosing the map that matches the question
For a first look at Toombs County, the general map is the best starting point because it shows how closely agriculture, wetlands, and forest compete in area. The forest-and-farmland view becomes more useful when the question is about field patterns and natural cover around them. The impervious map isolates the built core and hard-surface corridors, making the difference between a developed classification and truly hard surfaces easier to explain. The change map should come last because its colors describe differences between years rather than the present landscape.
A classroom lesson on rural land cover may only need the general map and the forest-and-farmland map. A presentation about the Vidalia–Lyons built area benefits more from pairing the general map with the impervious view. A long-term comparison should place the current map beside the change map and state clearly that 37.14% total class difference is not 37.14% new development. Selecting maps by question is more effective than shrinking all four onto one page where the legends and summary values become hard to read.
The four maps also work as a consistency check. Agriculture and wetlands are large on the general map and remain visually important when the simplified rural-cover view is used. Developed land is easy to see on the general map, but the impervious map shows that the hardest surfaces occupy a much smaller share. The change map then demonstrates that long-term class differences occur far beyond the built core. Each view corrects a possible overinterpretation of the previous one.
Four original JPG maps in one ZIP
The on-page previews are 1800×1273 WebP files. The download archive contains four original JPG maps, each 2480×1754 pixels, covering current land cover, forest and farmland, impervious surface and developed land, and 1985–2025 land-cover change. The asset manifest does not mark these files as meeting an A3 high-resolution reference, so a test print is sensible before using them for a large poster. For documents, slides, and on-screen comparison, the original JPG dimensions provide more room than the preview versions.
Keep the title, year, and legend with the image when the files are cropped or placed into a document. Red on the current land-cover map marks developed land, while red on the change map marks cells classified as developed change between 1985 and 2025. Removing the legends can make the 10.42% current developed share and the 2.90% developed-change value appear to describe the same thing. They do not.
If only one map is needed, choose the one that carries the relevant evidence instead of using all four by default. The simplified rural-cover map is clearer for agriculture, forest, and wetlands. The impervious view is clearer for hard surfaces. The change map is appropriate only when the time comparison is part of the question. When all four are used together, leave enough space for the legends and county summaries to remain readable.
Scale, classification, and other limits to remember
Annual NLCD land cover is classified in raster cells of about 30 meters. A single cell can contain a road edge, vegetation, a building, a ditch, and part of a field, so the assigned class is a generalized representation rather than a parcel survey. Small streams, narrow tree lines, and isolated structures may be simplified or mixed with neighboring cover. The maps are strongest for county-scale pattern comparison, not for locating a legal boundary to the nearest property line.
Land cover should also remain separate from land use. A cell mapped as agriculture does not establish zoning, crop ownership, or a legal agricultural designation. A developed cell does not guarantee buildability. Forest does not identify timber ownership or conservation status, and wetland classification does not replace a jurisdictional wetland determination. Property transactions, permitting, drainage design, and regulatory questions require the appropriate local and agency records.
The current map summarizes 2025, while the change map compares 1985 with 2025. Construction, clearing, farming changes, or vegetation recovery after 2025 are not represented. Anyone checking a specific recent site should add newer aerial imagery or field information. For the broader question of how Toombs County is divided among agriculture, wetlands, forest, and a compact developed core, the four supplied maps provide complementary views at a consistent county scale.
Every percentage quoted here comes directly from the summaries printed on the supplied maps. No acreage, barren-land share, wetland-change percentage, crop mix, or parcel statistic has been inferred from the remaining percentage. External sources are used only for county-specific context, administrative names, and planning or agricultural background. That separation keeps the numerical interpretation tied to the material that actually supports it.
Frequently Asked Questions
Which land-cover class is largest in Toombs County in 2025?
Agriculture is the largest at 24.79%, but wetlands are almost equal at 24.51%. Forest accounts for 22.23%, so all three major rural classes exceed 20%. Developed cover is 10.42%, grassland 9.65%, shrubland 6.22%, and water 1.47% in the supplied summary.
Why is developed cover 10.42% while mean impervious surface is only 2.32%?
Developed land can include lawns, trees, soil, and other surfaces that still absorb some water. The impervious map isolates roofs, pavement, and similarly hard surfaces, so its countywide mean is much lower. Only 0.88% of the county is mapped at 50% impervious or higher.
Does the 37.14% 1985–2025 class difference mean 37.14% of Toombs County urbanized?
No. The developed-change category is 2.90%. The 37.14% total also includes 12.75% forest loss, 9.46% agricultural loss, 9.90% other class difference, wetland differences, and possible classification variation noted on the map.
Map File Information
The ZIP contains four original JPG maps for Toombs County: 2025 land cover, forest and farmland, impervious surface and developed land, and 1985–2025 land-cover change.
- Printable Size: 2480×1754 pixels each
- Intended Use: documents, lessons, slide graphics, and county-scale reference
Related Maps
- Appling County Georgia Land Cover Map
- Atkinson County Georgia Land Cover Map
- Bacon County Georgia Land Cover Map
Sources and references
- MRLC Annual NLCD Data – Official access point for the Annual NLCD land-cover and impervious-surface data used by the supplied maps.
- USGS Annual NLCD Land Cover Classification – Explanation of Annual NLCD land-cover classes and their interpretation.
- U.S. Census Bureau TIGER/Line Shapefiles – Official boundary and road datasets useful for adding labeled administrative context.
- UGA Extension Toombs County – County-specific agricultural, horticultural, and research-based production-crop services.
- Toombs County Comprehensive Plan — Georgia DCA – Official planning archive for Toombs County with Lyons, Santa Claus, and Vidalia.
- Toombs County Commission – Official county-government information and administrative contacts.
Green Map creates custom-edited map images using open geographic data sources such as geoBoundaries, Natural Earth, OpenStreetMap, and government open data. These maps are edited visual materials, not raw data files, and are provided for education, documents, presentations, and graphic reference.