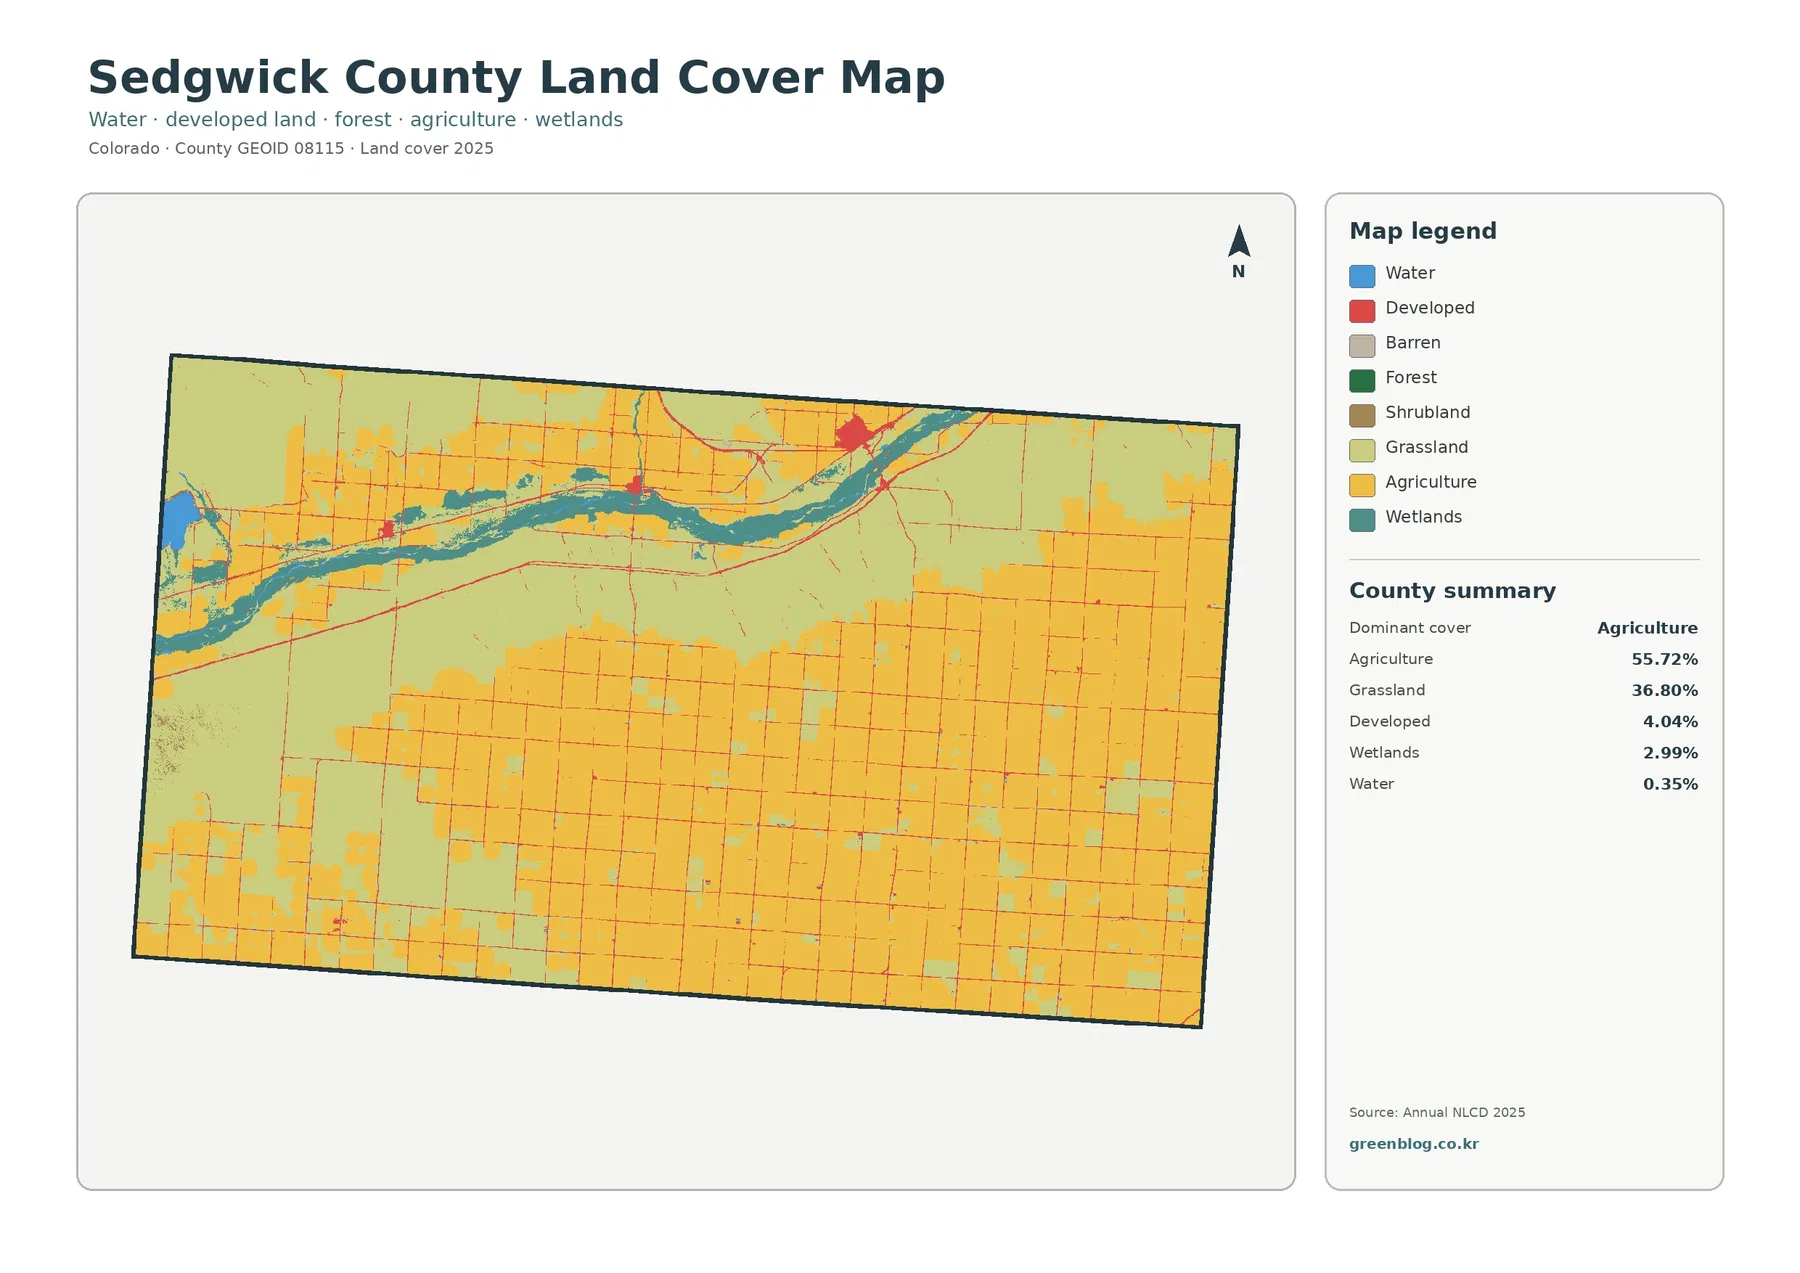
Sedgwick County sits at Colorado’s far northeastern corner, where broad agricultural fields and open grassland cover most of the county while the South Platte River creates a narrower wet corridor across the north. The four maps on this page separate those patterns into current land cover, forest and farmland, impervious and developed surfaces, and mapped class differences from 1985 to 2025.
The original four JPG maps are available together in one ZIP download. They are useful when you want a printable county reference, a simple comparison of farmland and grassland, a closer look at the small developed footprint around Julesburg and nearby towns, or a visual summary of where land-cover classifications differ between the two comparison years.
Table of Contents
A narrow river corridor inside a broad plains county
The South Platte River is the clearest natural line on the land-cover map. It crosses the northern part of the county in a winding band of water and wetlands, standing out against much larger blocks of agriculture and grassland. The county summary lists wetlands at 2.99% and water at only 0.35%, yet those small shares matter because they are concentrated along a recognizable corridor rather than scattered evenly across the county.
A USGS stream-monitoring site at Julesburg identifies this reach as part of the Lower South Platte. That geographic setting matches the map: the river and wetland band approaches the northeastern part of the county near Julesburg, while open and agricultural cover extends much farther south. The map supports a statement about where these features occur together, but it does not by itself prove why settlement, roads, or land-cover classes developed in those locations.
The river corridor also breaks up the otherwise strong field-grid pattern. Farmland in many parts of Sedgwick County appears in straight-edged blocks, whereas the wetland and water classes bend with the river and adjoining low areas. That contrast is useful when reading the map at a glance because it separates a natural drainage feature from the more regular geometry of cultivated land.
What the 2025 land-cover totals say
Agriculture is the dominant 2025 class at 55.72%, followed by grassland at 36.80%. Together they account for more than nine-tenths of the mapped county. Developed cover is 4.04%, wetlands are 2.99%, and water is 0.35%. Those numbers explain why the overall map is visually dominated by agricultural yellow and grassland green while the developed and wet classes appear as much smaller clusters or bands.
The distribution is not a simple north-versus-south split. Large agricultural blocks occur across much of the county, especially through the southern and eastern portions, while grassland forms broad areas between and around those blocks. Near the South Platte, agricultural cover, grassland, wetlands, water, and small developed areas sit close together, producing a more varied pattern than the county’s open southern plains.
Land cover should not be confused with zoning or parcel-level land use. Annual NLCD classifies the surface seen in satellite-based data into broad categories such as agriculture, grassland, water, wetlands, and developed cover. A pixel classified as agriculture does not identify the crop being grown, the property owner, the legal zoning, or whether the parcel can be developed.
Farmland blocks stand out when the legend is simplified
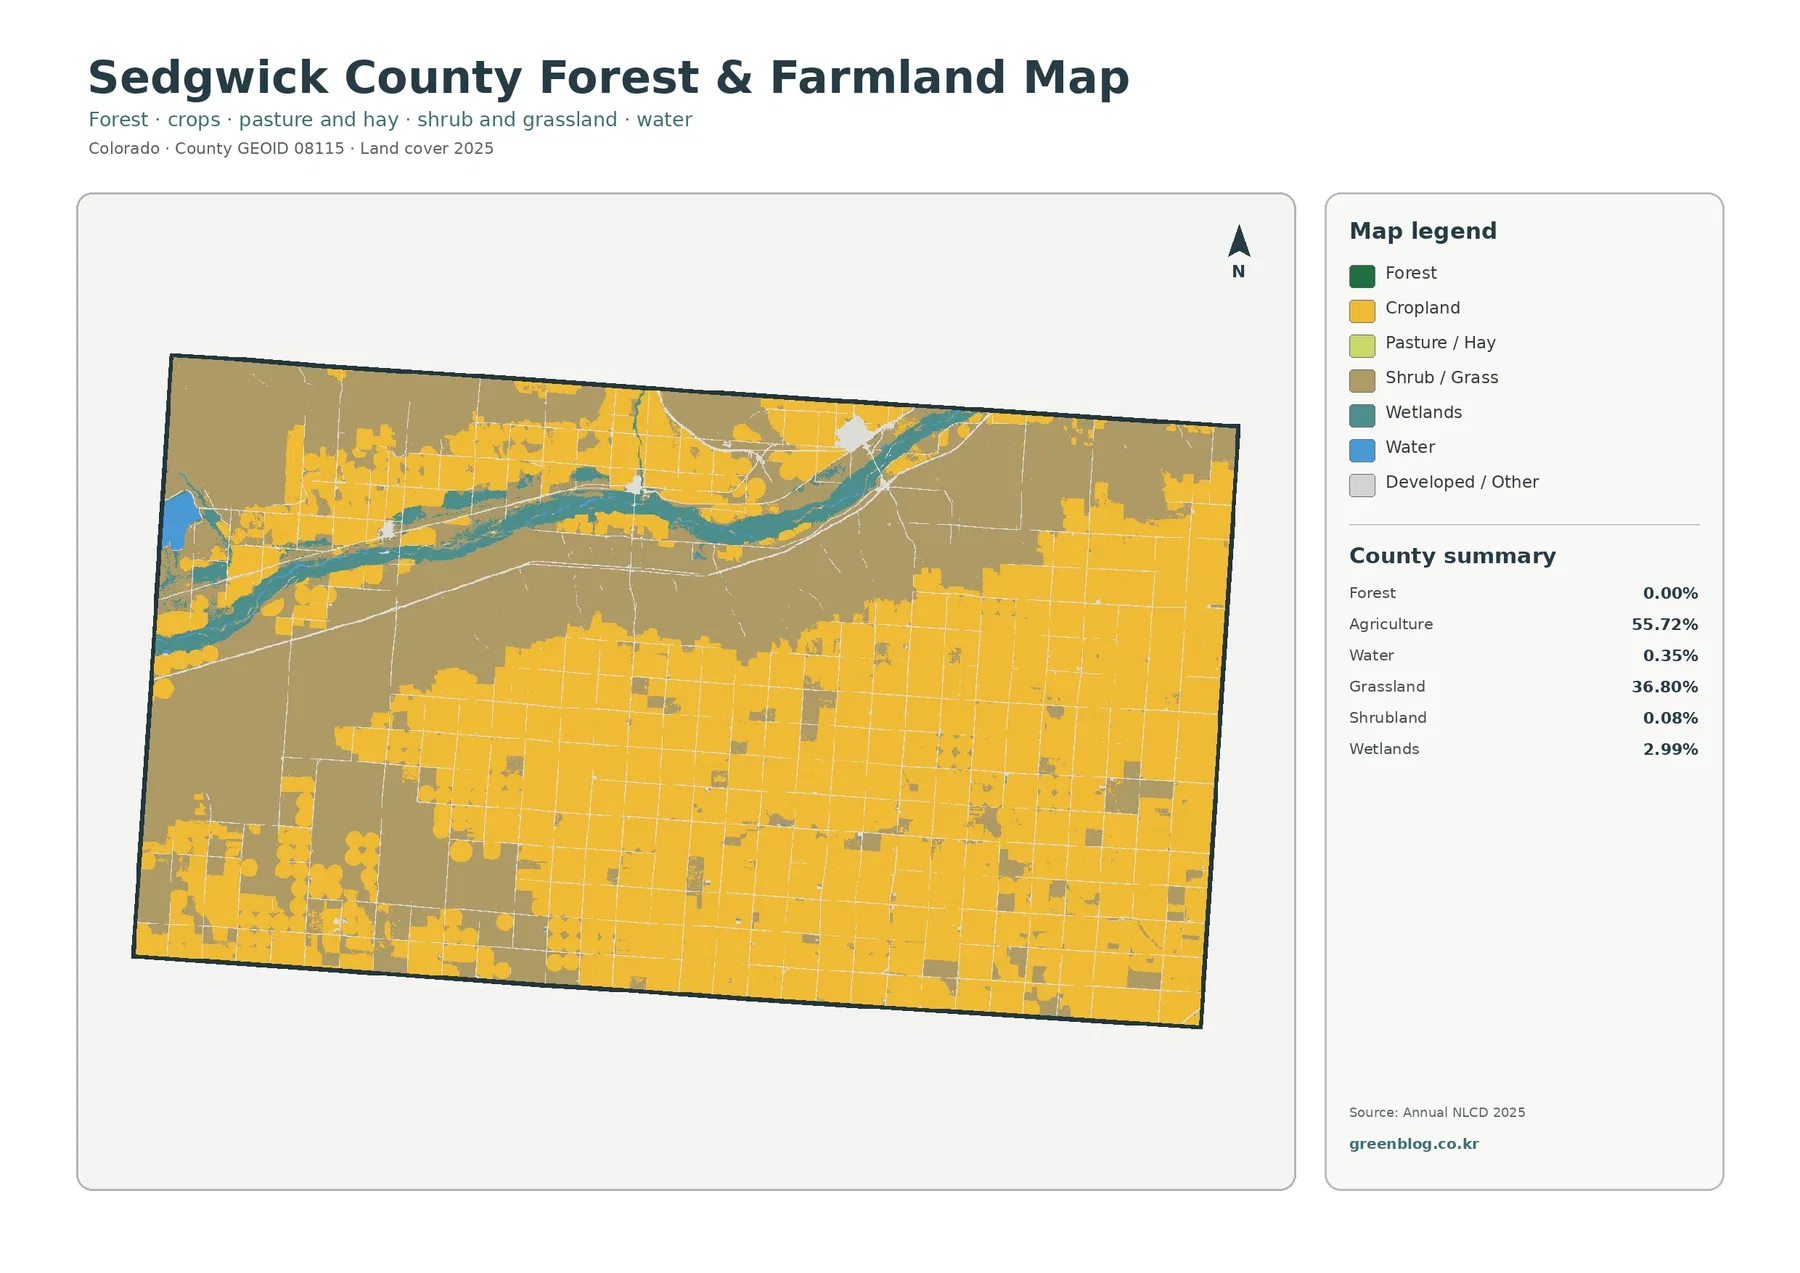
The forest-and-farmland view removes some of the detail from the general map and makes the county’s two dominant open-land patterns easier to compare. Cropland appears in large yellow blocks, while grass and shrub classes occupy broad tan-green areas between them. The river remains visible as a narrow wetland-and-water feature, so the map works well when the main question is how agricultural ground relates to open grassland and the river corridor.
The county summary on this map reports forest at 0.00% and shrubland at 0.08%. That is a major contrast with many mountain counties in western Colorado, but 0.00% should not be read as proof that no trees exist anywhere in Sedgwick County. Small riparian trees, windbreaks, or trees inside towns can be mixed with other surface types inside a 30-meter pixel and may not appear as a separate forest class in the county summary.
Agricultural cover is widespread but not continuous. Some places show large neighboring crop blocks, while other areas contain a patchwork of cropland and grass. That mosaic is important because a county-level percentage alone cannot show whether farmland is concentrated in one zone or spread across many separate areas. Here, the map makes clear that farming is extensive while grassland still occupies substantial uninterrupted sections.
Along the South Platte, the simplified map is especially useful because wetlands remain visible between agricultural and open-land classes. Instead of focusing on every developed class, the reader can follow the river’s wet margins and see where cropland approaches that corridor and where grassland is more prominent.
Julesburg is the clearest developed footprint
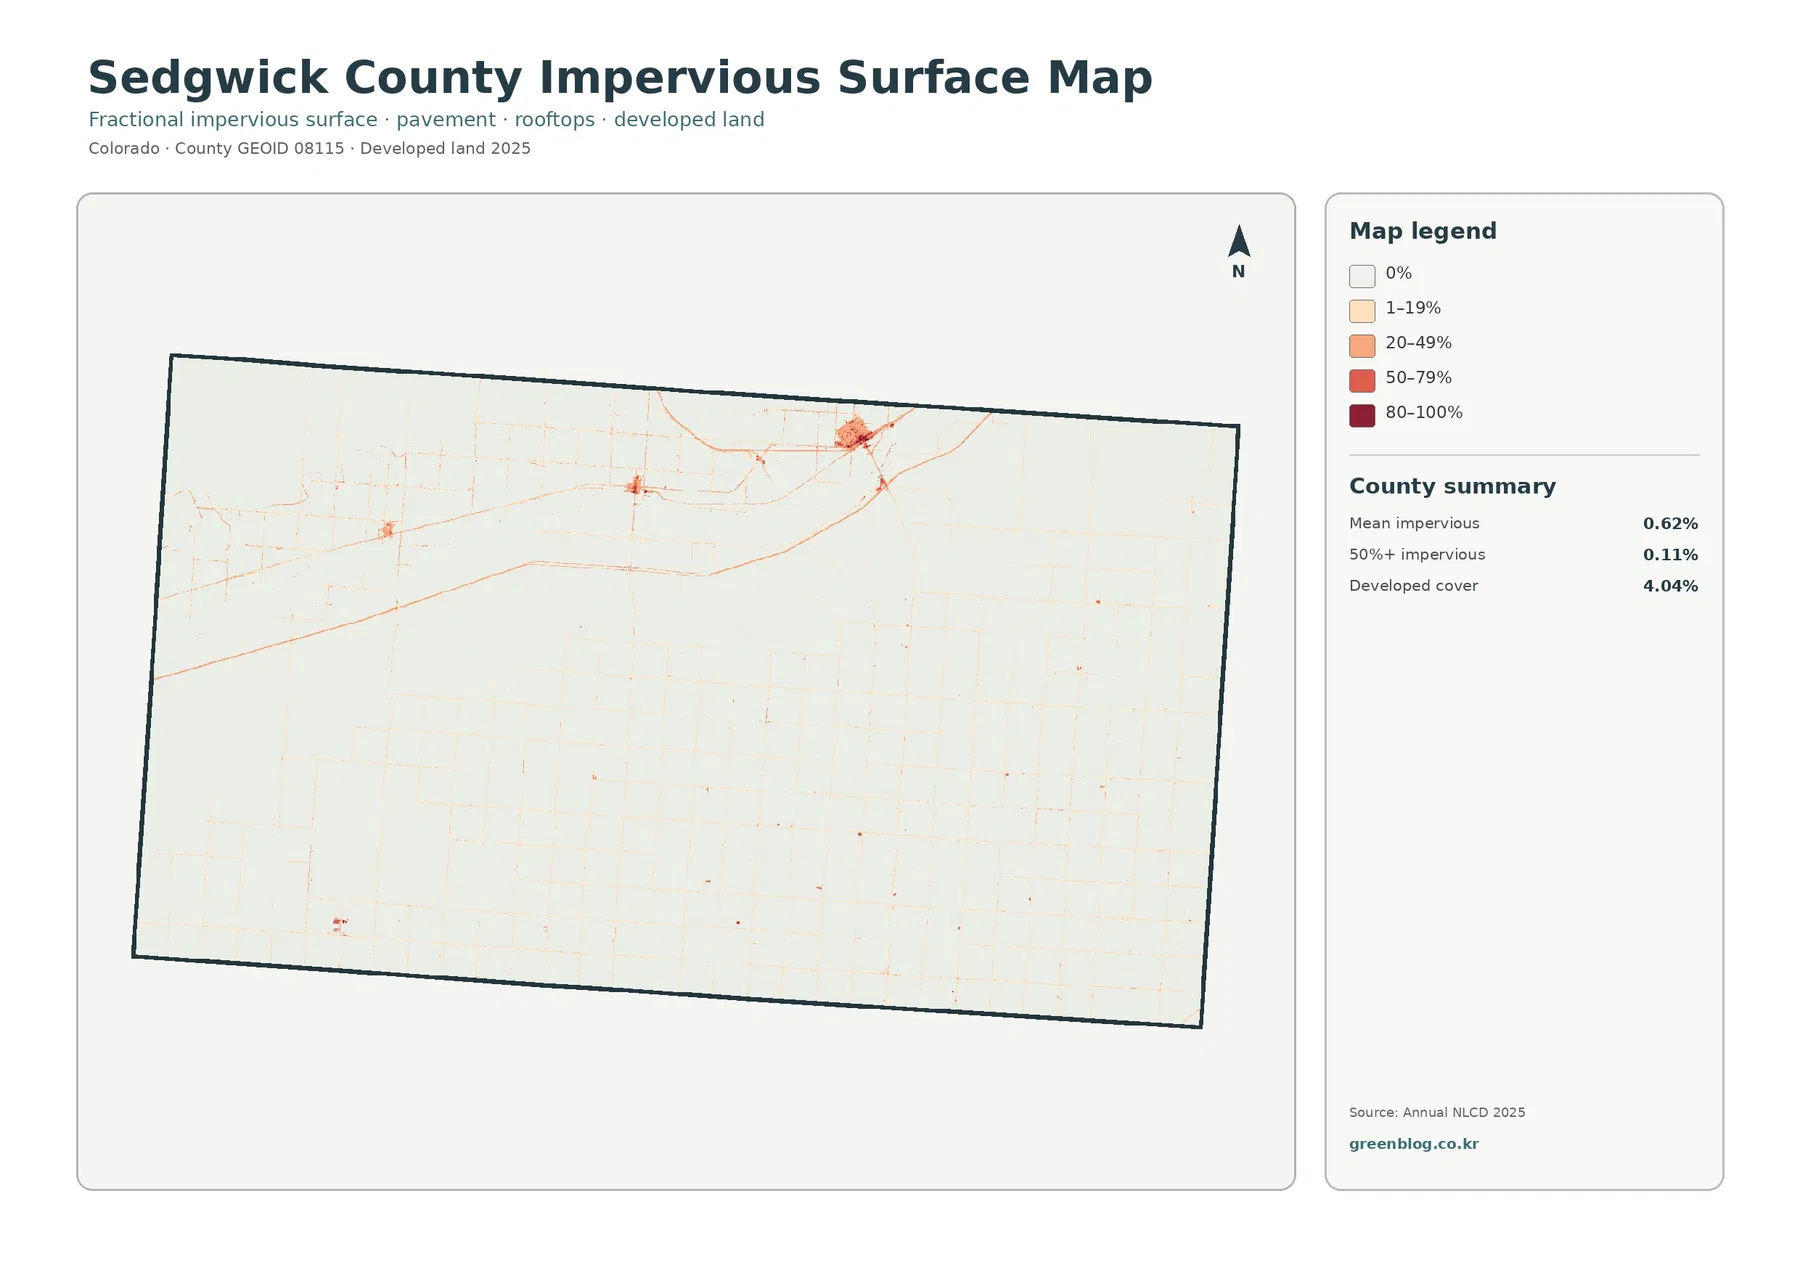
Impervious surface means pavement, rooftops, and other hard surfaces that do not readily absorb rainfall. Sedgwick County’s mean impervious value is only 0.62%, and just 0.11% of the county is mapped at 50% impervious or higher. Most of the county therefore appears very light on the impervious map, which fits the broad agricultural and grassland pattern seen in the other views.
The strongest concentration is around Julesburg in the northeast. A compact cluster of higher impervious values marks the town’s street and building area, and smaller concentrations appear farther west around Ovid and Sedgwick. Thin linear traces link parts of the county road network, making transportation features easier to notice here than on the general land-cover map.
Colorado Department of Transportation records confirm that I-76 runs through Sedgwick County toward Julesburg and the Nebraska state line. The impervious map shows a northern transportation corridor that overlaps the same general part of the county as the towns and the South Platte. It is still important not to label every thin line from this map alone; an official road map is the better source when an exact route name is required.
Developed cover and impervious percentage are related but not identical measurements. The general land-cover map lists developed cover at 4.04%, while the impervious map reports a countywide mean of 0.62%. A developed pixel can still contain vegetation, soil, or other permeable surfaces, so the entire developed class should not be treated as pavement. The impervious map adds detail by showing how much of each mapped area is actually hard-surfaced.
The 1985–2025 map highlights classification differences, not a complete history
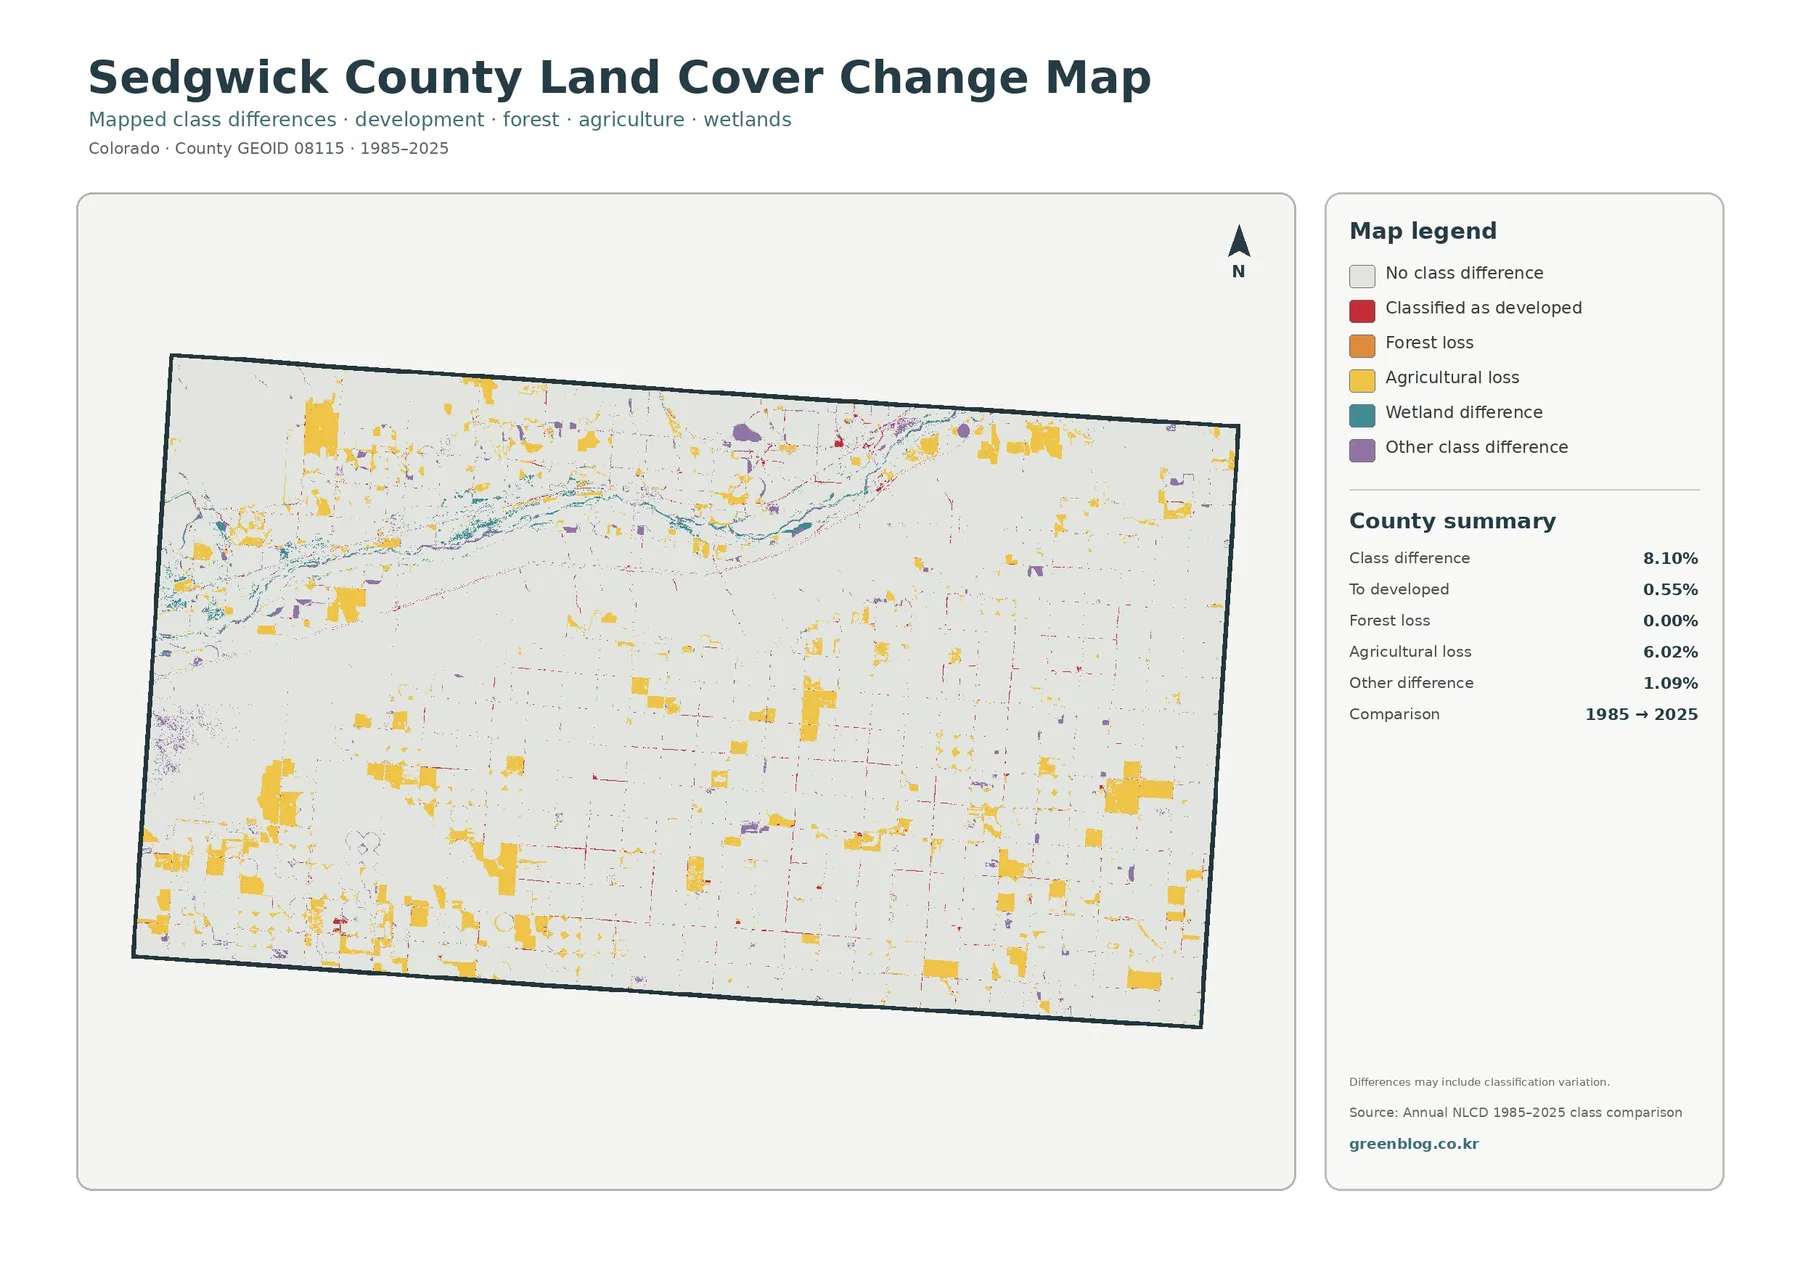
The change map compares the 1985 and 2025 land-cover classifications. Its summary reports a class difference across 8.10% of the county. The largest named category is agricultural loss at 6.02%, while 0.55% is classified as change to developed land, 1.09% falls into other class differences, and forest loss is listed at 0.00%.
Agricultural-loss colors appear as a mixture of scattered blocks and smaller patches across the county rather than as one continuous zone. Several larger patches occur in the southern half, with additional differences in the west and north. The developed-change category is much smaller and more often follows narrow or compact patterns near roads and settlement areas.
Those colors should be interpreted cautiously. The map itself notes that differences may include classification variation. Annual NLCD is a classified raster product, so changes in imagery, seasonal conditions, mixed pixels, or the model’s class assignment can produce a different label even when the on-the-ground situation is more complicated than a simple gain or loss.
For that reason, the 6.02% agricultural-loss category is not the same as a verified statement that 6.02% of Sedgwick County’s farmland permanently disappeared. A stronger analysis would compare multiple Annual NLCD years and then check aerial imagery, agricultural records, or other local data for the locations of interest. The supplied map is best used as a screening and comparison layer that points to places worth examining more closely.
Reading the four views as one county story
Each map answers a different part of the same geographic question. The general map establishes the farm-and-grassland dominance and the South Platte wet corridor. The forest-and-farmland view makes the agricultural mosaic easier to compare. The impervious map pulls small towns and road traces out of a mostly rural background, while the change map identifies pixels whose class differs between 1985 and 2025.
Julesburg is a good example of why the maps work better together. It occupies only a small part of the county on the general map, but its built footprint becomes the most obvious concentration on the impervious view. The South Platte is almost the opposite: its share of total area is small, yet it remains visually prominent because wetlands and water form a long connected band.
The southern agricultural blocks provide another useful comparison. They are among the strongest features on the current land-cover and farmland maps, but the change map does not mark the entire agricultural region as different. Only selected blocks and patches carry a change color. Current abundance and long-term class difference are therefore separate ideas and should not be combined into one trend statement.
How to choose the most useful map
For a general county reference, start with the 2025 land-cover map. It keeps agriculture, grassland, developed cover, wetlands, and water in one view and is the easiest option for showing the overall pattern. It is also the best first map for a classroom handout or presentation because the other three views make more sense after the reader has seen the countywide context.
Use the forest-and-farmland map when the main comparison is cropland versus open grassland. It reduces visual clutter and makes the field pattern easier to follow. For settlement and transportation questions, the impervious map is more informative because small built areas that are easy to overlook on the general map become visible as concentrated warm-colored patches and lines.
Choose the 1985–2025 change map when the task is to locate possible areas of land-cover difference over time. The safest wording is “mapped class difference” or “change in classification” unless another source confirms the cause. A red or yellow pixel tells you that the two selected years differ in the map product; it does not tell you the full sequence of events between those years.
Scale, pixels, and what these maps cannot show
Annual NLCD is a raster dataset derived from Landsat imagery at 30-meter spatial resolution. In practical terms, the landscape is represented by a grid of 30-meter cells, and each cell receives a classification or surface value. This is detailed enough to compare countywide patterns, but it is not a parcel survey and should not be used to draw legal boundaries.
Mixed pixels are especially important along the South Platte and around small towns. A single 30-meter cell may contain part of a road, vegetation, bare ground, and a building, yet the land-cover layer still assigns a dominant class. Narrow channels and wetland edges can therefore look wider, blockier, or more stepped than they appear in a high-resolution aerial image.
The same limitation applies to imperviousness. Small rural roads and isolated structures may be represented weakly or not at all, while a compact town such as Julesburg produces a clearer signal because many hard surfaces occur close together. The map is useful for regional context, not for measuring a driveway, building footprint, or property-level drainage condition.
The year also matters. The current land-cover maps represent 2025 classification results. Construction, field conditions, or other surface changes after that observation period will not appear. The change map compares only 1985 with 2025, so a location that changed in an intermediate year and later returned to its earlier class may not stand out in a simple endpoint comparison.
A few numbers worth keeping beside the map
For current land cover, the key figures are agriculture 55.72%, grassland 36.80%, developed 4.04%, wetlands 2.99%, and water 0.35%. The forest-and-farmland summary adds forest at 0.00% and shrubland at 0.08%. These values reinforce the visual impression of a plains county where cropland and grassland dominate and the wetter classes are concentrated rather than widespread.
For the developed-surface view, mean imperviousness is 0.62% and the area mapped at 50% impervious or higher is 0.11%. For the 1985–2025 comparison, 8.10% of the county is marked as a class difference, including 6.02% in the agricultural-loss category and 0.55% classified as change to developed. Because the figures come from different map products, they should be read within their own legends rather than added together.
Location gives the percentages meaning. Wetlands are only a small countywide share, yet they form a long South Platte band. Developed cover is also limited in area, but it concentrates around Julesburg and smaller towns instead of being evenly distributed. Those contrasts are why the maps provide more information than a table of percentages alone.
The JPG files include their own legends and county summaries, so they can be read without keeping this article open. The source asset manifest lists the images at 2480 × 1754 pixels and does not mark them as meeting an A3 high-resolution reference. If you plan to enlarge them substantially, check print sharpness before producing a large final copy.
Frequently Asked Questions
Why does the South Platte corridor stand out when water is only 0.35% of the county?
Water occupies a small share of the county, but it is concentrated in a long connected river corridor instead of being spread evenly. Wetlands add another 2.99% around parts of that same corridor, making the northern river zone visually prominent against the much larger agricultural and grassland areas.
Does the 0.00% forest figure mean there are no trees in Sedgwick County?
No. It means the supplied county summary reports 0.00% in the mapped forest class. Small groups of trees, riparian vegetation, windbreaks, or trees inside towns may be too small or too mixed with other surfaces to appear as a separate forest class at 30-meter resolution.
Can the 1985–2025 agricultural-loss value be treated as a measured loss of farmland?
Not by itself. The 6.02% value is a mapped classification category between two endpoint years, and the map warns that classification variation may be included. Confirming permanent farmland loss would require additional years, imagery, and local or agricultural records.
Map File Information
Use the ZIP below to save the four Sedgwick County land-cover maps as JPG files. The package contains the same four map views discussed on this page.
- Included Files: Use only the versions confirmed in the article and supplied images
- File Type: Use the confirmed download contents
- Intended Use: Printing, education, presentations, and map-based projects
Related Maps
- Adams County Colorado Land Cover Map
- Alamosa County Colorado Land Cover Map
- Arapahoe County Colorado Land Cover Map
Sources and references
- MRLC Annual NLCD Data – official access point for Annual NLCD products
- USGS Annual NLCD Collection 1.2 Land Cover – official documentation for 30-meter Annual NLCD land cover and the 2025 extension
- USGS South Platte River at Julesburg, Colorado – monitoring-location information for the river in Sedgwick County
- Colorado Department of Transportation – Interstate 76 History – official route context for I-76 through Sedgwick County and Julesburg
- Colorado State University Golden Plains Area Extension – local Extension contact and agriculture resources serving Sedgwick County
- State of Colorado – Sedgwick County – state government county information
Green Map creates custom-edited map images using open geographic data sources such as geoBoundaries, Natural Earth, OpenStreetMap, and government open data.
These maps are edited visual materials, not raw data files, and are provided for education, documents, presentations, and graphic reference.