Summit County sits high in the Colorado Rockies, where forested slopes, broad shrub-covered areas, exposed alpine ground, reservoirs, and narrow developed valleys create a very different land-cover pattern from the agricultural counties on Colorado’s eastern plains. The four maps on this page show 2025 land cover, a simplified forest-and-farmland view, impervious and developed surfaces, and mapped class differences from 1985 to 2025.
The maps can be viewed on the page, and the four original JPG files are available together in one download. Use the general land-cover map for the countywide pattern, the forest-and-farmland map for a cleaner look at vegetation and water, the impervious map for roads and settlement concentrations, and the change map when the question is how classifications differ between the two comparison years.
Table of Contents
A mountain county dominated by forest and shrubland
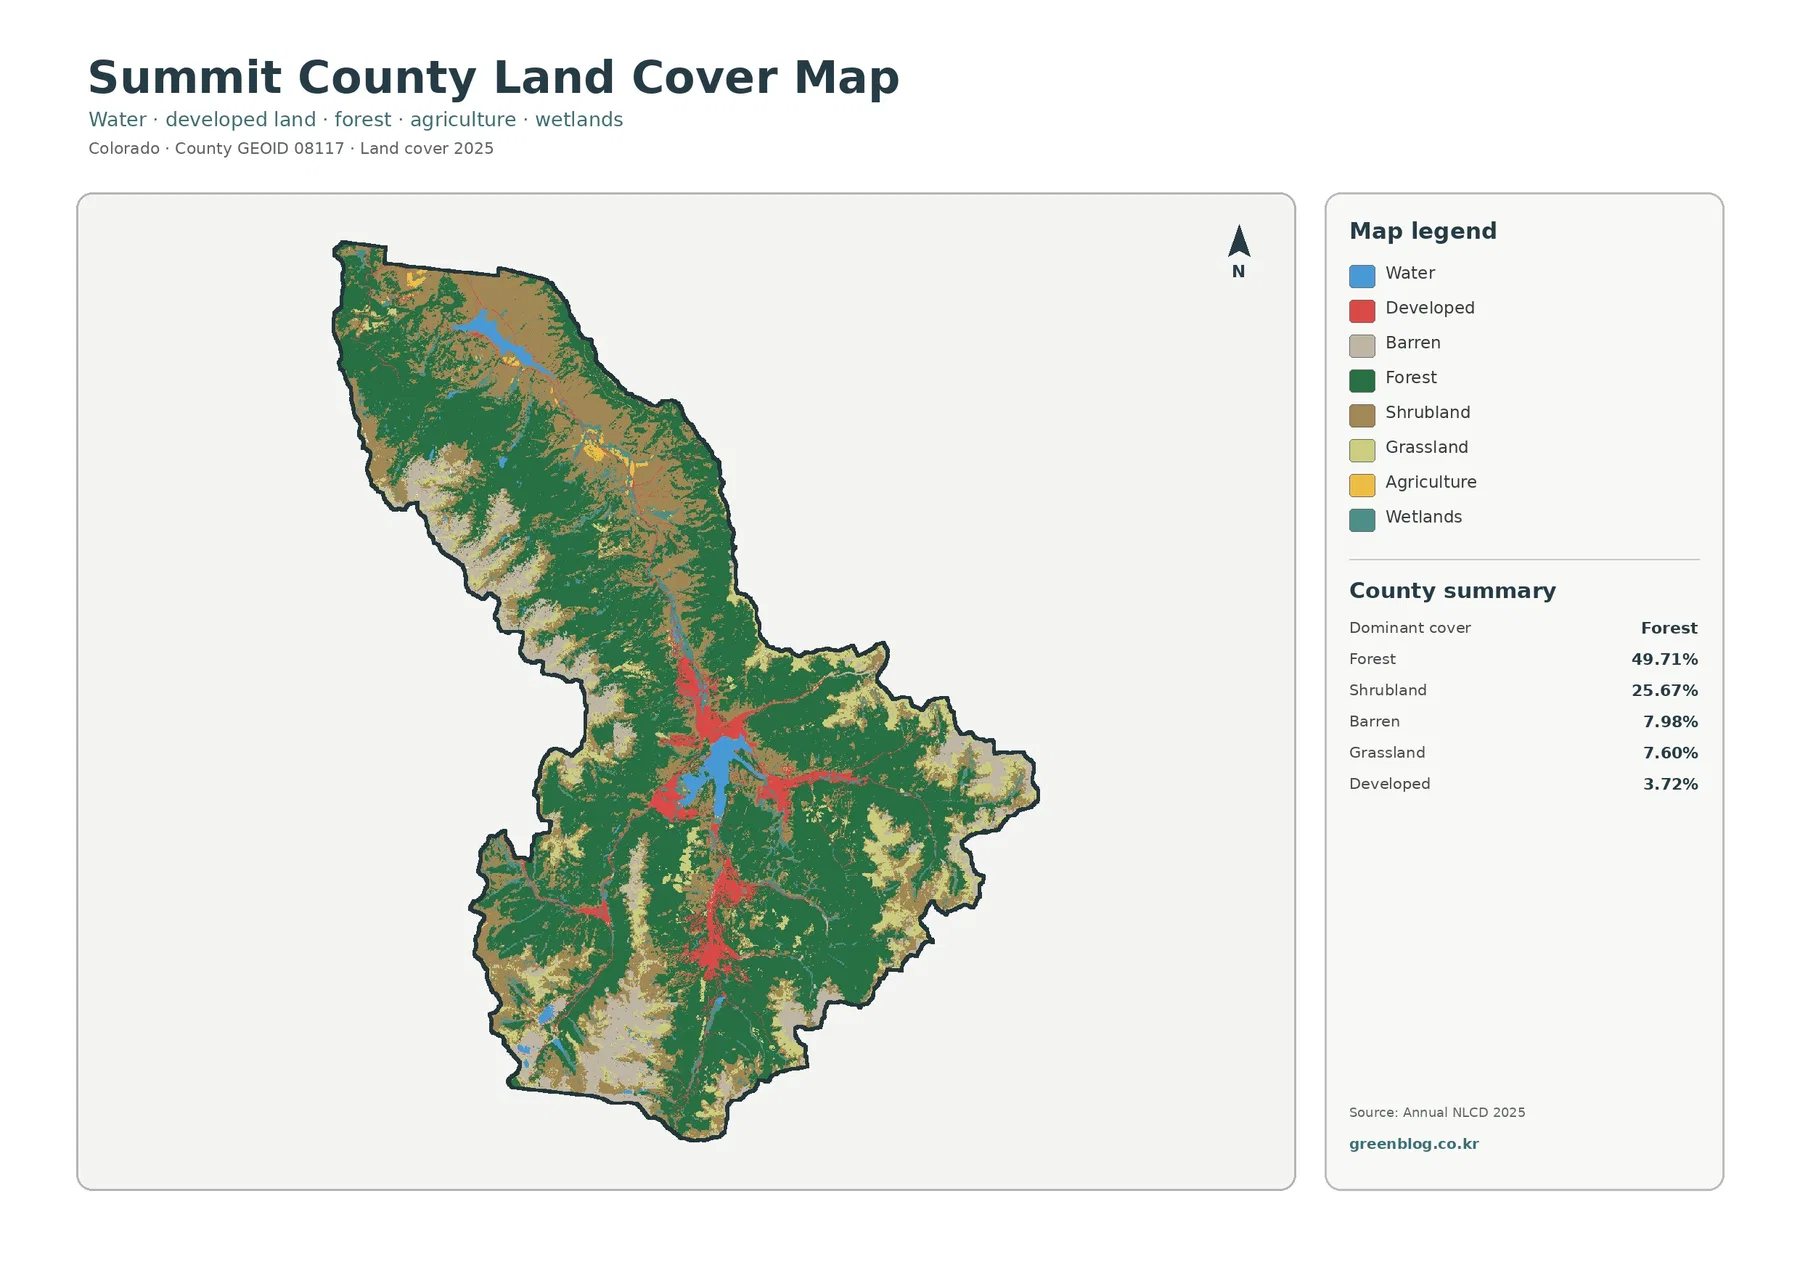
The 2025 summary identifies forest as the dominant cover at 49.71 percent. Shrubland accounts for another 25.67 percent, followed by barren land at 7.98 percent and grassland at 7.60 percent. Developed land is 3.72 percent of the county, while water, wetlands, and agriculture occupy smaller shares. This mix immediately explains why the map is mostly green and tan rather than the large, regular crop blocks seen across much of eastern Colorado.
Summit County’s official hazard planning documents describe a landscape on the west side of the Continental Divide with elevations ranging from roughly 7,500 feet in the lower Blue River valley to 14,278 feet at Grays Peak. Several mountain ranges meet in and around the county, and broad valleys sit between high ridges. That relief helps give the land-cover map its patchwork appearance: forest occupies extensive slopes, open shrub and grass areas interrupt the tree cover, and pale barren classes become more visible in high terrain.
The proportions are useful, but the location of each class matters just as much. Forest is not a single uninterrupted block. It wraps around reservoirs, developed valleys, higher open ridges, and shrub-covered areas. Shrubland is also widely distributed rather than confined to one corner, so a reader can see repeated transitions between wooded and more open mountain surfaces across the county.
Land cover should not be confused with zoning, ownership, or legal land use. Annual NLCD classifies the surface seen in satellite-based data into categories such as forest, shrubland, water, wetlands, barren ground, and developed land. A forest pixel does not identify who owns that land, and a developed pixel does not determine whether a parcel can be built on. For parcel or permitting questions, county planning and cadastral sources are the appropriate references.
Dillon and Green Mountain reservoirs anchor the water pattern
Water covers only 1.45 percent of Summit County in the map summary, yet it is one of the easiest classes to locate. Dillon Reservoir forms a large blue feature near the center of the county, while Green Mountain Reservoir stands out farther north. Smaller water features connect visually with the Blue River drainage, giving the county a recognizable north-south hydrologic structure within the surrounding mountain cover.
County planning material identifies the Blue River as the major drainage basin and notes that it flows north through the county. Dillon Reservoir receives water from the upper Blue River system along with the Snake River and Tenmile Creek, and Green Mountain Reservoir lies on the Blue River farther north. Those facts are useful when reading the map because the blue areas are not isolated lakes; they are part of a connected mountain watershed that threads through forested and developed valleys.
Wetlands make up 3.49 percent of the simplified forest-and-farmland summary. They often appear as thinner, irregular areas near streams, valley bottoms, and reservoir margins rather than broad uniform polygons. Their share is modest compared with forest or shrubland, but their placement makes them important for understanding where wetter surfaces occur within an otherwise mountainous landscape.
At this scale, narrow channels and wetland edges are generalized by the raster grid. A small stream, a strip of riparian vegetation, and adjacent dry ground may all fall inside the same 30-meter cell. The maps therefore work best for countywide patterns and regional comparison, not for surveying a shoreline, measuring a wetland boundary, or deciding where a regulatory setback begins.
The forest map separates wooded slopes from open high country
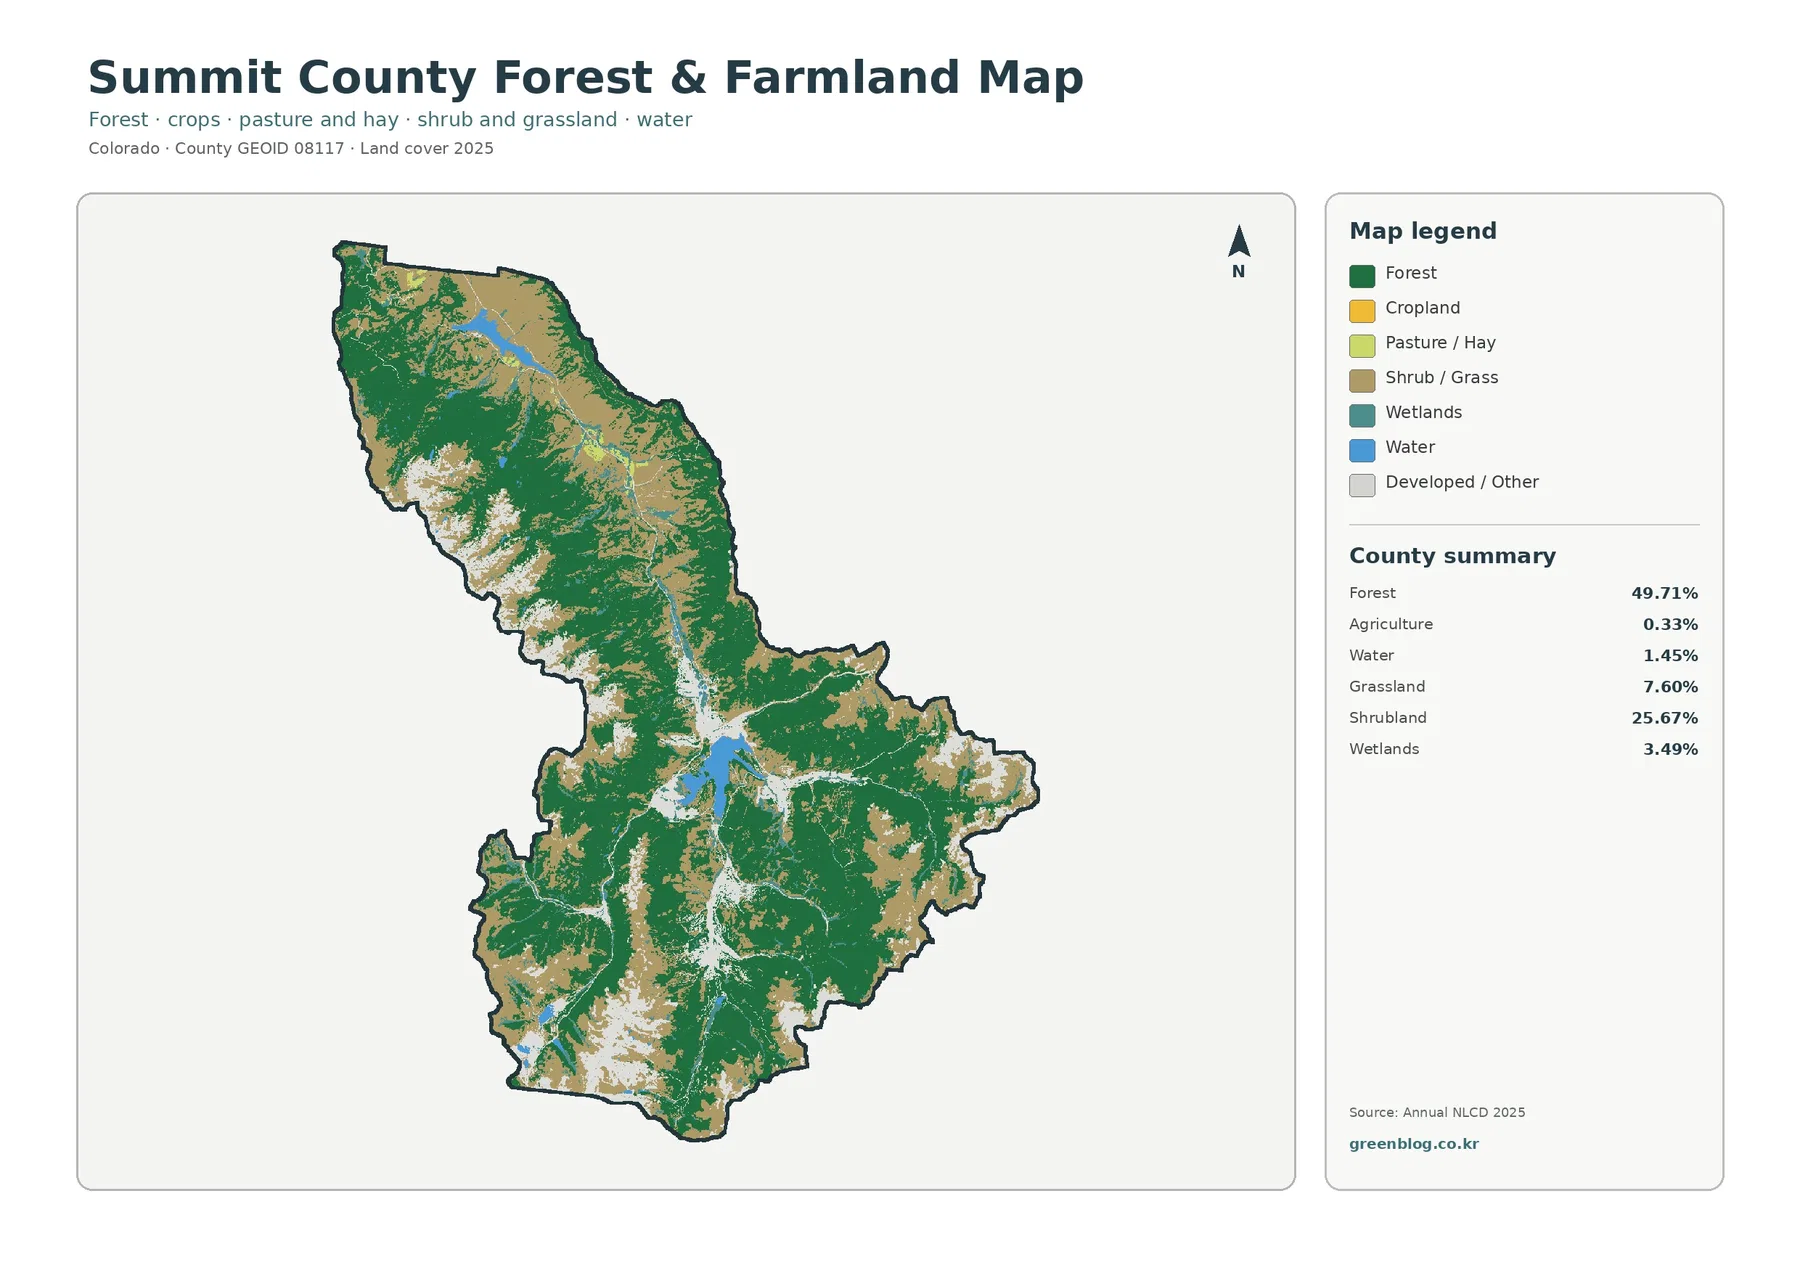
The forest-and-farmland view simplifies the legend so the relationship among forest, shrub and grass cover, water, wetlands, agriculture, and developed or other land is easier to see. Forest remains 49.71 percent, shrubland 25.67 percent, and grassland 7.60 percent. Agriculture is just 0.33 percent, a particularly useful number because it confirms that cultivated land is a minor part of Summit County’s overall surface pattern.
Official county documents describe conifer forest becoming common above about 9,000 feet, with treeline near 11,500 feet and rock, alpine tundra, and snow-dominated terrain above it. The NLCD categories do not reproduce that ecological description one-for-one, but the map’s broad green forest areas and more open tan or pale high-elevation patches are consistent with a county that crosses large elevation ranges. The map is most reliable when those colors are treated as mapped cover classes rather than exact vegetation communities.
Shrubland deserves attention because it covers more than one-quarter of the county. It appears along forest margins and across open mountain areas instead of forming a single isolated block. Grassland is smaller but similarly scattered, helping break up the forest pattern along valleys and high open surfaces. Together, these classes show why describing Summit County simply as “forested” misses a substantial part of its landscape.
The water classes also become cleaner in this simplified view. Dillon Reservoir and Green Mountain Reservoir stand apart from the surrounding vegetation, while thin wetland zones mark parts of the drainage network. This makes the map useful when the goal is to compare forest continuity with open ground and water without the stronger red developed classes drawing attention away from the natural surface pattern.
Development is narrow in area but strong along mountain corridors
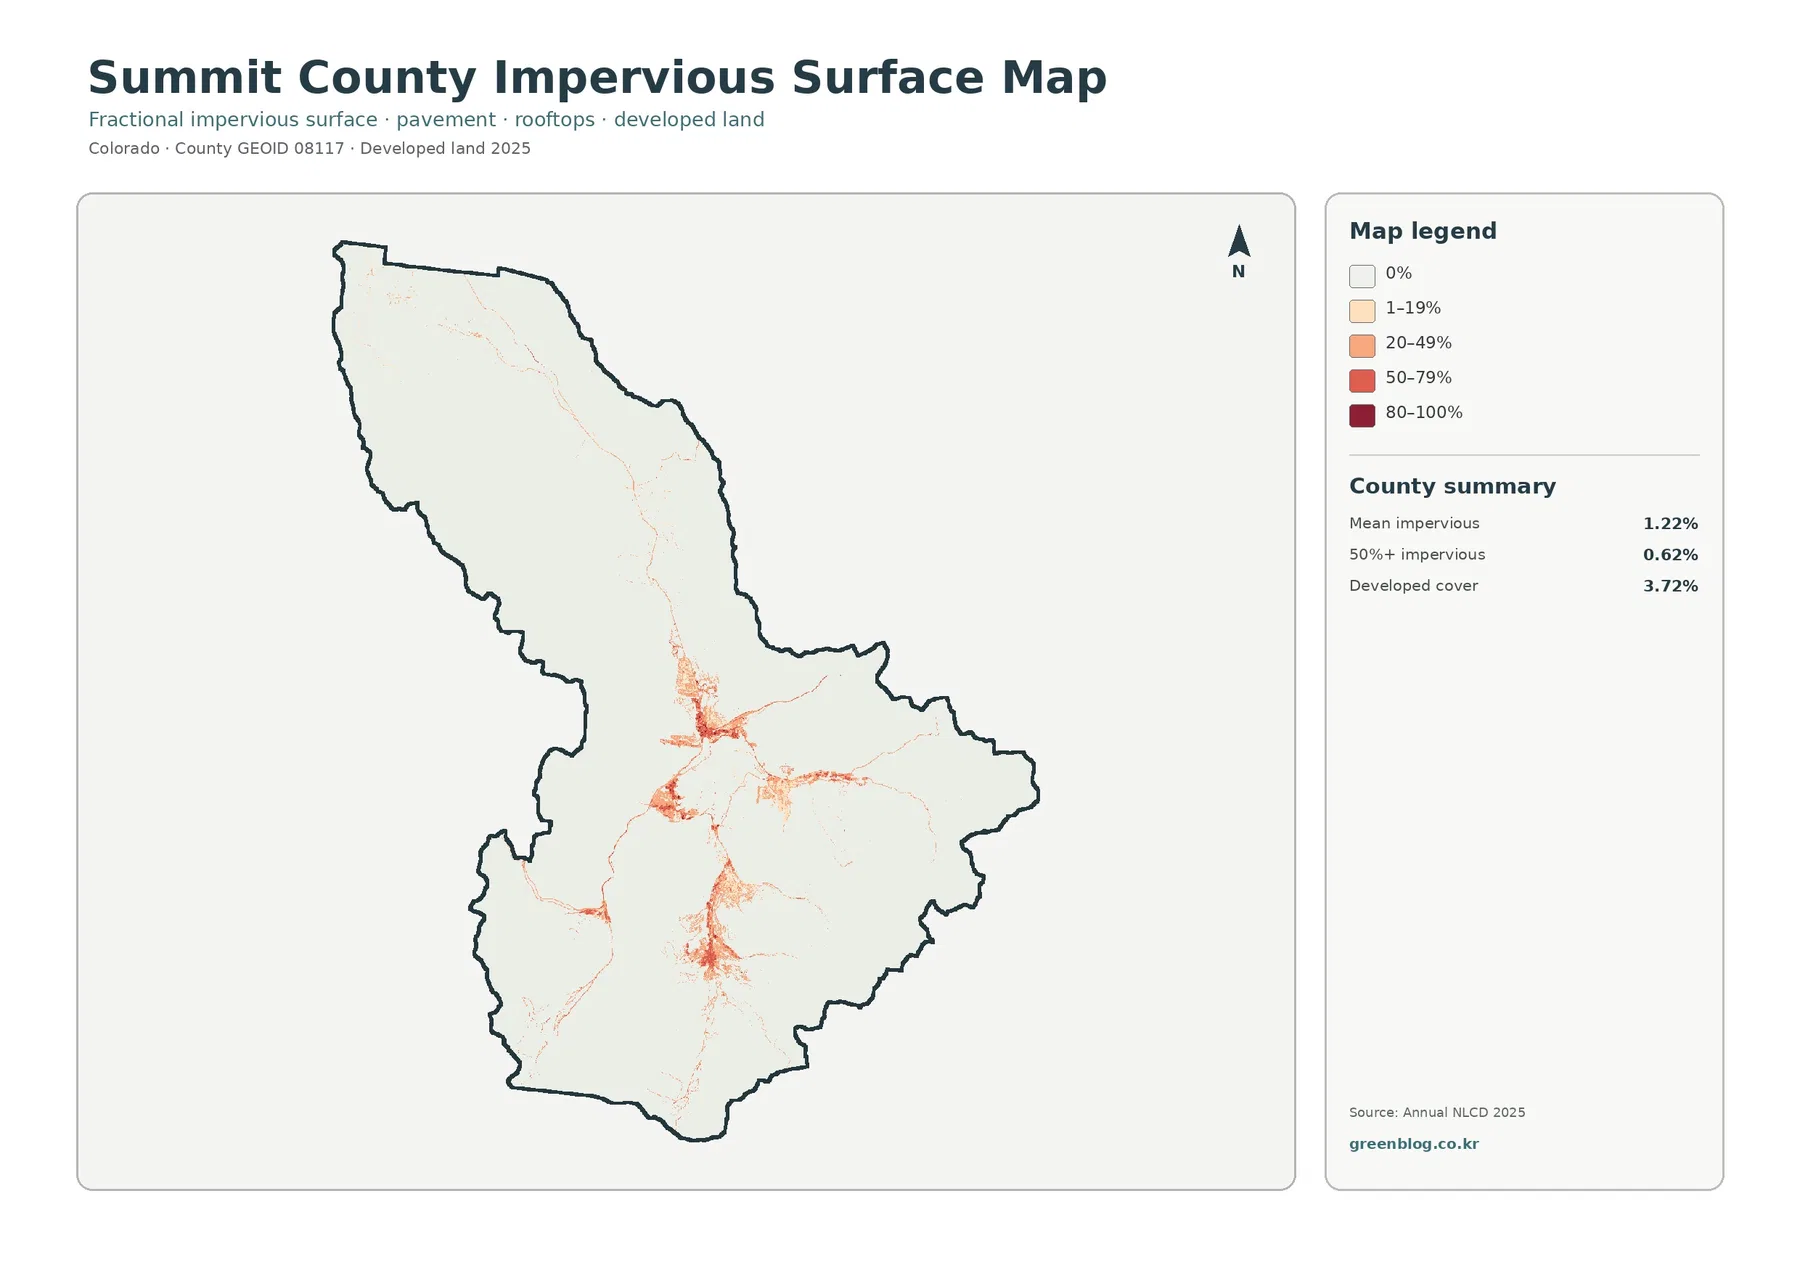
Developed land accounts for 3.72 percent of Summit County. On the general map it appears as a relatively narrow red network through the central and southern part of the county, with additional smaller developed patches elsewhere. The contrast is strong because the surrounding mountains are dominated by forest, shrubland, and open ground. A small countywide percentage can therefore be visually prominent when it is concentrated rather than evenly spread.
Summit County’s official geography description notes that Interstate 70 crosses the county east to west. The county also contains the communities and resort areas associated with the Blue River, Tenmile, and Snake River valleys. On the impervious map, the most visible high-value clusters and thin lines occur in these same broad central and southern corridors. The map shows spatial concentration; it does not by itself prove which road or development caused a particular pixel to receive a higher impervious value.
The countywide mean impervious surface is 1.22 percent, and areas with at least 50 percent impervious surface make up 0.62 percent of the county. Those values are different from the 3.72 percent developed-land statistic. Developed land is a land-cover class, while imperviousness estimates the share of a pixel occupied by hard surfaces such as pavement and rooftops. A developed neighborhood can contain trees and grass, so it does not need to be completely impervious.
Most mountain slopes are nearly white on the impervious map, while settlement centers and transportation lines become orange or red. This reversal of emphasis is useful. Features that are small on the countywide land-cover map become the main subject here, making it easier to compare where human-built surfaces are concentrated against the much larger undeveloped mountain background.
Barren and grass classes help locate the open mountain terrain
Barren land represents 7.98 percent of the 2025 summary, a significant share for a class that might be overlooked when attention stays on forest and reservoirs. Its pale patches are most noticeable where the continuous green forest breaks across higher and more exposed parts of the county. Grassland, at 7.60 percent, adds another open-cover class that appears in scattered mountain and valley settings.
These categories should be read conservatively. “Barren” in a land-cover legend means the surface was classified into a sparsely vegetated or exposed-ground category; it does not automatically identify a particular rock formation, scree field, ski run, or permanent snowfield. Likewise, grassland does not tell the reader which plant species are present. The county’s high-elevation setting provides helpful geographic context, but the map remains a generalized surface classification.
The value of these smaller classes becomes clear when comparing slopes around the larger reservoirs and the southern mountain areas. Forest can dominate one side of a valley while shrub, grass, or barren pixels occupy nearby higher or more open terrain. The frequent transitions are part of what makes Summit County’s land-cover map visually complex despite forest being the largest single category.
What changed between the 1985 and 2025 classifications?
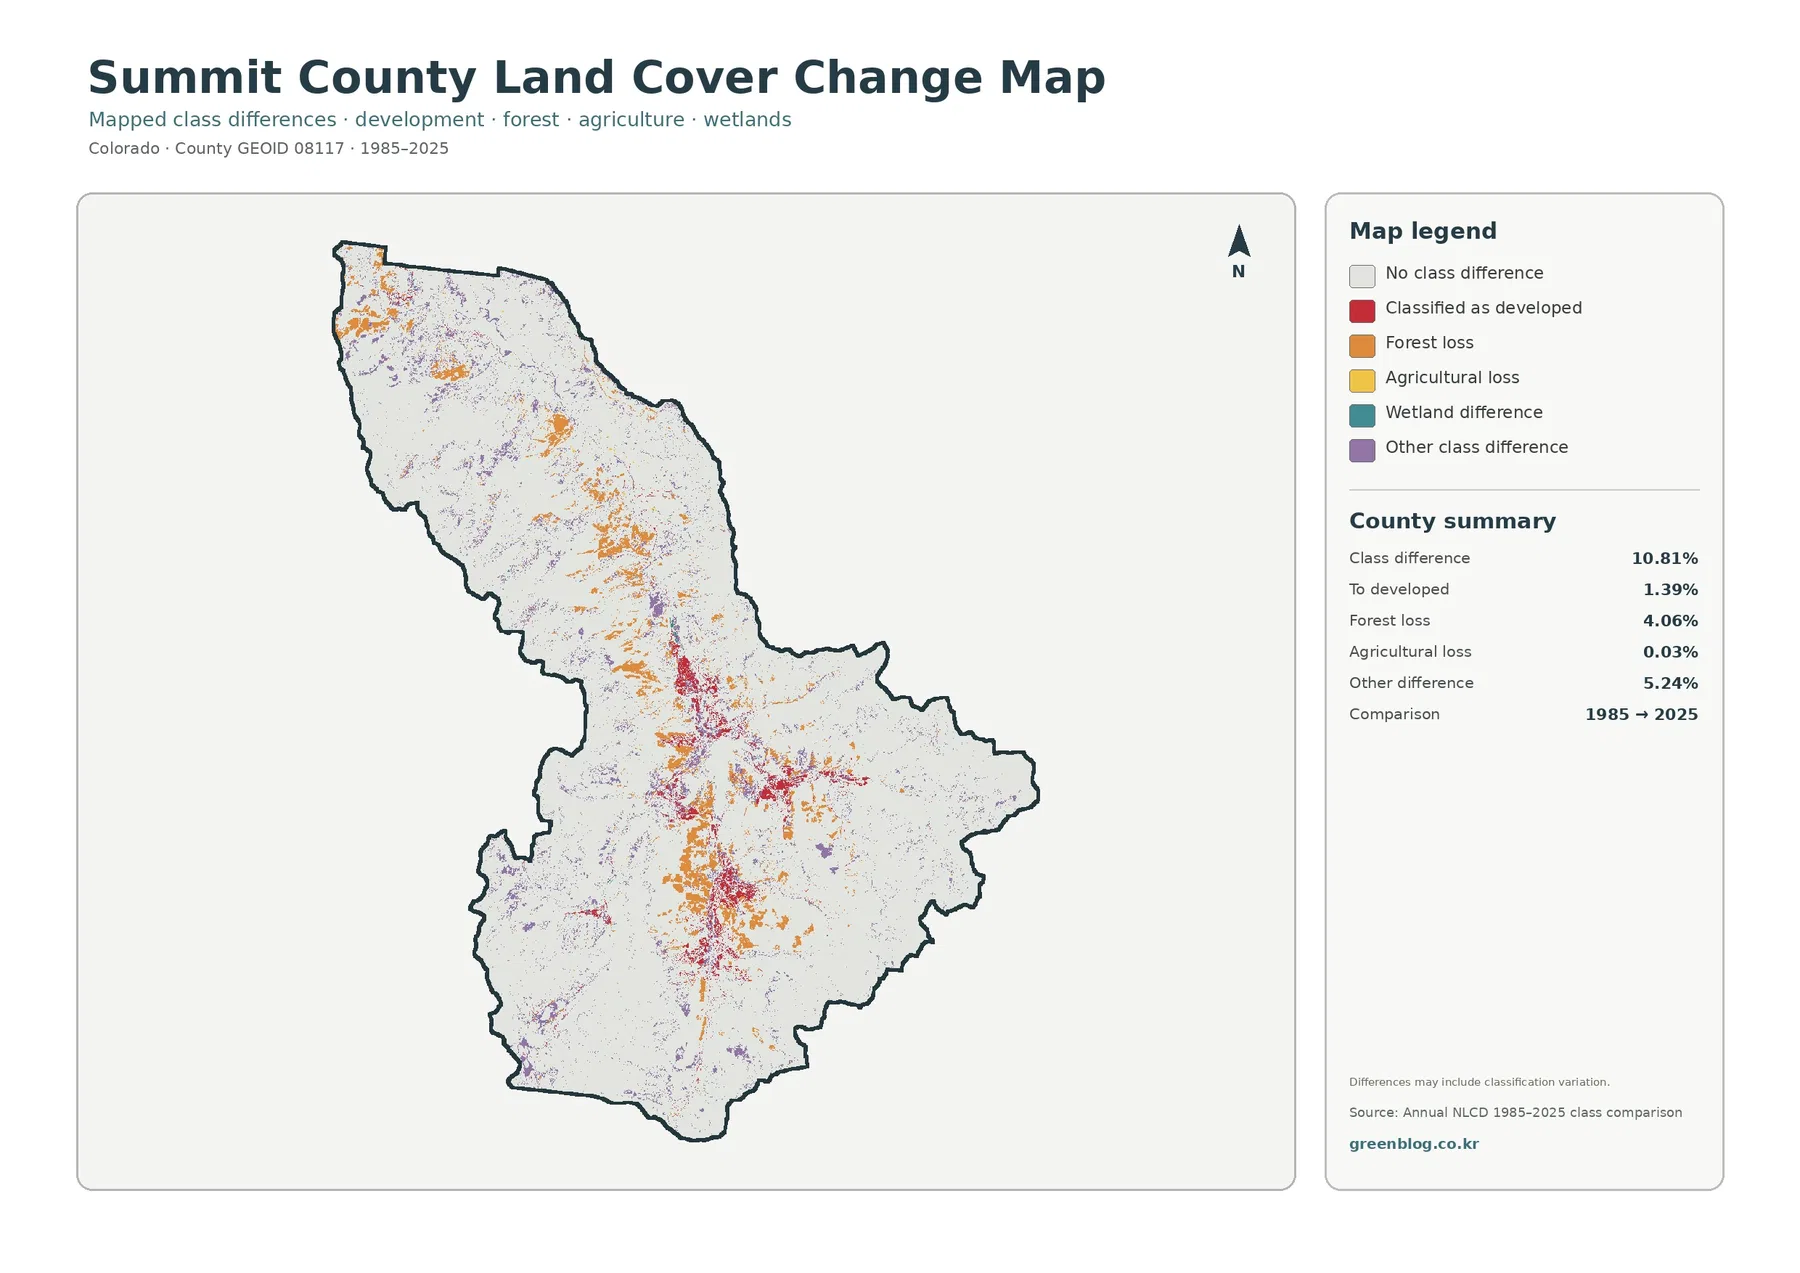
The change map marks 10.81 percent of Summit County as a class difference between 1985 and 2025. The summary assigns 4.06 percent to forest loss, 1.39 percent to areas classified as becoming developed, 0.03 percent to agricultural loss, and 5.24 percent to other class differences. Those values do not say that 10.81 percent of the county was permanently transformed by a single process. They describe differences between two mapped classifications.
Orange forest-loss pixels are scattered across the county rather than forming one continuous clearing. Red areas classified as becoming developed are smaller in total area and appear more strongly around the same broad valleys that stand out on the impervious map. Purple “other difference” pixels occur in many places, including high and open terrain, which is one reason the overall change percentage is larger than the developed-change percentage alone.
The map itself warns that classification variation may be included. Mountain imagery can be affected by seasonal snow, shadow, vegetation condition, and mixed pixels, and classification methods can also change over a long comparison period. A colored change pixel should therefore be treated as a place to investigate, not as a complete record of a specific event.
The 4.06 percent forest-loss category is especially easy to overinterpret. It may include real forest change, but the map does not identify whether a change was related to wildfire, insects, timber management, development, or another cause. To study cause, compare additional Annual NLCD years with aerial imagery and local forest or disturbance records rather than relying on this two-date map alone.
A useful reading method is to compare a change location with the 2025 land-cover map. If an orange forest-loss area is now shrubland, grassland, barren ground, or developed land, the current map helps describe what the later classification became. If a red developed-change area aligns with the present impervious corridor, the two maps reinforce the same present-day location without claiming a cause for the transition.
Choosing the right map for a specific question
For a general county profile, start with the 2025 land-cover map. It is the only view that places forest, shrubland, barren land, grassland, developed areas, water, wetlands, and agriculture into one visual frame. That makes it useful for a report introduction, a geography lesson, or a comparison with another Colorado county where the dominant cover may be cropland or grassland rather than forest.
Use the forest-and-farmland map when the relationship among vegetation, open ground, reservoirs, and wetlands matters more than detailed development classes. It is particularly effective for showing how little agriculture is present: the 0.33 percent share is tiny beside the 49.71 percent forest and 25.67 percent shrubland totals. The simplified legend also makes the two major reservoirs easier to pick out quickly.
The impervious map is the better choice when the question concerns built surfaces. It emphasizes settlement and transportation patterns that occupy only a small part of the county, while forest and shrub cover recede into the background. Use the change map for historical comparison, but phrase conclusions as class differences unless another source verifies the real-world cause and timing of a change.
Scale, resolution, and what the maps cannot tell you
Annual NLCD is designed for broad land-cover analysis rather than parcel-level surveying. A 30-meter raster cell can contain several real features at once, especially in mountain towns where a road, building, lawn, and trees may occur within a short distance. The classification assigns a representative value to that cell, so small objects and narrow boundaries can be generalized.
This matters around reservoir shorelines, stream corridors, steep forest edges, and compact developed areas. A thin wetland may look wider than it is, a small road may disappear into a neighboring class, and a sharp vegetation boundary on the ground may appear stepped on the map. The maps are excellent for seeing the countywide pattern, but they should not be used to establish property boundaries, regulatory wetland limits, or exact building footprints.
The 2025 maps also represent a particular annual classification, not a live view. New construction, forest disturbance, shoreline changes, or other conditions after the mapped year will not appear. For current parcel information or detailed local planning, Summit County GIS and other up-to-date local datasets should be checked alongside these images.
Key numbers to keep beside the map
The strongest current-cover numbers are 49.71 percent forest and 25.67 percent shrubland. Barren land at 7.98 percent and grassland at 7.60 percent add substantial open mountain cover, while developed land is 3.72 percent. In the simplified map, wetlands account for 3.49 percent, water 1.45 percent, and agriculture only 0.33 percent.
The impervious summary gives a countywide mean of 1.22 percent and shows 0.62 percent of the county at 50 percent or greater imperviousness. The change summary uses a different basis: 10.81 percent class difference, 4.06 percent forest loss, 1.39 percent to developed, 0.03 percent agricultural loss, and 5.24 percent other difference. Keeping those groups separate prevents current land-cover percentages from being confused with change categories.
Location turns the statistics into a geographic story. Forest and shrubland form the broad mountain background; Dillon and Green Mountain reservoirs anchor the water pattern; wetlands follow parts of the drainage network; and developed or highly impervious surfaces are concentrated in narrower valleys and transportation corridors. The change map adds a time dimension by showing where the 1985 and 2025 classes do not match.
The downloaded JPGs include the legend and county summary on each map, so the main percentages remain visible even when the files are used away from this page. The source assets in this package are 2480 by 1754 pixels, and the manifest does not mark them as meeting an A3 high-resolution reference. If you plan a very large print, check text and boundary sharpness at the intended print size first.
Frequently Asked Questions
What is the largest land-cover class in Summit County?
Forest is the largest 2025 class at 49.71 percent, followed by shrubland at 25.67 percent. Barren land and grassland each add roughly eight percent, so the county is not simply one continuous forest. Open high-elevation and shrub-covered areas are an important part of the mapped pattern.
Why does the impervious map show narrow bright corridors instead of a broad urban area?
Summit County is mostly mountain terrain, and developed land is only 3.72 percent of the county. Roads, rooftops, parking areas, and settlement centers are concentrated in narrower valleys and transportation corridors, so they appear as lines and compact clusters against a much larger low-impervious background.
Does 4.06% forest loss mean exactly that much forest permanently disappeared?
No. The 4.06 percent figure is the area assigned to the forest-loss category when the 1985 and 2025 classifications are compared. It may include real forest change, but classification variation can also contribute. Additional years, aerial imagery, and local disturbance records are needed to confirm the cause and permanence of a specific change.
Sources and Reference Data
- MRLC Annual NLCD Data – official access point for Annual NLCD land-cover data and yearly products
- USGS Annual NLCD Land Cover Classification – official explanation of land-cover classes and classification terminology
- U.S. Census Bureau TIGER/Line Shapefiles – official county boundary and geographic reference data
- Summit County Multi-Hazard Mitigation Plan – county source for elevation, the Blue River drainage, reservoirs, and mountain geography
- Summit County GIS Services – official county GIS services for local geographic layers and reference data
Map File Information
Use the ZIP below to save the Summit County land-cover maps as original JPG files. It contains all four maps described on this page.
- Included Files: Use only the versions confirmed in the article and supplied images
- File Type: Use the confirmed download contents
- Intended Use: Printing, education, presentations, and map-based projects
Related Maps
- Adams County Colorado Land Cover Map
- Alamosa County Colorado Land Cover Map
- Arapahoe County Colorado Land Cover Map
Green Map creates custom-edited map images using open geographic data sources such as geoBoundaries, Natural Earth, OpenStreetMap, and government open data.
These maps are edited visual materials, not raw data files, and are provided for education, documents, presentations, and graphic reference.