Dillingham Census Area occupies a large part of southwestern Alaska where broad river systems meet the Bristol Bay coast. The supplied general map places Dillingham near the southern center, with Aleknagik just to the northwest and Manokotak and Clark’s Point farther south and west. Togiak sits much farther toward the southwestern coast, while Ekwok, New Stuyahok, and Koliganek appear inland to the east. The terrain and water map then explains much of that scattered settlement pattern by showing a dense network of rivers, tributaries, bays, and rugged western terrain. High-resolution JPG versions of the same general, city-index, and terrain-water maps are available in the ZIP download box later on this page.
U.S. Census Bureau QuickFacts reports 18,333.99 square miles of land area and a 2020 Census population of 4,857 for Dillingham Census Area. That combination helps explain why the map does not look like a conventional densely settled county. Named communities occupy only a small part of the overall frame, while waterways spread across nearly every section of the census area. A useful way to read the package is to begin with Dillingham and the other southern settlements, move east toward Ekwok and New Stuyahok, and then use the terrain-water map to trace the large rivers north and inland.
Table of Contents
The main settlement labels gather around the southern river-and-bay country
Dillingham is the easiest anchor on the general map because it appears near the southern center of the census area. Aleknagik lies a short distance to the northwest on the map, while Manokotak and Clark’s Point appear to the southwest. Togiak is farther west near the coast and is separated from the Dillingham cluster by a wide area of rivers and uneven terrain. These labels make the southern edge feel much more populated than the enormous northern interior, even though the settlements are still widely separated from one another.
East of Dillingham, the map shows Ekwok, New Stuyahok, and Koliganek. They are not drawn as one continuous urban corridor; instead, they occupy separate locations within a broad interior crossed by many streams. This is an important distinction for readers used to road-oriented county maps. The supplied map shows some road lines near settlements, but water features are far more extensive than roads across the full census area. The page should therefore be used for regional orientation, not for estimating drive times or assuming that two labeled communities have a direct road connection.
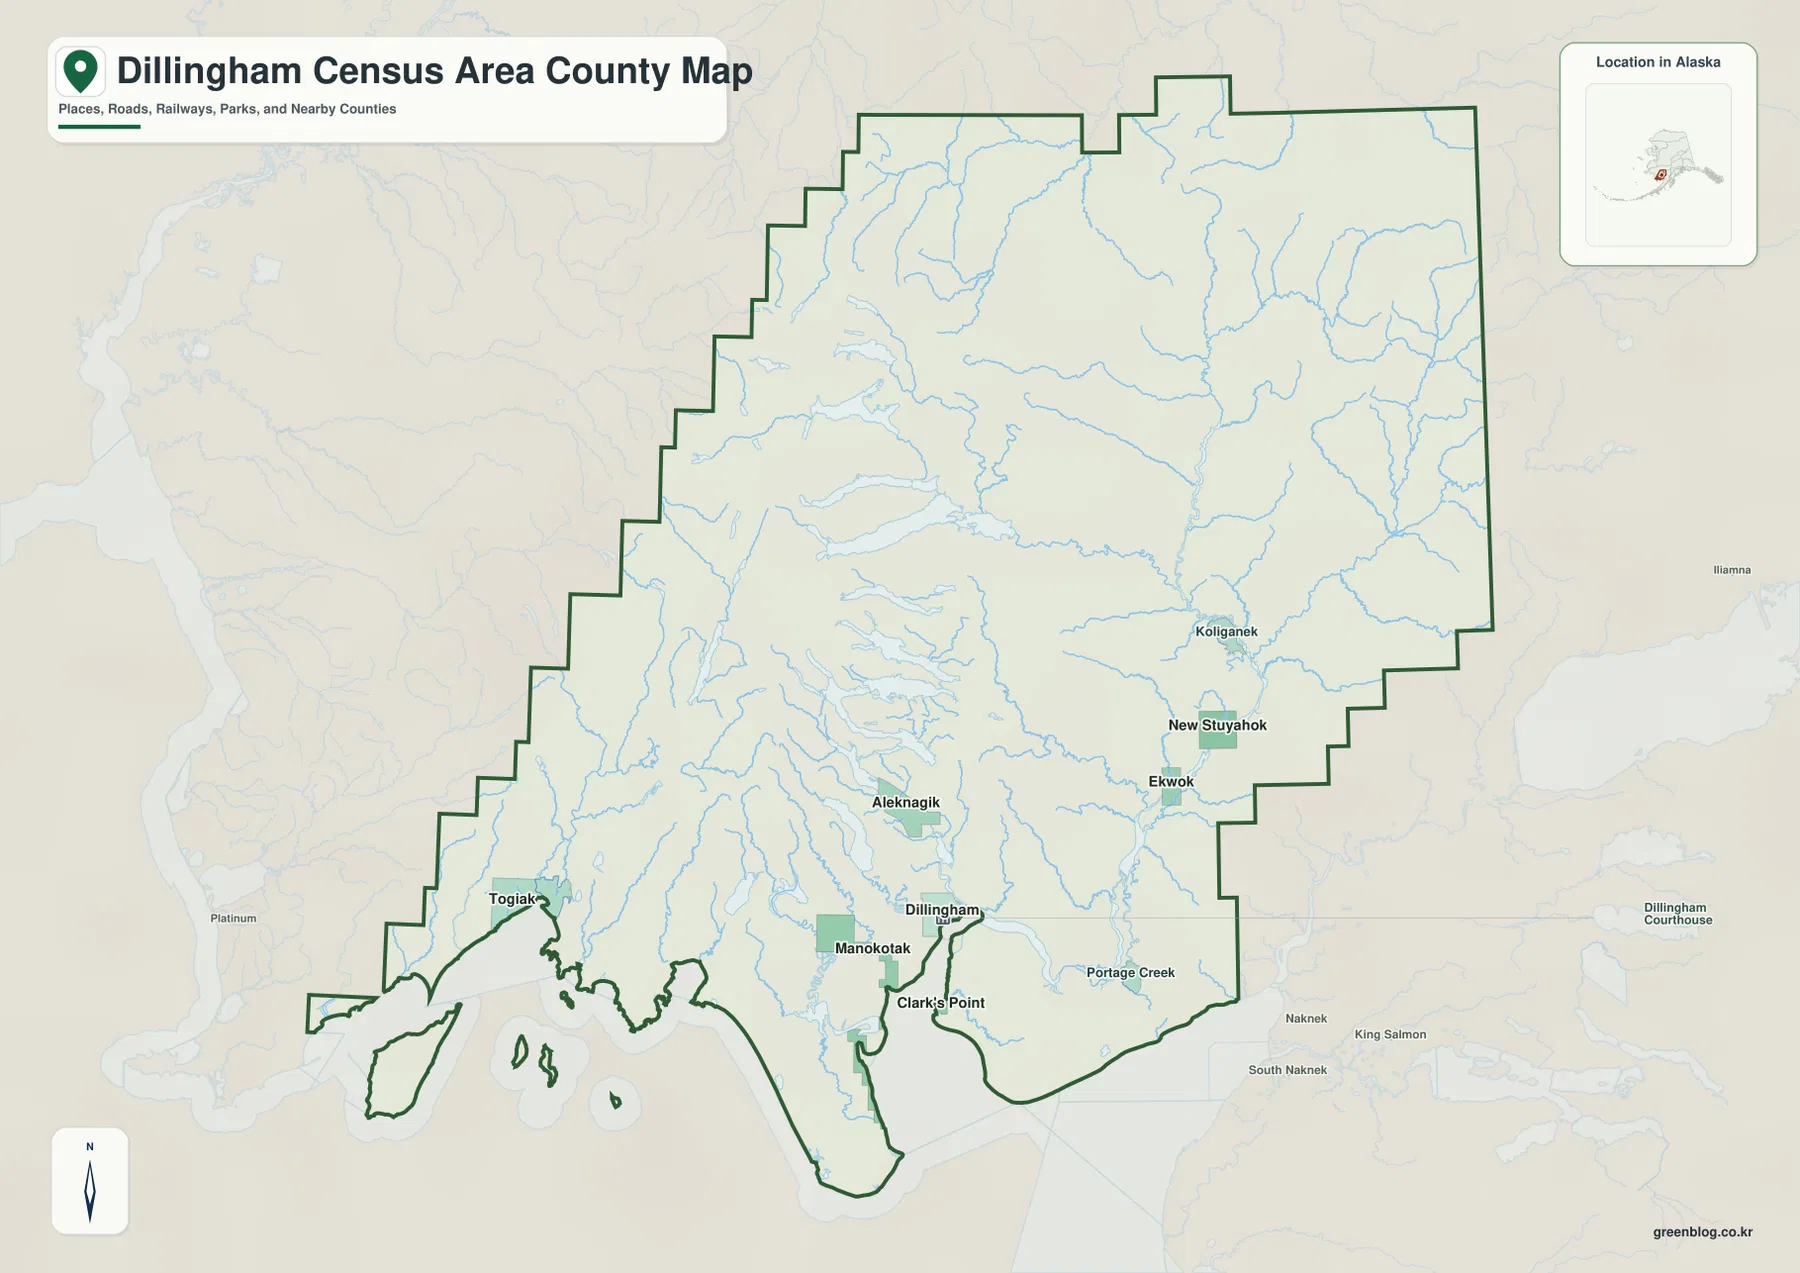
The boundary gives the region a distinctive shape. Long straight and stepped sections appear across the north and east, while the southern and southwestern edge becomes much more irregular where land meets bays, inlets, peninsulas, and small islands. The Togiak side is especially complex compared with the broad interior boundary. This contrast is useful because it reminds the reader that one county-equivalent area contains both a very large inland drainage region and a complicated Bristol Bay shoreline. The dark green outline is the best guide for distinguishing the mapped census area from surrounding labels and background geography.
Six ranked cities show a dispersed network rather than a single urban center
The city-index map narrows the focus to six ranked places: Dillingham, Togiak, Manokotak, New Stuyahok, Aleknagik, and Ekwok. The CITY INDEX prints the values 2,109 for Dillingham, 963 for Togiak, 679 for Manokotak, 474 for New Stuyahok, 92 for Aleknagik, and 36 for Ekwok. Those numbers are part of the supplied map graphic, so this article treats them as map content rather than claiming that they are current population estimates. Anyone who needs current official population figures should use the U.S. Census Bureau or Alaska population data linked in the sources section.
The relative positions of the six markers are more useful than the ranking alone. Dillingham, Manokotak, and Aleknagik occupy the south-central portion of the map. Togiak is well to the west, while New Stuyahok and Ekwok are to the east. The spacing makes it immediately clear that the census area is not organized around one compact metropolitan center. Instead, communities are spread across different river and coastal settings. The city-index map is therefore a quick comparison tool for location and distribution, not a road-distance or travel-time diagram.
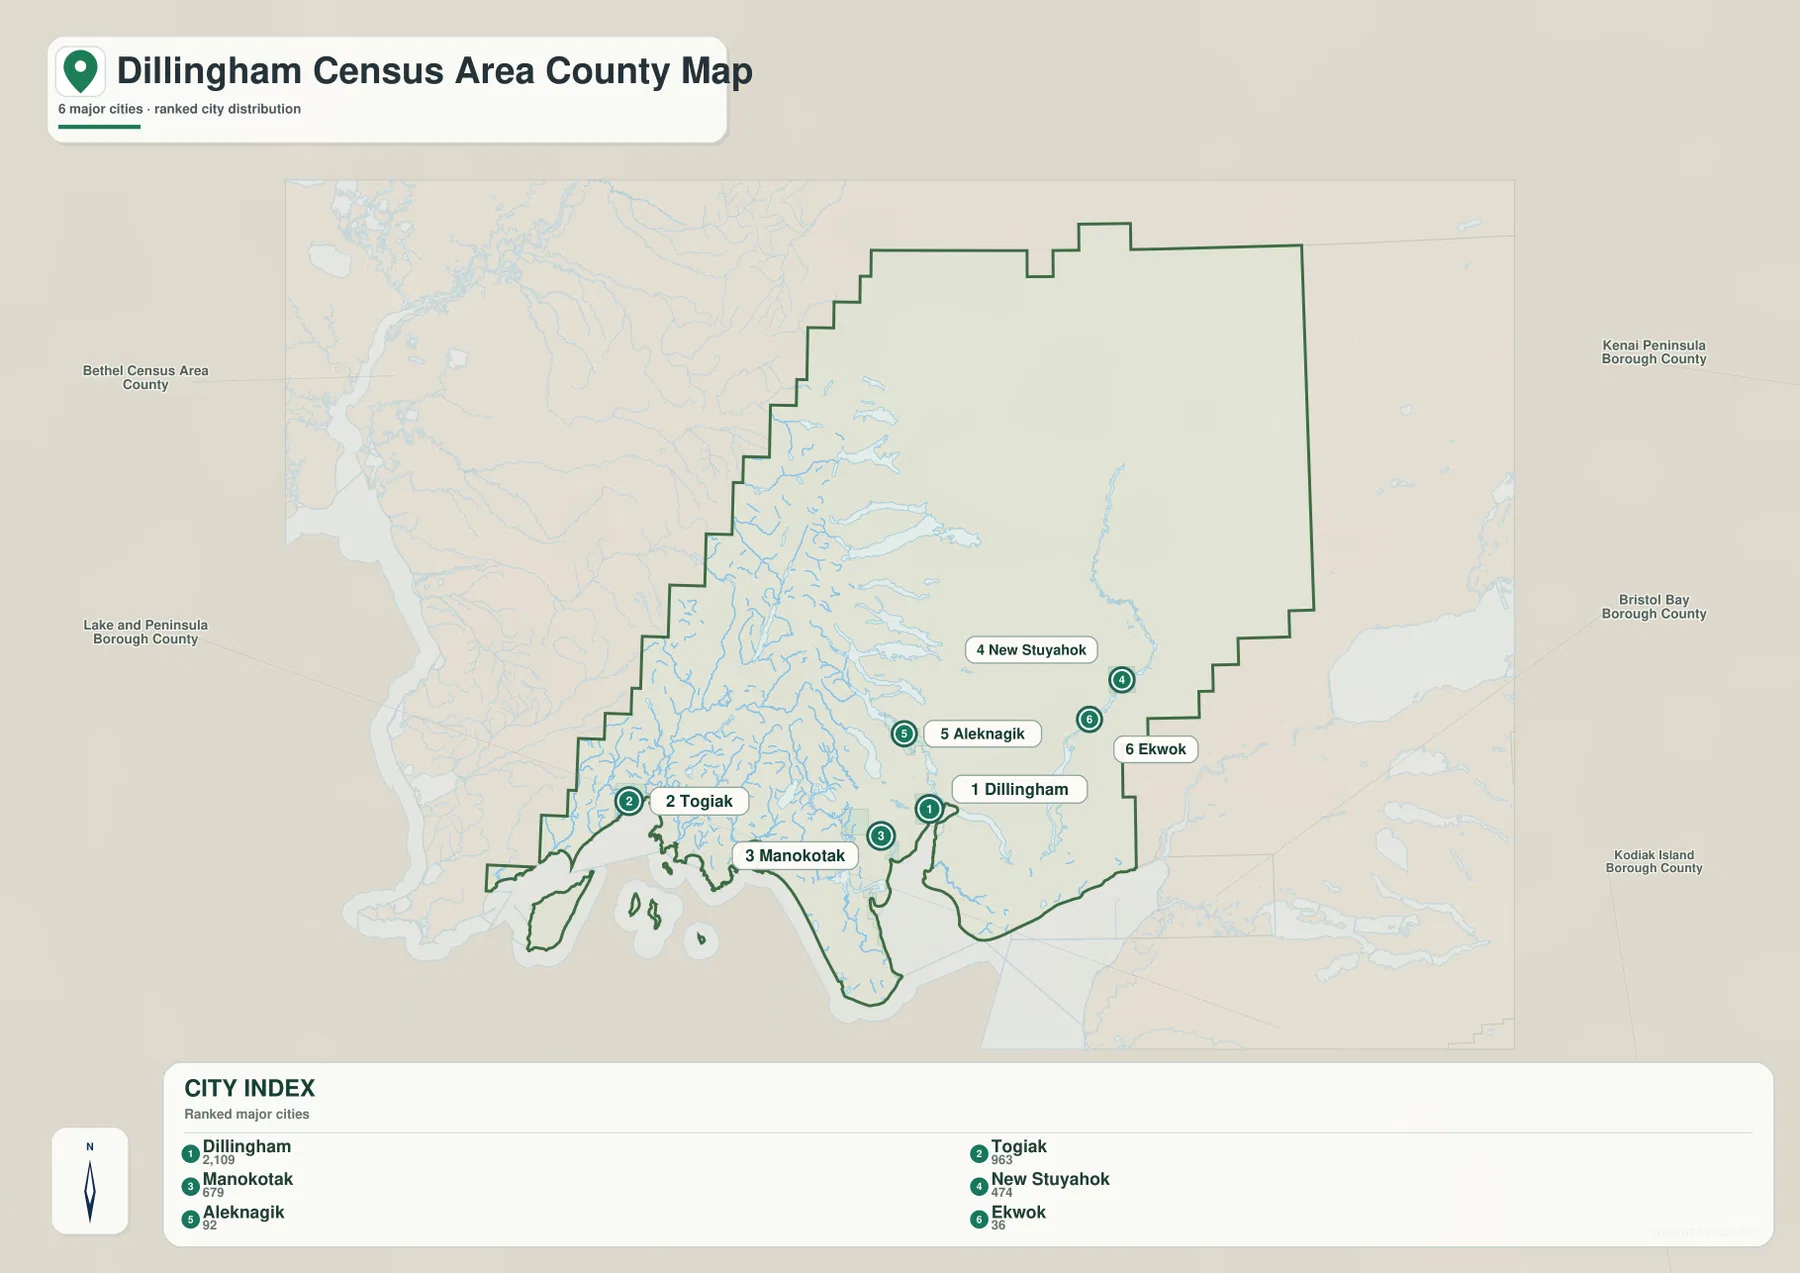
Several surrounding administrative names appear in the background, including Bethel Census Area, Lake and Peninsula Borough, Kenai Peninsula Borough, Bristol Bay Borough, and Kodiak Island Borough. These labels are useful for broad orientation, but a name appearing on the background does not by itself prove that every listed area shares a direct boundary with Dillingham Census Area. For exact jurisdictional lines, the U.S. Census Bureau TIGER/Line products are the better source. The city map is designed to show the internal ranking and regional position without turning into a legal-boundary reference.
The water map traces a long route from Tikchik and Koktuli country toward Bristol Bay
The terrain and water map changes the emphasis completely. In the north-central part of the census area, Koktuli River is labeled along a long channel, with King Salmon River to the east and Titnuk Creek farther east. Tikchik River runs southward through a more rugged-looking part of the map, surrounded by many shorter tributaries and lake shapes. The general map has relatively few settlement labels in this northern interior, but the water map shows that the same area is far from empty. It contains a complicated network of drainage lines that becomes one of the defining visual features of the county-equivalent area.
Farther south, Nushagak River becomes one of the clearest reference features. It runs through the southeastern portion of the map toward the broad water of Bristol Bay. Wood River, Snake River, Weary River, and Igushik River are labeled to the west of the Nushagak, each following a different path through the south-central terrain. Because Dillingham is positioned near this southern river-and-bay setting on the general map, comparing the two maps helps explain its location more effectively than a settlement map alone. The city is not simply a dot in a large polygon; it sits near a complex meeting place of rivers and coastal water.
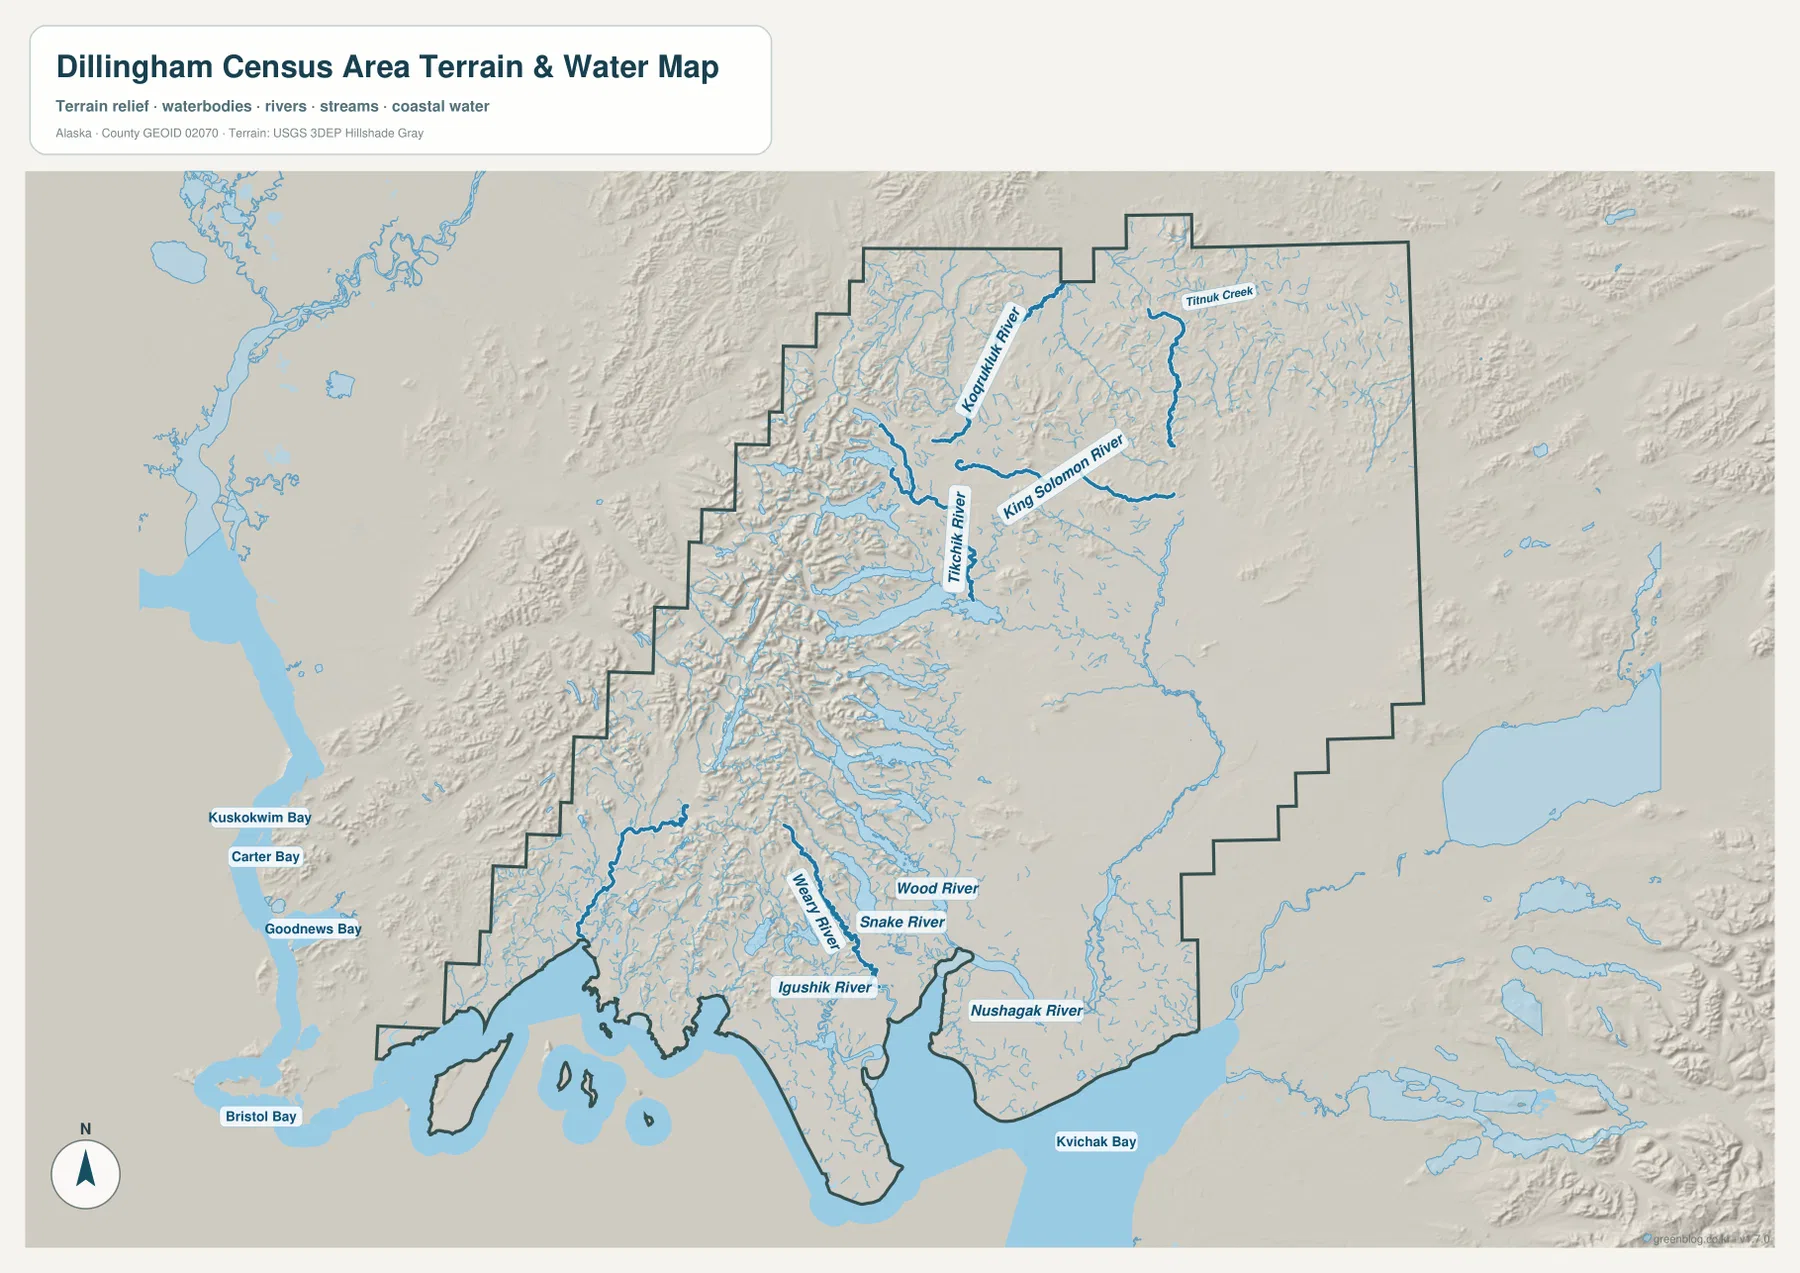
The coastal labels extend beyond the interior drainage. Kuskokwim Bay, Carter Bay, and Goodnews Bay are shown along the western side of the wider map, while Bristol Bay dominates the south. Kvichak Bay is labeled toward the southeast. These water names provide regional reference points rather than a list of features wholly contained inside the census-area boundary. They are especially helpful when comparing Togiak on the southwest side with Dillingham and the Nushagak system farther east.
This is a reference map for river names, approximate drainage relationships, terrain appearance, and coastal orientation. It is not a flood-risk map, nautical chart, river-depth survey, ice-condition product, or navigation guide. The line shown for a river does not tell a user whether a channel is safe to travel at a particular time. For detailed hydrography, the USGS National Hydrography resources linked below are the appropriate next source.
Rugged western relief contrasts with broader eastern lowlands
The background shading on the terrain-water map adds another important clue. Western and northwestern parts of the census area, especially around the Tikchik drainage, have tightly textured ridges and valleys. Streams branch repeatedly through those rougher areas. Much of the east and southeast appears smoother by comparison, and the major river channels stand out across broader terrain. The map does not provide contour values, but the visible relief helps explain why the drainage looks different from one side of the census area to the other.
The Togiak side also combines an irregular coast with stronger terrain shading just inland. Bays, peninsulas, and small islands break up the shoreline, while the interior becomes more rugged north of the coast. Around Dillingham and Manokotak, the southern water network lies between those western high-relief areas and the broader river country to the east. Seeing that transition on one map makes the scattered settlement locations easier to understand. Communities appear in different geographic settings rather than along one continuous highway corridor.
The relief background should not be treated as survey-grade elevation information. It is useful for recognizing broad mountain-versus-lowland differences and for seeing how streams cut across the landscape, but it does not provide precise heights or slopes. Engineering, construction, parcel work, or detailed terrain analysis requires a dedicated elevation product rather than this generalized visual layer.
Choose the map by the question you are trying to answer
A first-time reader can work through the package in a simple sequence. Start with the general map and locate Dillingham, then look west toward Togiak and east toward Ekwok and New Stuyahok. Next use the city index to compare the six ranked centers and notice how widely separated they are. Finally, open the terrain-water map and trace Nushagak River, Wood River, Tikchik River, Koktuli River, and Bristol Bay. This order connects communities to the physical geography without forcing one crowded map to answer every question.
- Boundary and named places: Use the general map for Dillingham, Togiak, Aleknagik, Manokotak, Ekwok, New Stuyahok, Koliganek, and the census-area outline.
- Comparison of ranked centers: Use the city index to see how the six highlighted cities are distributed across the south, west, and east.
- Rivers, bays, and terrain: Use the terrain-water map for Nushagak River, Wood River, Snake River, Tikchik River, Koktuli River, Bristol Bay, and surrounding relief.
- Exact legal or hydrographic work: Treat these maps as orientation tools and confirm detailed boundaries or waterways with Census and USGS source data.
For a classroom or presentation, the general map works well as the opening view because it establishes the extent of Dillingham Census Area and the major place names. The city index can then demonstrate that the population centers are dispersed rather than clustered in one urban belt. The terrain-water map adds the strongest geographic explanation by showing why rivers and coastal water are unavoidable parts of the regional picture. When a larger image is needed for printing, offline reference, or a slide, the high-resolution JPG files in the ZIP below provide the same map subjects at a much larger size.
Frequently Asked Questions
Which map is best for comparing Dillingham and Togiak?
The general map is the quickest choice. Dillingham appears near the southern center of the census area, while Togiak is much farther west near the coast. The same map also shows Manokotak, Aleknagik, and the census-area boundary, so the two places can be compared without losing their broader regional setting.
Where can I find Nushagak River and Tikchik River?
Use the terrain and water map. Tikchik River is labeled in the north-central portion of the census area near Koktuli River and King Salmon River. Nushagak River is labeled farther southeast as it approaches the Bristol Bay side of the region. Wood River, Snake River, Weary River, and Igushik River are also named on that map.
Should the numbers in the city index be treated as current population estimates?
No. They are values printed in the supplied city-index graphic and are presented here as part of that map. For current official population figures, use the U.S. Census Bureau QuickFacts page or current Alaska population data rather than treating the map index as a live statistical table.
Map File Information
Download the high-resolution JPG versions of the Dillingham Census Area maps described on this page. The ZIP contains larger files than the on-page WebP images for printing, classroom use, presentations, and offline geographic reference.
- File Type: JPG files in one ZIP archive
Related Maps
Sources and references
This article is based on the supplied Dillingham Census Area boundary, settlement, city-index, river, bay, and terrain maps. The links below provide official statistics, boundary data, and hydrography for readers who need more detailed or current information.
- U.S. Census Bureau QuickFacts – Dillingham Census Area, Alaska
- Alaska Department of Labor – 2020 Census data for Dillingham Census Area
- U.S. Census Bureau TIGER/Line Shapefiles
- USGS National Hydrography
Green Map creates custom-edited map images using open geographic data sources such as geoBoundaries, Natural Earth, OpenStreetMap, and government open data.
These maps are edited visual materials, not raw data files, and are provided for education, documents, presentations, and graphic reference.