Fremont County has one of the clearest north-south land-cover contrasts in this Idaho map series. Forest accounts for 40.30% of the county, with broad green areas across the north and east, while agriculture reaches 13.72% and forms large blocks across the south. Shrubland fills much of the open country between those two settings, and water and wetlands add a second strong pattern in the northern half.
The page includes a general land-cover map, a forest-and-farmland view, an impervious-surface map, and a 1985-to-2025 class-difference map. The WebP versions are shown in the article, and the four original JPG maps are available together in one download for printing, county comparison, class projects, or reference.
Table of Contents
The county shifts from a southern farm belt to a much more forested north and east
The southern edge of Fremont County is dominated by large yellow agricultural blocks and a visible road grid. Moving north, those fields give way to broader shrubland, then to extensive forest that covers much of the northeast and eastern side. The change is not a straight boundary. Wetlands, water, grassland, shrubland, and small developed areas interrupt the transition, which makes the county more varied than a simple “farm south, forest north” description would suggest.
Shrubland is the second-largest class at 32.66%. It is especially important across the west and center, where brown open land separates the southern agricultural zone from the large forest blocks farther east and north. Grassland contributes 3.80% and appears in smaller light-green patches near shrubland and farm edges. Those open classes help explain why forest does not form one continuous cover across the entire county.
The 2025 map puts 40.30% forest beside a concentrated 13.72% agricultural zone
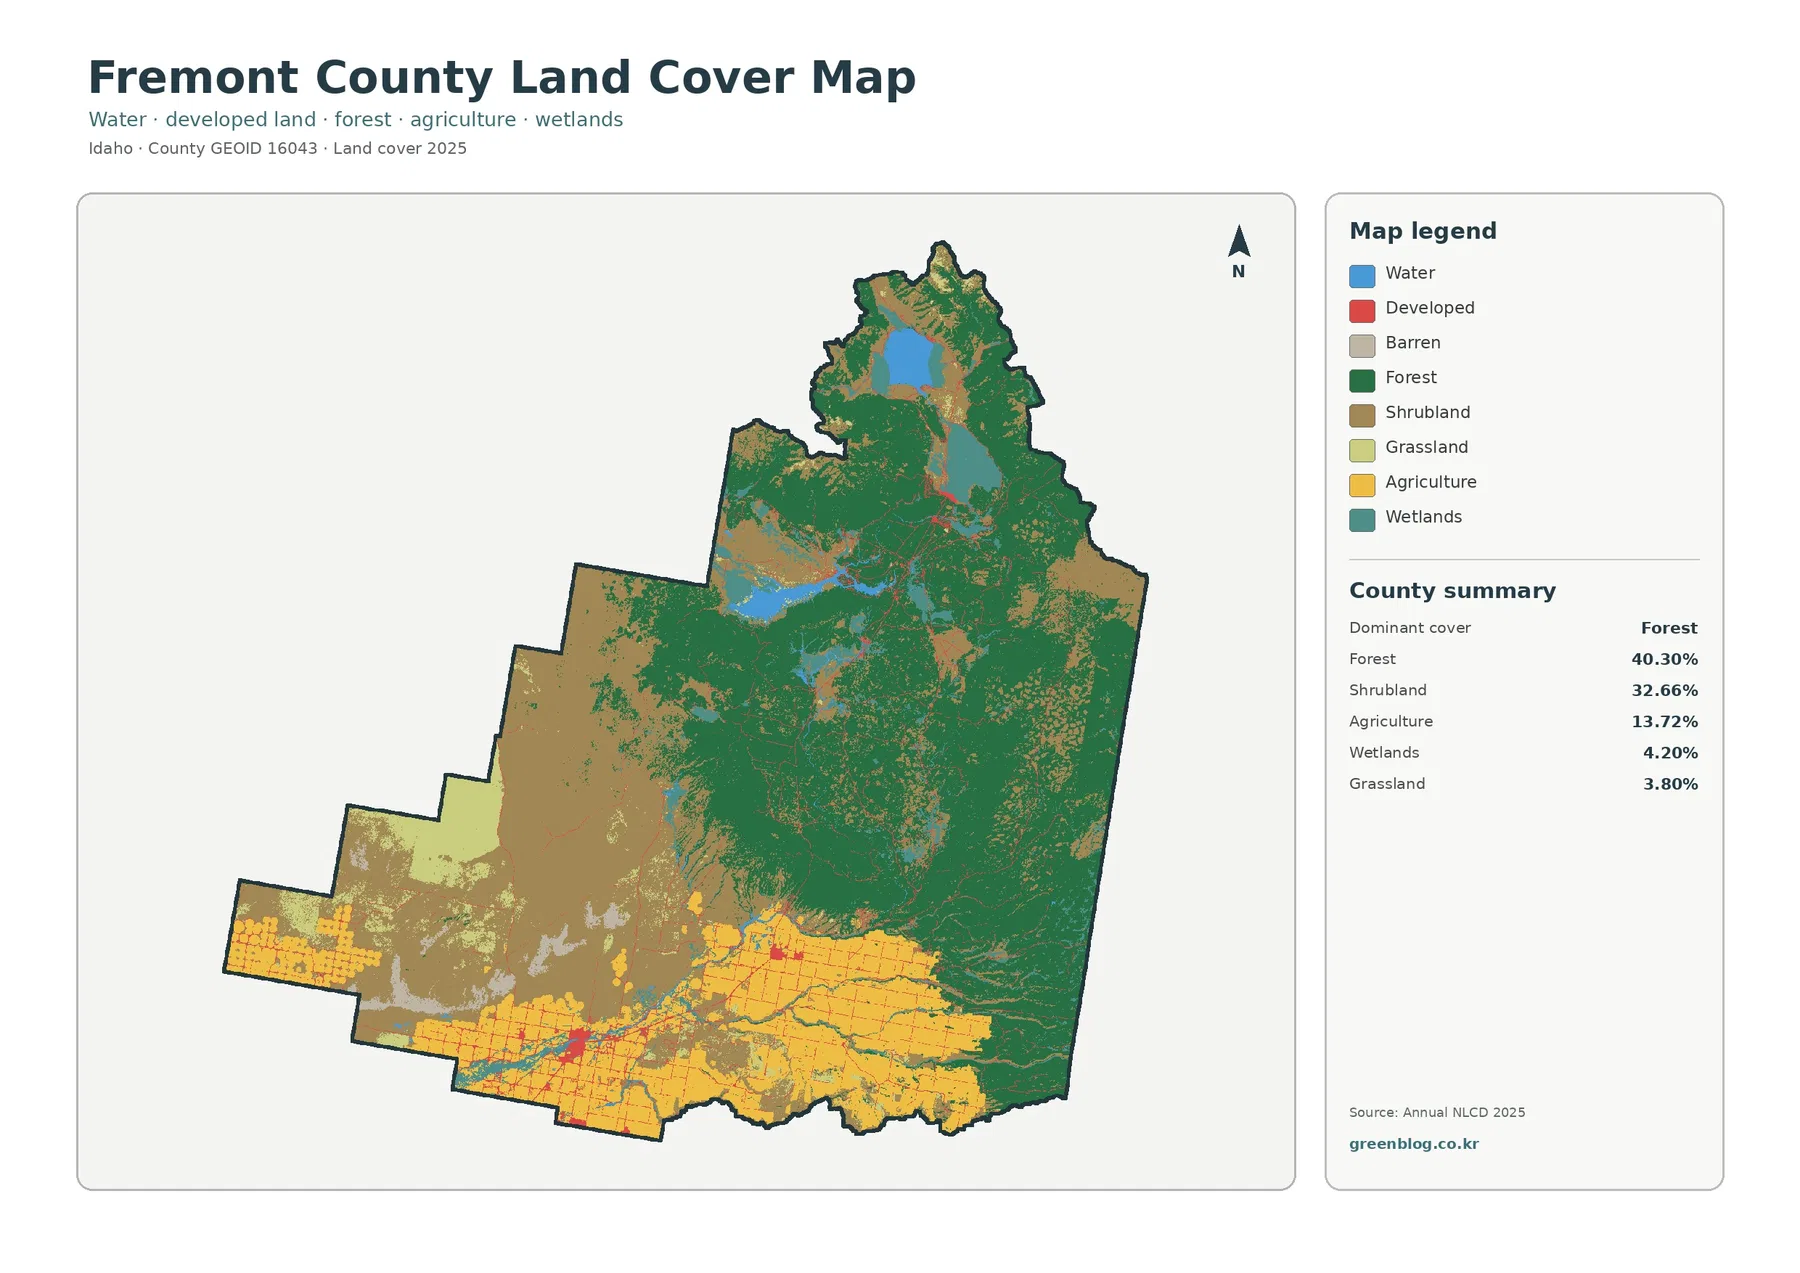
Forest is the dominant class at 40.30%, but the map does not look uniformly green. The most continuous forest lies in the north and east, while the center contains more shrubland, wetland, water, and open ground. Agriculture is much smaller in percentage terms, yet its strong concentration across the south gives it a large visual presence. The result is a county where the location of each class matters almost as much as its total share.
The forest-and-farmland summary lists water at 1.30%. Blue features are most noticeable in the north and central-north, where they contrast sharply with the surrounding forest and wetland colors. Idaho Parks and Recreation identifies Henrys Lake in the Island Park area of northern Fremont County, providing a verified geographic reference for the county’s northern lake setting. Other blue features can be described from the map, but they should not be assigned a name without a separate labeled source.
Wetlands account for 4.20%, a substantial share compared with many other small classes. Teal areas appear around northern water bodies and along elongated corridors through the central part of the county. Water and wetlands should be read separately: blue represents open water, while the wetland class includes land where water strongly influences soil and vegetation. Combining the two would hide an important difference in how the surface is classified.
The farm pattern becomes much easier to follow when cropland and pasture are separated
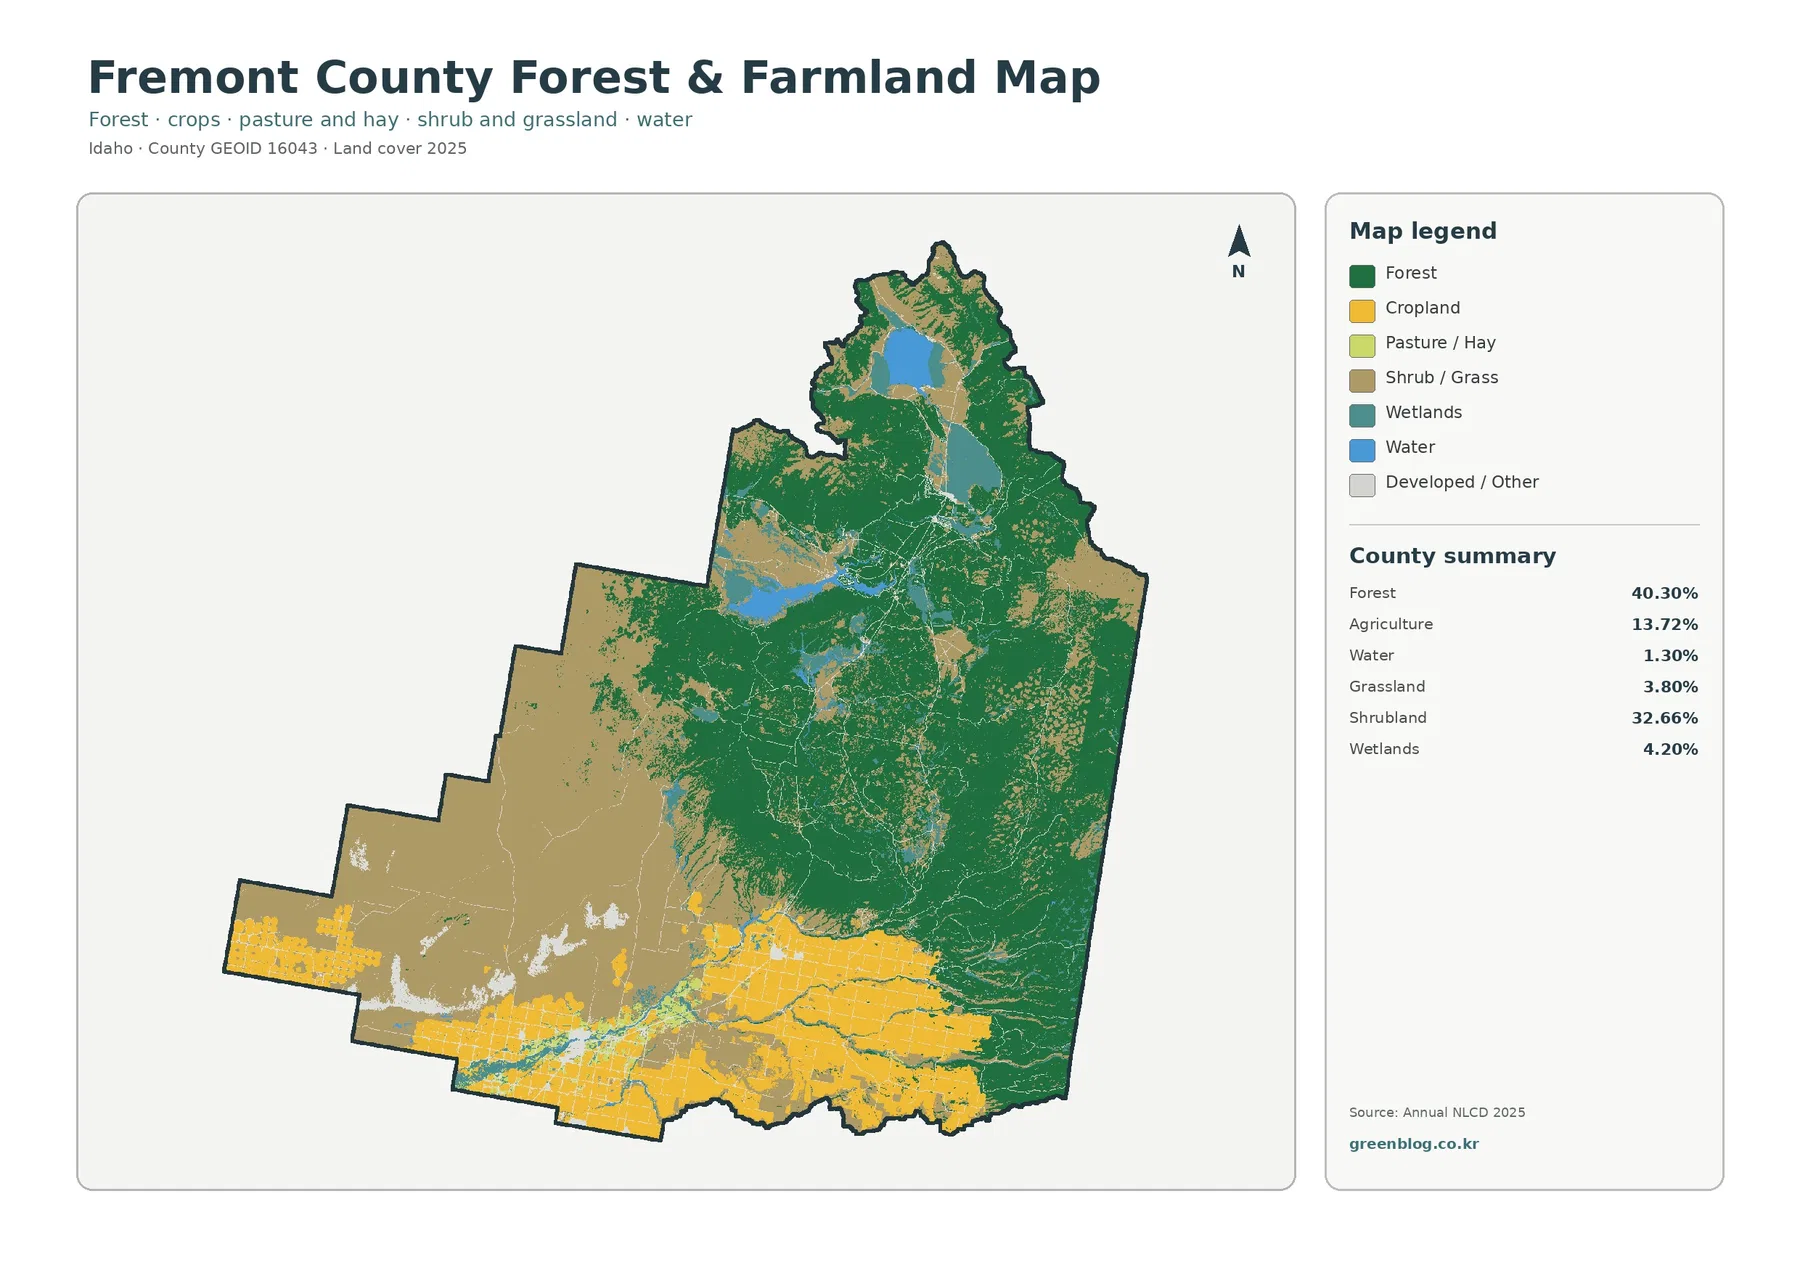
The forest-and-farmland map shows a broad agricultural belt across the south, with large yellow cropland blocks extending from the southwest toward the southeast. Smaller agricultural areas continue into the south-central part of the county, while forest becomes far more dominant to the east and north. This view is useful because it removes some of the general-map detail and makes the agricultural boundary easier to follow.
University of Idaho Extension in Fremont County provides programs for cereal grain production, forage, potatoes, livestock, and farm management. Those local programs confirm that the county’s agricultural economy includes several kinds of production rather than a single crop. The map itself does not identify individual crop species, so a yellow cropland block should not be labeled as potatoes, grain, or another crop unless a separate crop dataset is consulted.
Pasture and hay are mapped separately from cropland. In the southern agricultural zone, light-green pasture or hay areas appear among yellow fields and open shrub or grass land. That distinction is useful for a county where forage and livestock are part of the local agricultural program. It also prevents all productive land from being treated as the same land-cover class.
Built surfaces remain limited and cluster mainly inside the southern settlement grid
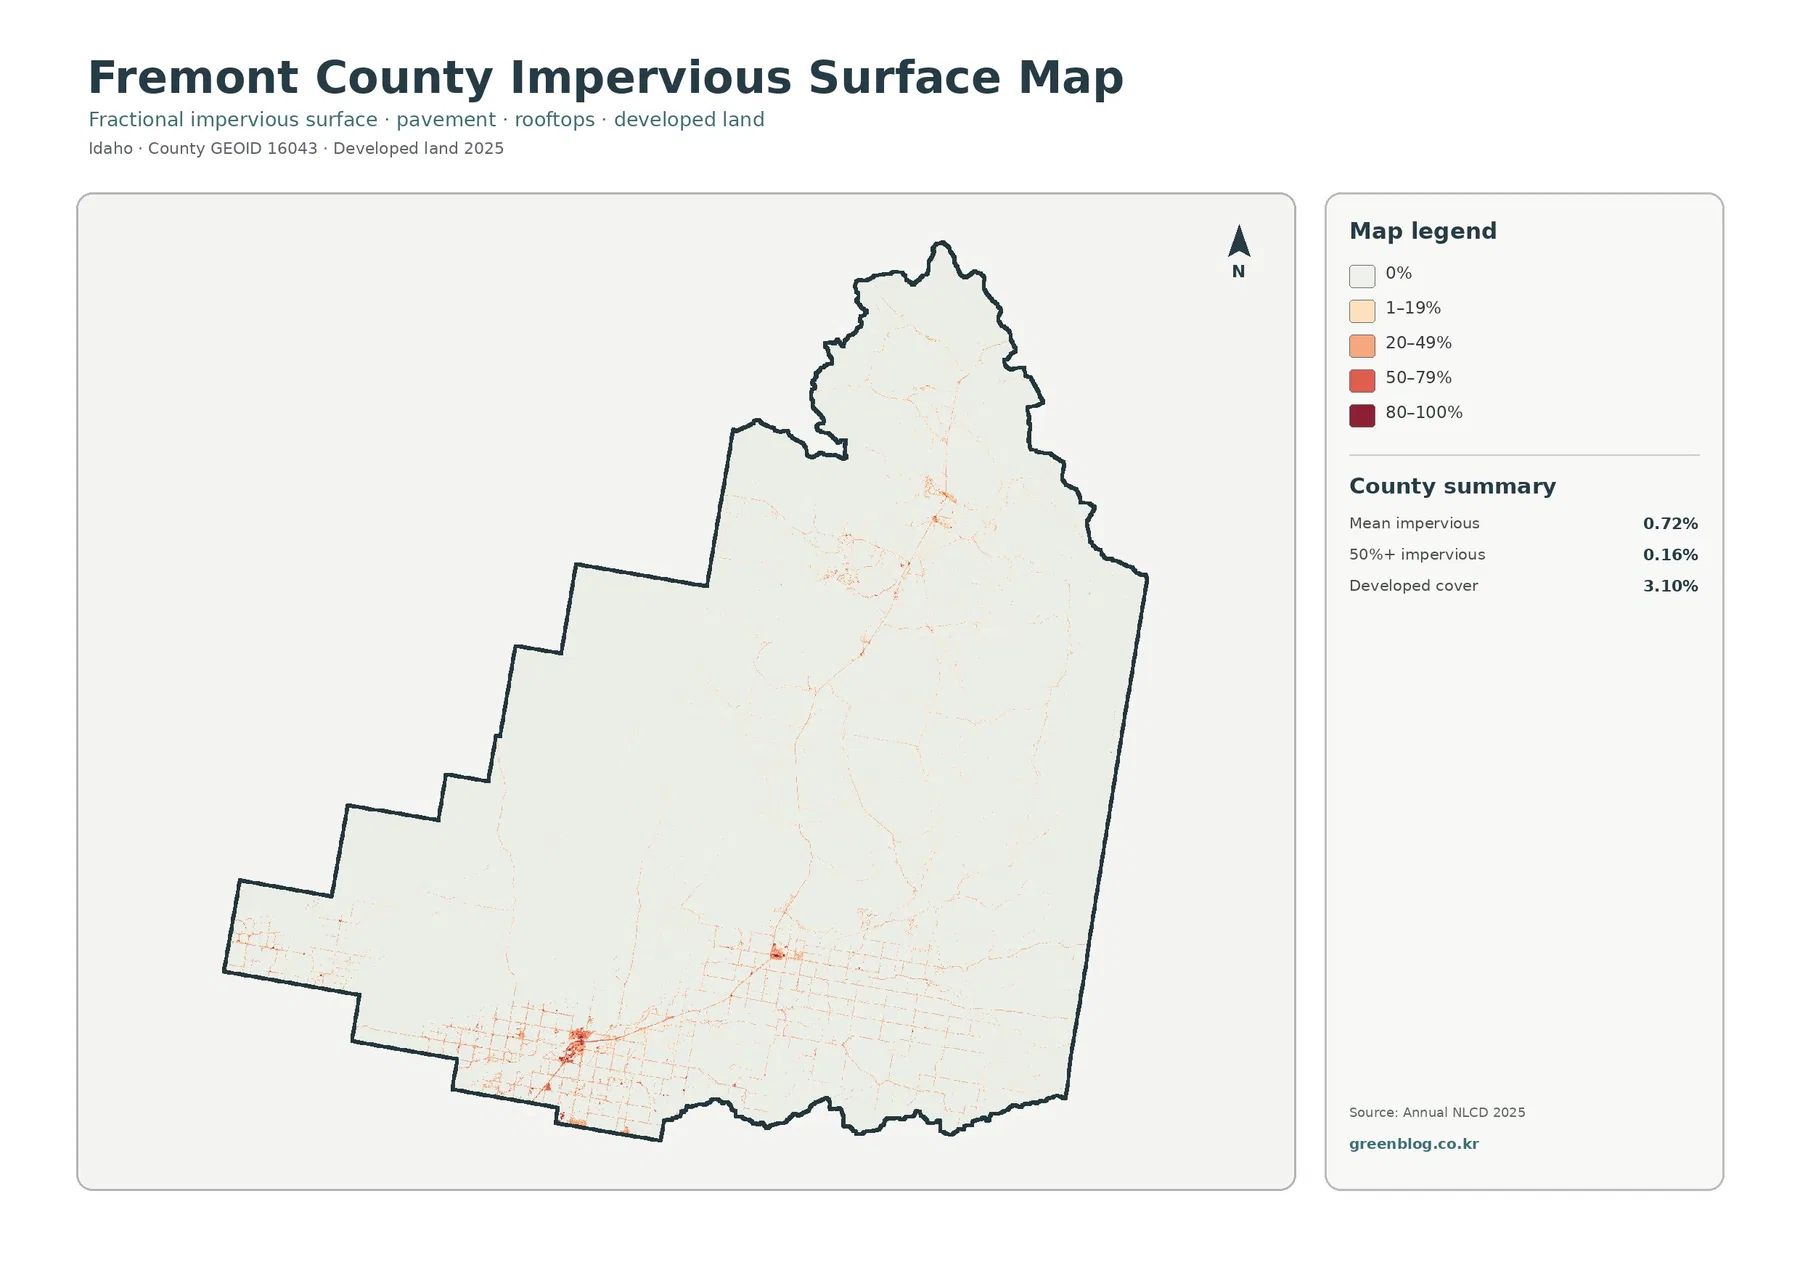
Impervious surface means pavement, rooftops, parking areas, and similar surfaces that do not readily absorb water. Fremont County’s mean impervious value is 0.72%, and cells with at least 50% impervious cover account for 0.16% of the county. Developed land cover is 3.10%. These values are small compared with forest, shrubland, or agriculture, which fits the largely rural appearance of the map.
The strongest developed pattern is in the southern agricultural zone. A road grid is visible across the farm belt, with a few darker clusters where impervious cover is more concentrated. A smaller network extends north through the center of the county, but most of the northern forest area remains pale. The map therefore shows settlement and transportation as localized corridors rather than one broad continuous urban surface.
Developed land and impervious cover are related but not interchangeable. A developed raster cell can include lawn, soil, trees, or other permeable surfaces along with pavement or buildings. For that reason, the 3.10% developed share is not a measurement of concrete and asphalt, and the 0.72% mean impervious value should not be described as the county’s urban-area percentage.
Northern lakes and wetland corridors add a second pattern beyond forest and farming
Water is only 1.30% of the county, yet it is one of the easiest classes to locate visually because blue contrasts strongly with the surrounding green and brown. The most prominent water features are in the north and central-north. Wetlands are more extensive at 4.20%, spreading around several of those water features and along narrow corridors that continue through forest and shrubland.
Henrys Lake State Park describes Henrys Lake as a high mountain lake in the Island Park area, while Idaho DEQ also identifies Henrys Lake and Island Park Reservoir in the Henrys Fork regional water system. Those sources make the northern water setting a verified part of Fremont County’s geography. The map can show where water and wetlands are concentrated, but it does not contain enough labeling to name every lake, reservoir, stream, or wetland complex.
Most of the 22.99% mapped difference falls into the broad “other class difference” category
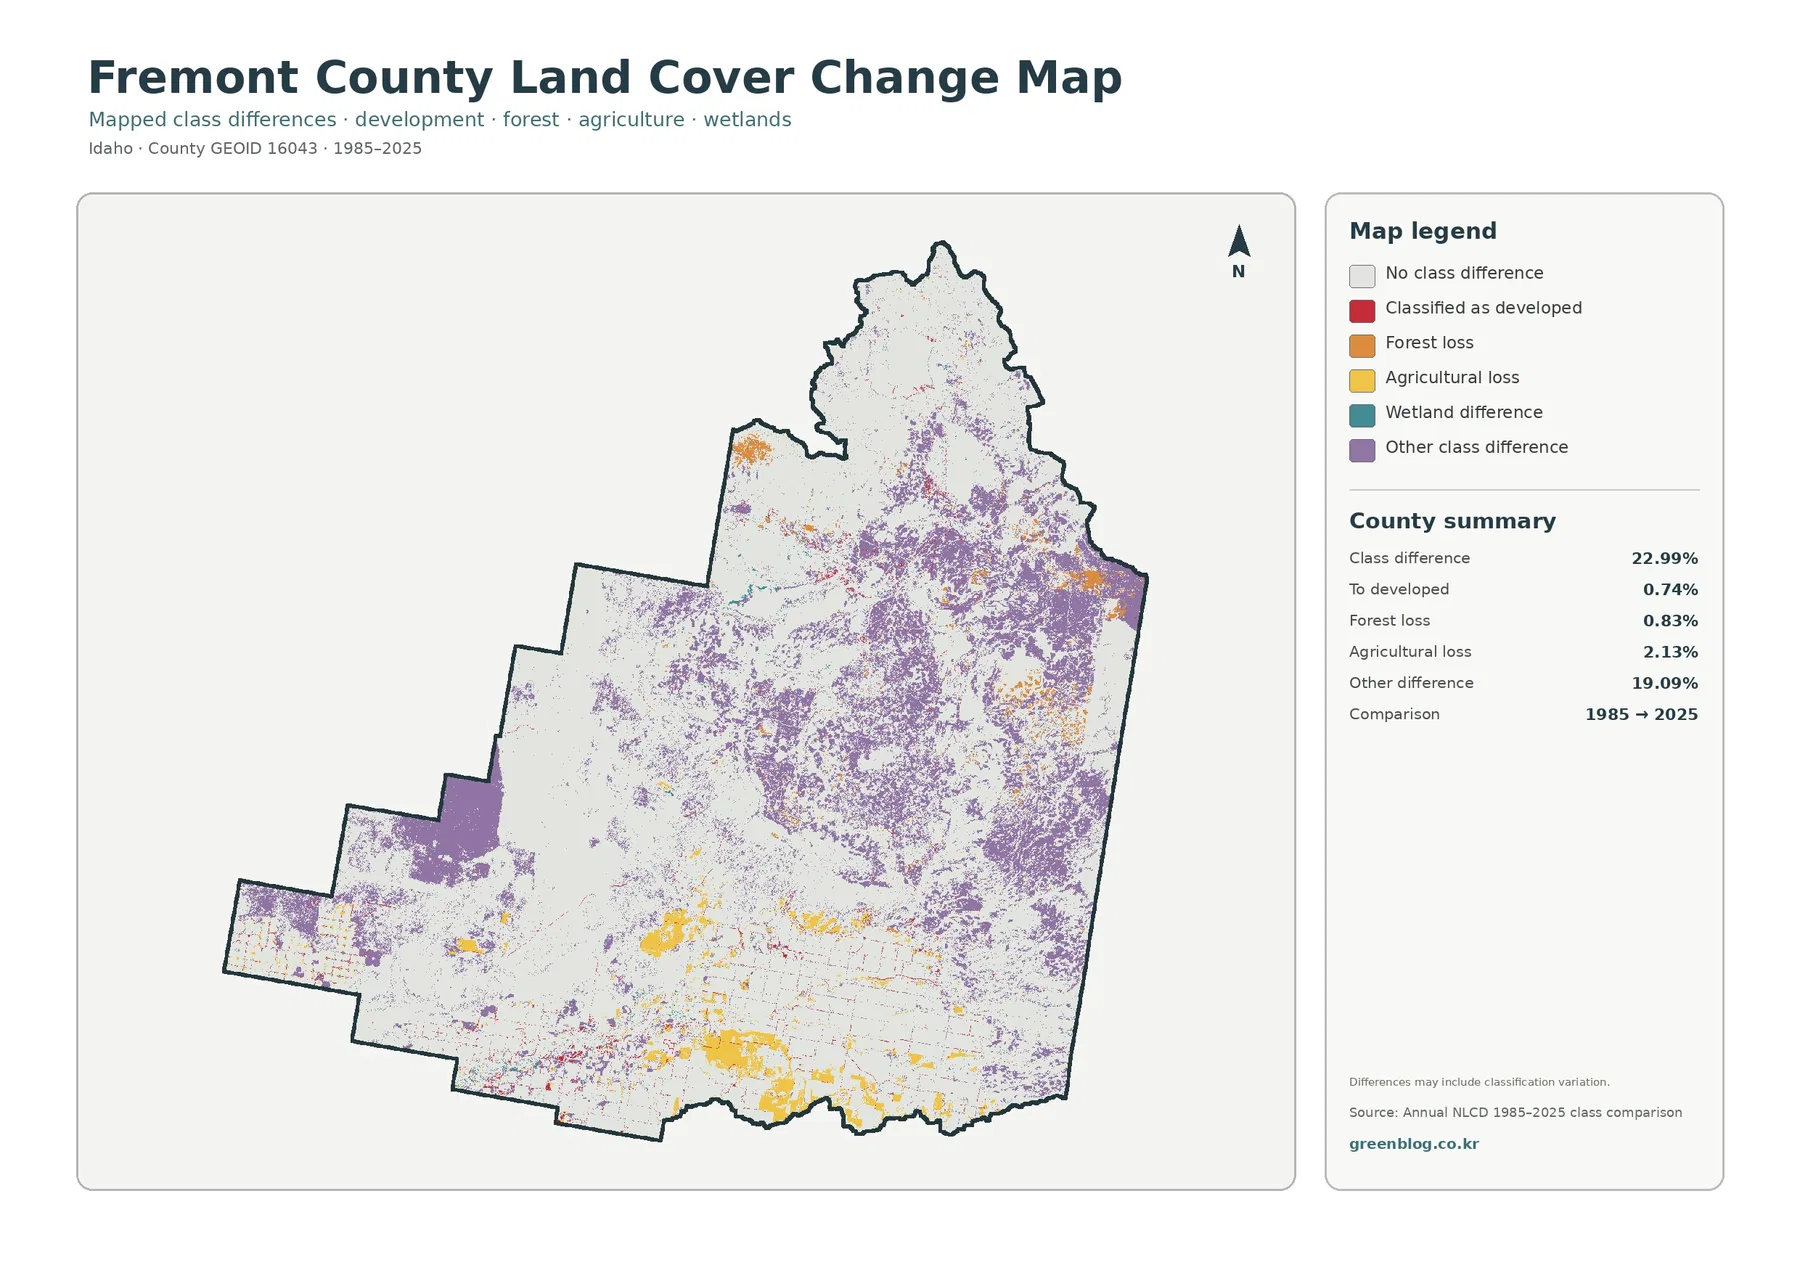
The change map reports a total class difference of 22.99%. Purple “other class difference” dominates the summary at 19.09% and is widely scattered across the center, east, and north. Yellow agricultural-loss patches are easier to see in the southern farm belt, while smaller red and orange areas mark cells classified to developed or placed in the forest-loss category.
A note on the map explicitly warns that differences may include classification variation. Comparing 1985 with 2025 spans changes in imagery, sensors, classification methods, and mixed-cell interpretation. A cell can therefore receive a different class even when the real-world change is more complicated than the legend category suggests. The 22.99% figure should not be presented as a direct land-conversion rate.
Land-cover colors are not parcel lines, ownership records, or zoning designations
Annual NLCD is a 30-meter raster product. A raster divides the landscape into grid cells and assigns a representative class to each cell. A single cell can contain trees, pavement, soil, water edge, or a small structure at the same time, so a sharp color boundary on the map should not be treated as a surveyed field edge or property boundary.
Land cover also differs from legal land use. Forest color does not establish public ownership, and agricultural color does not prove agricultural zoning. Fremont County’s comprehensive plan, land-use maps, parcel records, and agency ownership data are more appropriate when the question concerns permits, development rights, ownership, or legal land classification.
Use the same year and map type when printing or comparing counties
For a printed overview, the general 2025 map works well as the first page because the main percentages and spatial pattern can be understood together. A second page can use the forest-and-farmland map when agriculture is the topic, or the impervious map when settlement and transportation matter more. This keeps each map focused rather than repeating the same explanation four times.
Frequently Asked Questions
What is the largest land-cover class in Fremont County?
Forest is the largest class in the supplied 2025 summary at 40.30%. Shrubland follows at 32.66%, agriculture at 13.72%, wetlands at 4.20%, and grassland at 3.80%. The map shows the forest most strongly in the north and east, while agriculture is concentrated across the south.
Why do water and wetlands stand out even though they are not the largest classes?
They are concentrated and use colors that contrast sharply with surrounding forest and shrubland. Water is listed at 1.30%, while wetlands account for 4.20%. The most visible water and wetland features occur in the north and central-north, so their location makes them more noticeable than the countywide percentages alone would suggest.
Does the 22.99% 1985-to-2025 class difference equal a land-conversion rate?
No. The map compares classifications from two years and warns that classification variation may be included. It lists 0.74% classified to developed, 0.83% forest-loss category, 2.13% agricultural-loss category, and 19.09% other class difference, but determining the timing and cause of a real change requires intermediate annual data and other supporting records.
Map File Information
The four original JPG maps for Fremont County are provided together in one ZIP file.
- Intended Use: printing, county comparison, classroom and presentation reference
Related Maps
Sources and references
- MRLC Annual NLCD Data – annual land-cover and impervious products used for the map set
- USGS Annual NLCD Land Cover Classification – class definitions and 30-meter raster interpretation
- Fremont County Comprehensive Plan – county natural-resource, land-use, agricultural-suitability, and planning materials
- University of Idaho Extension – Agriculture in Fremont County – local cereal, forage, potato, livestock, and farm-management programs
- Idaho DEQ – Henrys Fork Subbasin – Henrys Lake, Island Park Reservoir, and regional water and land-use context
- Idaho Parks and Recreation – Henrys Lake State Park – verified northern Fremont County lake context
Green Map creates custom-edited map images using open geographic data sources such as geoBoundaries, Natural Earth, OpenStreetMap, and government open data.
These maps are edited visual materials, not raw data files, and are provided for education, documents, presentations, and graphic reference.