Boundary County’s 2025 land-cover pattern is dominated by forest, which accounts for 75.70% of the supplied summary. The main exception is the broad Kootenai River valley running north through the middle of the county. Cropland forms a long yellow band there, while the strongest developed concentration sits around Bonners Ferry. This Boundary County Idaho Land Cover Map is best understood as a contrast between heavily forested mountain blocks and a narrow river valley where farming, water, and settlement are concentrated.
The page includes four views: 2025 land cover, forest and farmland, impervious surface with developed land, and a 1985–2025 class-difference comparison. The WebP versions are shown with the discussion, and the four original 2480 × 1754-pixel JPG files are available together in one ZIP below. Comparing the same place across the set separates the Kootenai farm belt, the Bonners Ferry hard-surface core, surrounding forest, and endpoint class differences without compressing everything into one small graphic.
Table of Contents
Three quarters of the county is forest, but the center opens into a very different valley
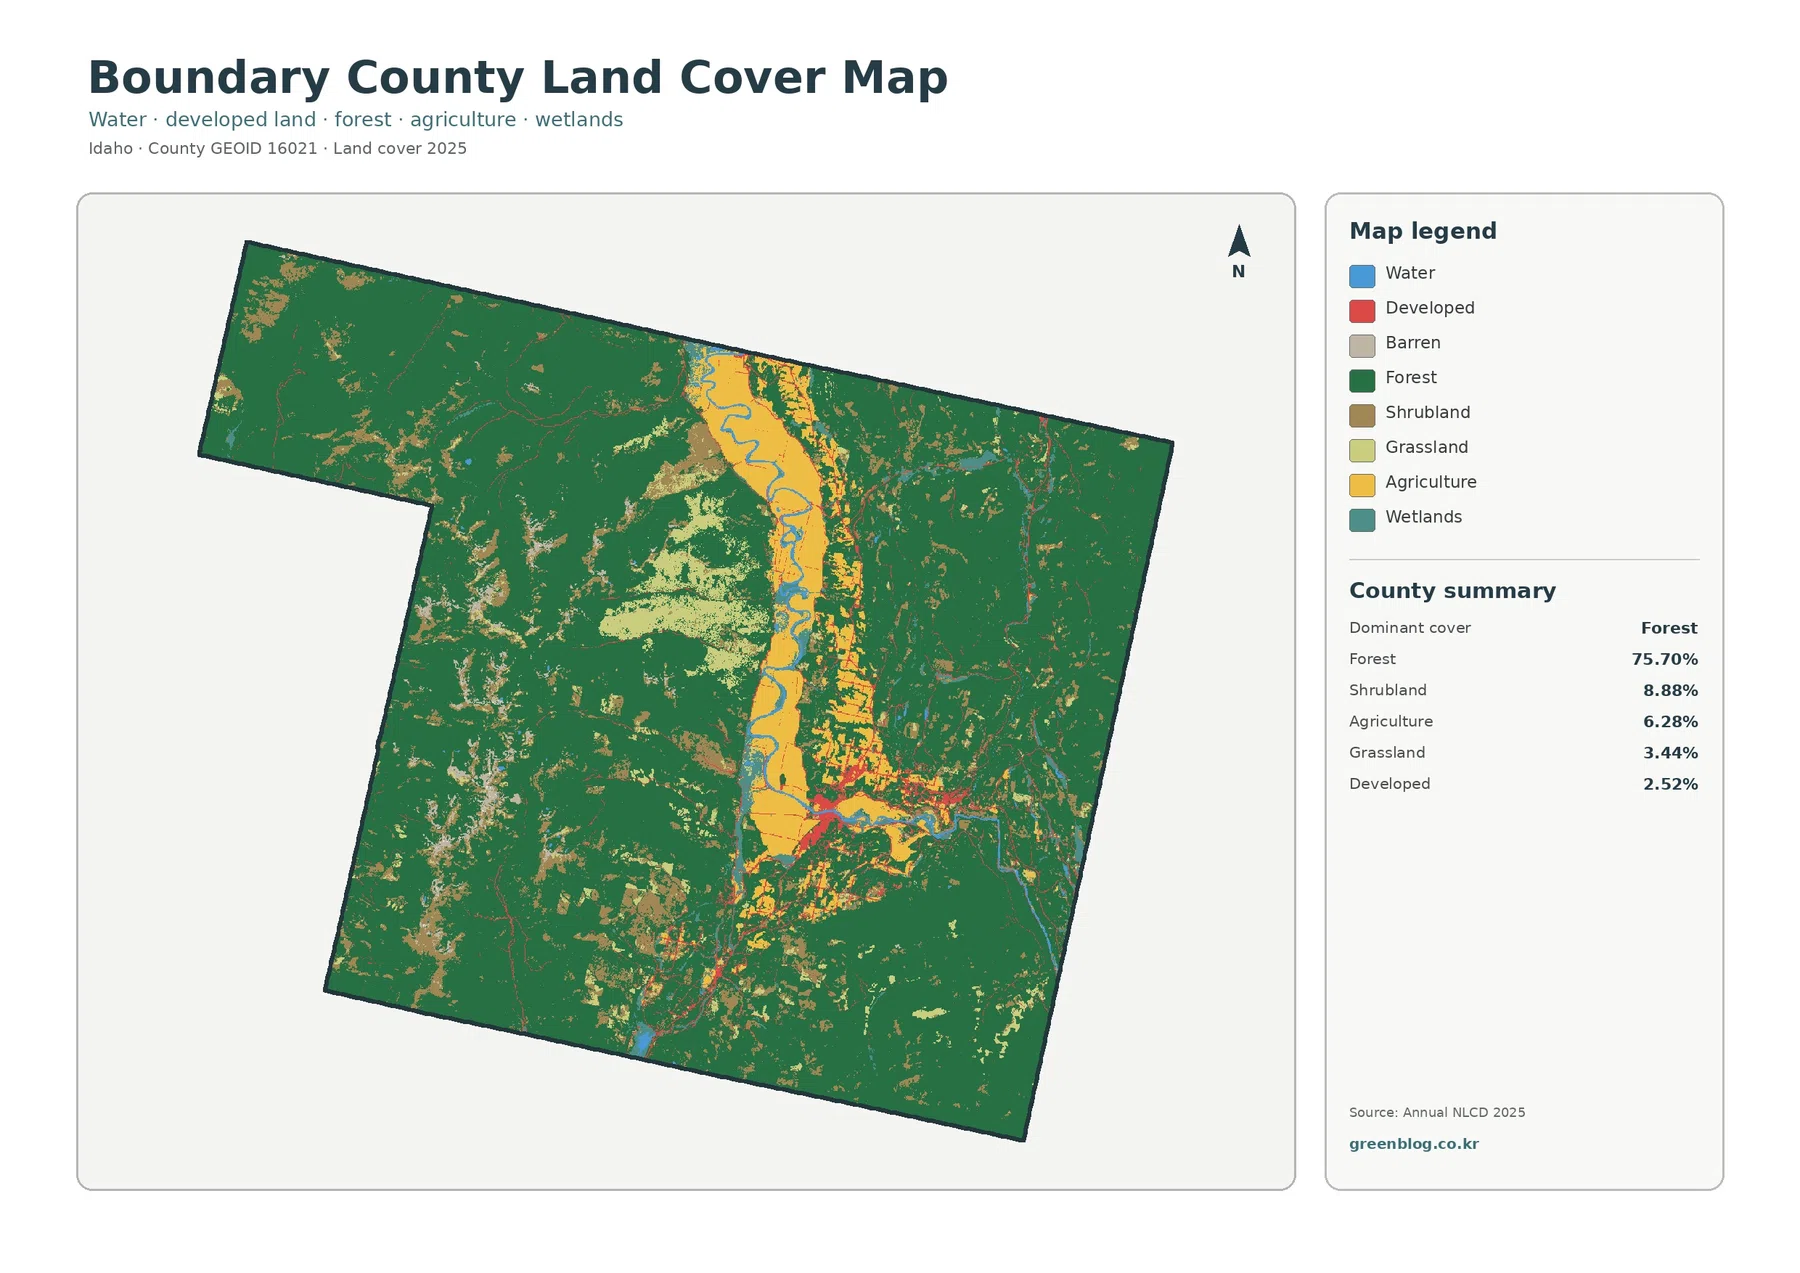
Dark green forest covers nearly all of the western, eastern, and southern mountain country. The 75.70% figure is therefore not the result of scattered wooded patches; it reflects large connected forest blocks that fill most of Boundary County outside the central valley. From the northwest extension to the southeast side, forest remains the visual background, while the Kootenai corridor cuts through it as a long strip of yellow agriculture and blue water.
Shrubland is 8.88% and grassland 3.44%. These open classes interrupt the forest in several mountain and slope areas rather than forming one continuous plain. A broader patch of open vegetation is visible west of the central valley, with smaller areas scattered through the south and east. Their distribution matters because pale open ground is not automatically farmland. Most non-forest surfaces outside the Kootenai valley belong to shrub or grass classes instead of the agricultural category.
The Kootenai farm belt is the clearest break in the surrounding forest
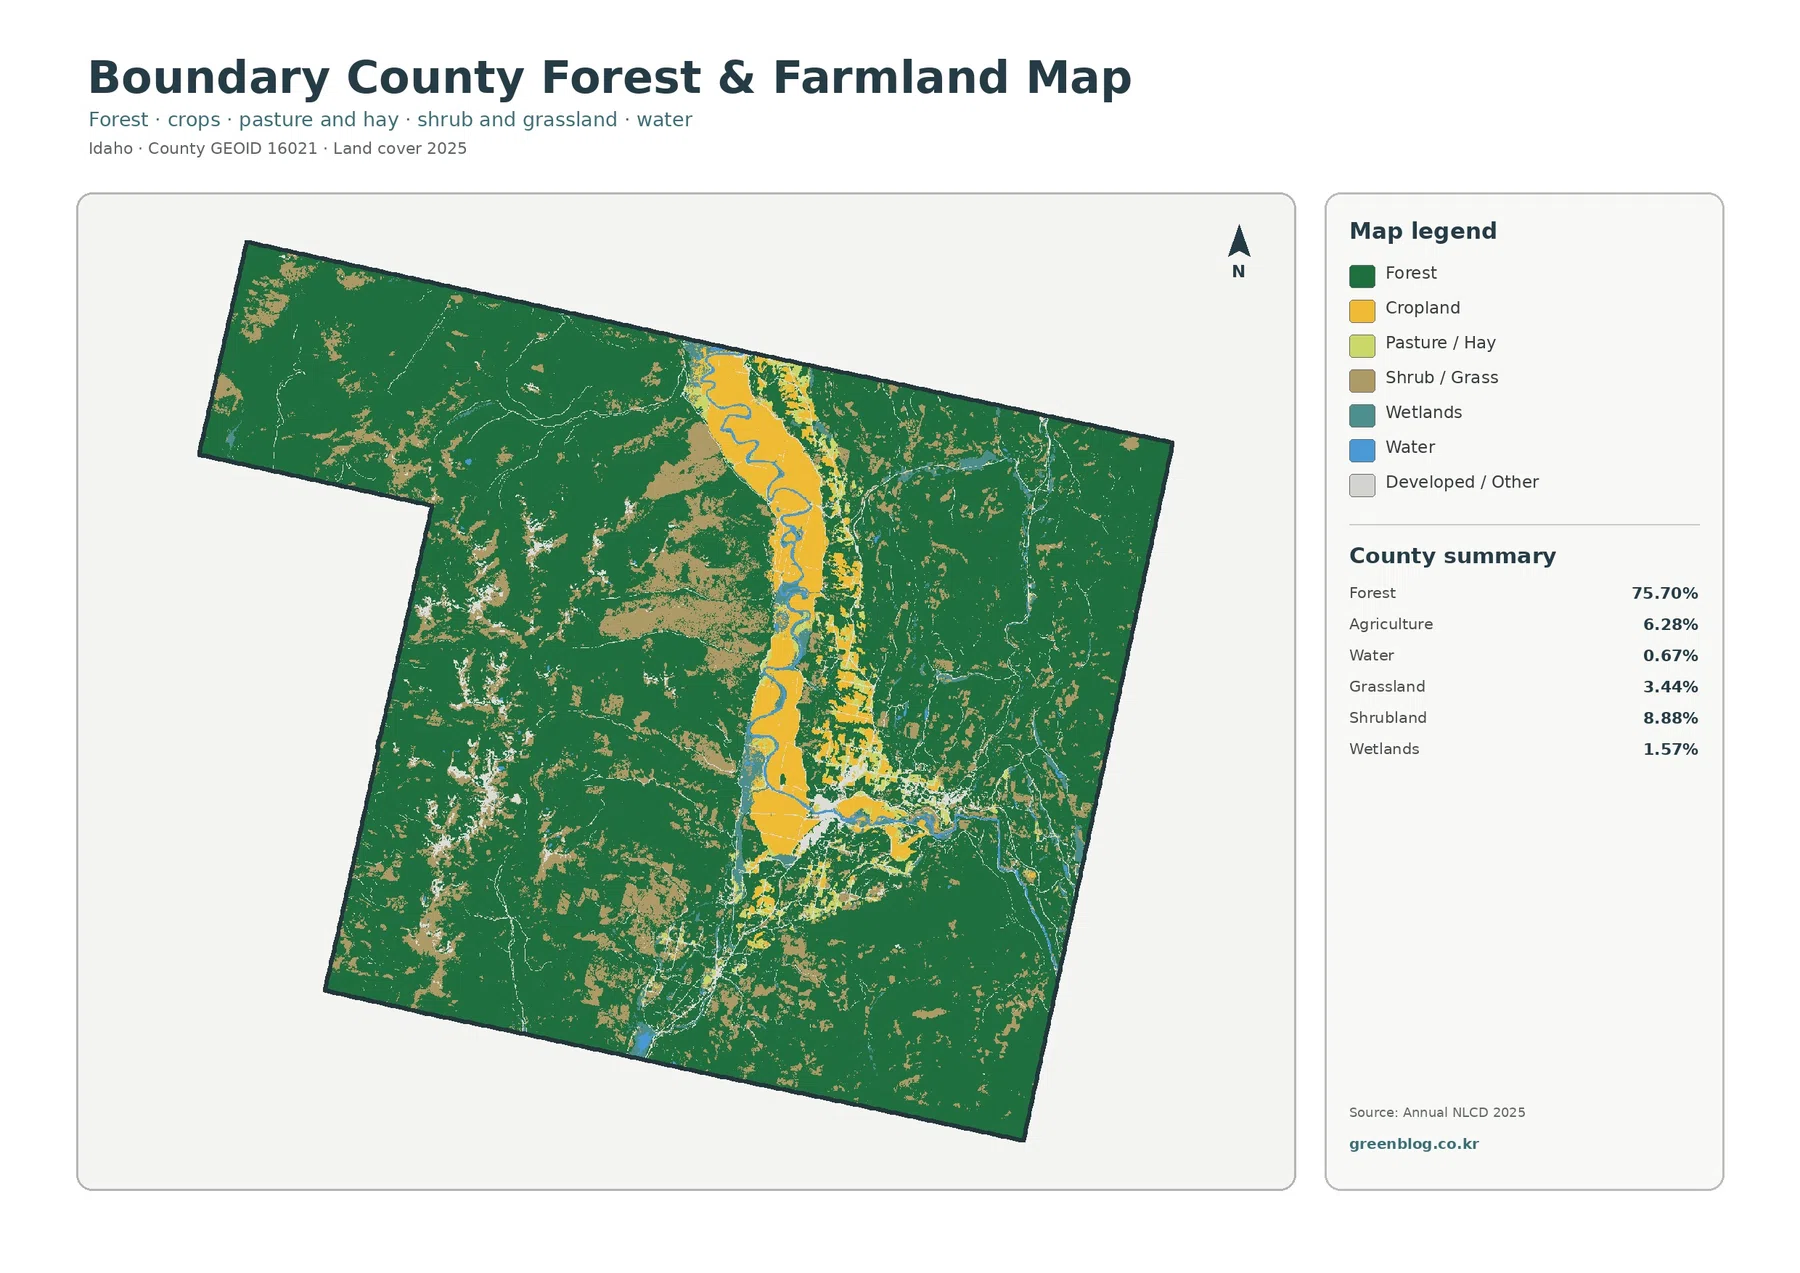
Agriculture represents 6.28% of the 2025 summary, but its location makes it one of the most recognizable parts of the county. Yellow cropland follows the Kootenai River valley north from Bonners Ferry toward the Canadian border in a broad, nearly continuous strip. Smaller agricultural patches also occur south of Bonners Ferry and in a few other open valleys, but none approach the length or width of the main Kootenai belt.
Boundary County’s comprehensive plan describes the same valley as a major agricultural landscape created on fertile sediments deposited by the Kootenai River. It specifically notes that cultivated land borders the river north of Bonners Ferry toward Canada. That official description provides context for the yellow band visible in the supplied image. The map does not identify crop type or ownership, but it clearly separates the cultivated valley floor from the forested mountain slopes on both sides.
The contrast is strengthened by the county’s topography. Official natural-resource material describes the Selkirk Mountains to the west, the Purcell Mountains to the northeast, and the Cabinet Mountains to the southeast, with the broad Purcell Trench and river valleys separating them. On the image, the mountains are overwhelmingly green, while the flatter central corridor is yellow, blue, and locally red. The visual transition from cropland to forest therefore occurs across a relatively narrow distance in several parts of the county.
Bonners Ferry forms a compact hard-surface core inside a mostly low-impervious county
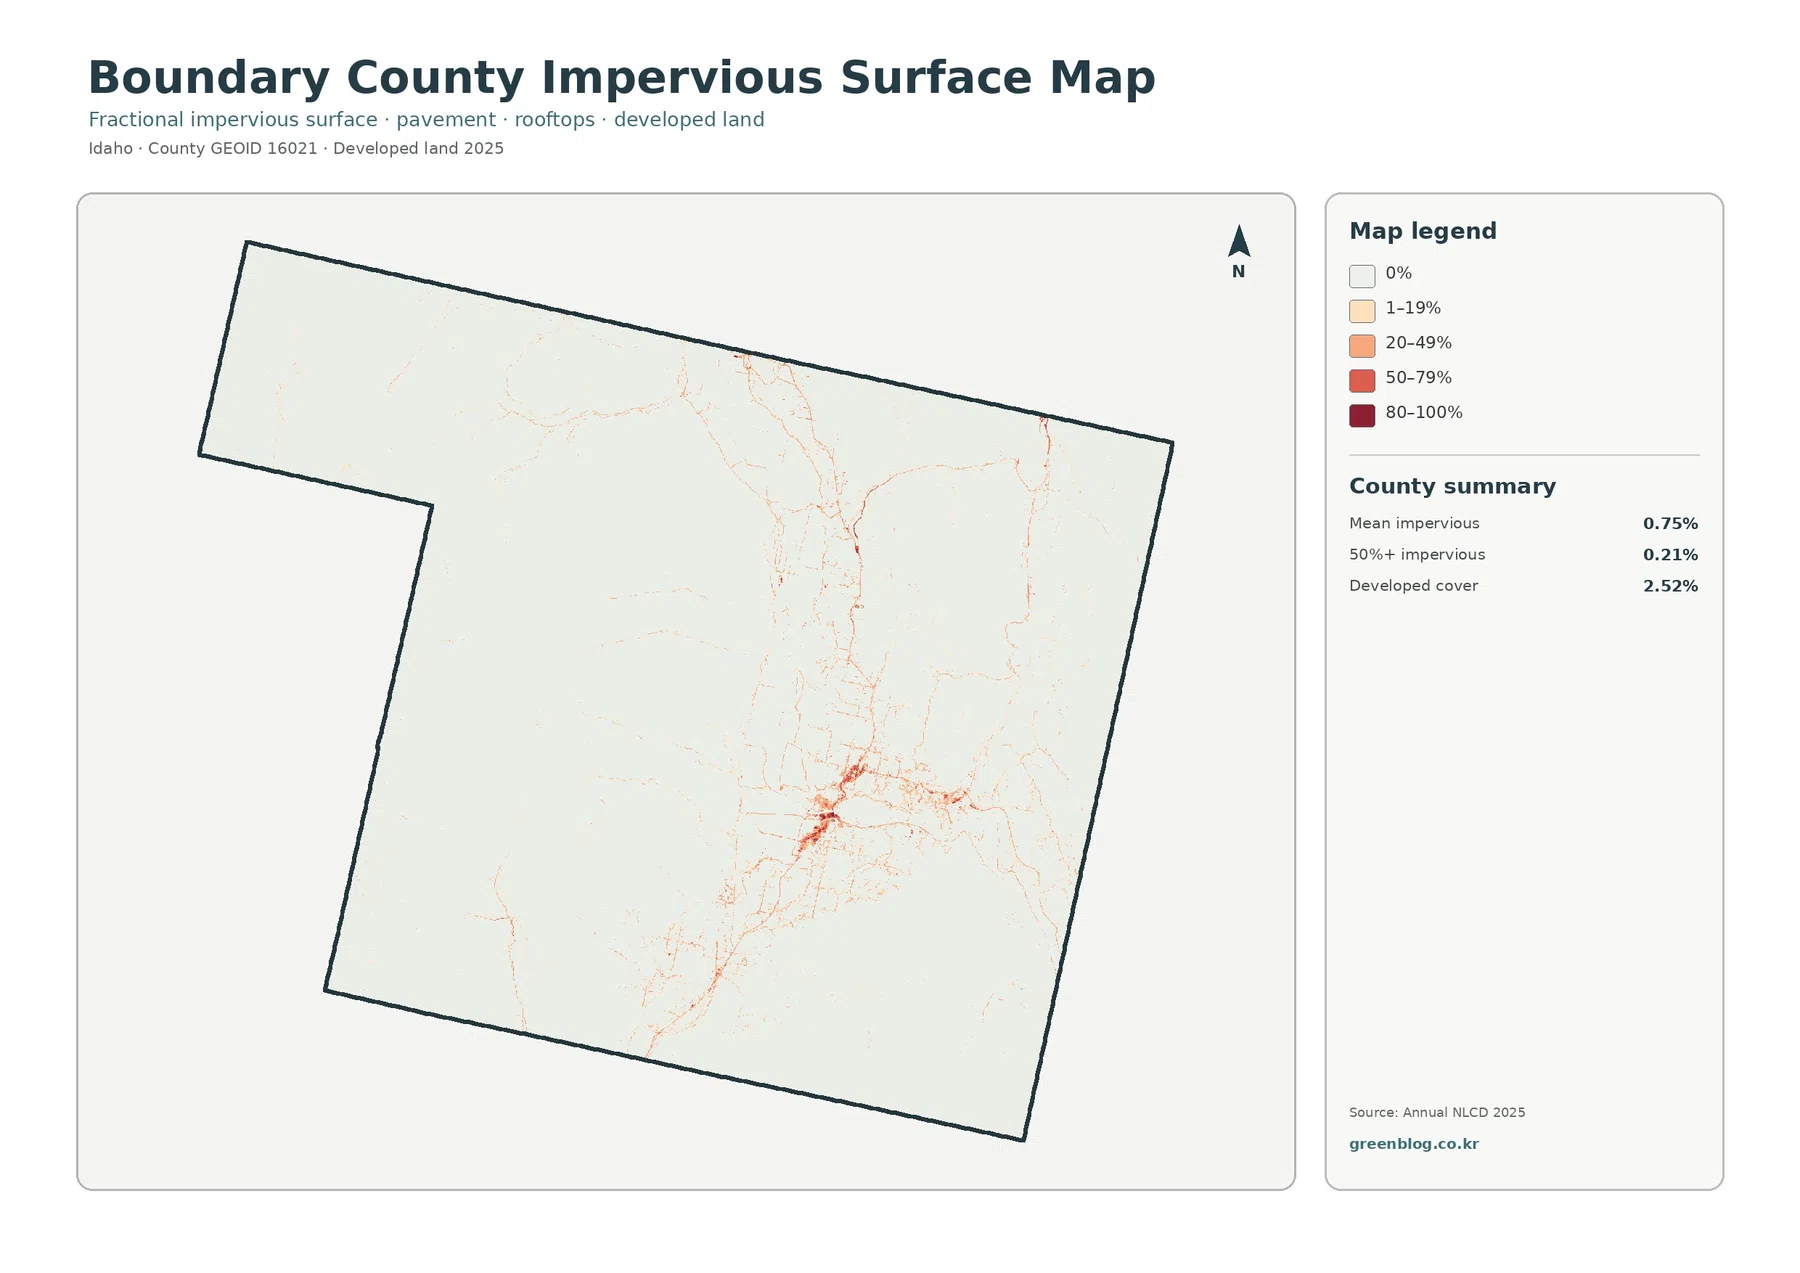
Impervious surface refers to hard cover such as rooftops, pavement, and parking areas where water does not readily soak into the ground. Boundary County’s mean impervious value is 0.75%, and only 0.21% of the county falls in cells with at least 50% impervious cover. Those low values fit a county where forest occupies more than three quarters of the land and farming dominates much of the main valley outside the town center.
The strongest orange and red concentration is centered on Bonners Ferry. From that core, thin impervious traces extend north along the valley and east toward the county’s other settlement areas. The image does not label highways or municipal limits, so the lines should not be used as a road network. Their value here is to show that hard surfaces are tightly clustered around a few connected places rather than spread evenly through the county.
Developed land is 2.52%, higher than the 0.75% mean impervious figure because the two measures describe different things. A developed land-cover class can include lawns, trees, soil, and other permeable surfaces around buildings and roads. The impervious layer isolates the hard portion within those developed areas. Bonners Ferry therefore appears as a broader developed patch on the land-cover image and as a smaller, more intense hard-surface concentration on this layer.
The 19.23% endpoint difference is driven mostly by forest and other class changes
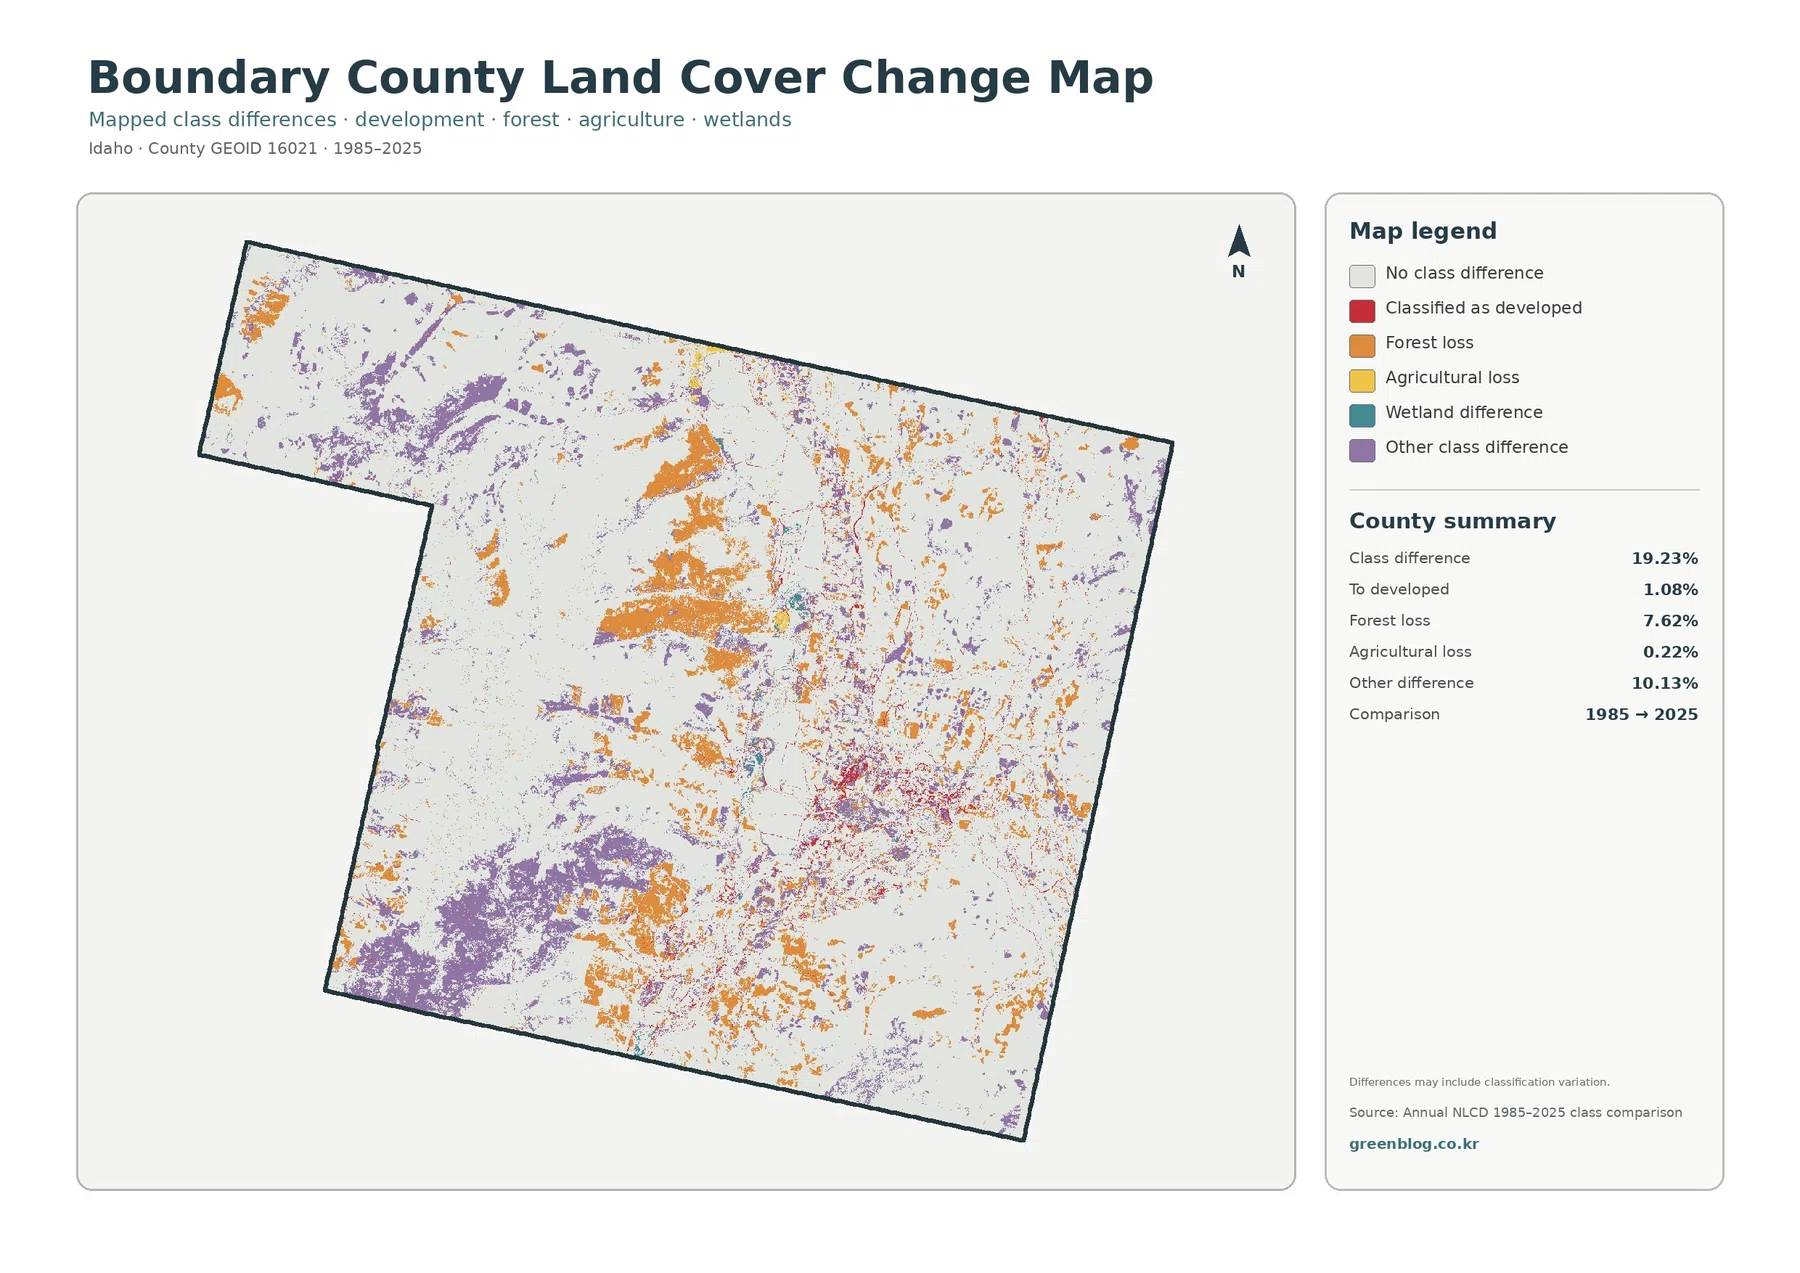
The supplied comparison marks 19.23% of Boundary County as having a different class in 1985 and 2025. Only 1.08% is listed as classified to developed. Forest loss is 7.62%, agricultural loss 0.22%, and other class difference 10.13%. The total therefore should not be described as a 19.23% development increase. Most of the endpoint difference belongs to forest or other non-developed classification changes.
Orange forest-loss areas are visible through parts of the central-western mountain block, north-central uplands, and several southern areas. Purple other-difference patches are broad in the northwest and southwest and occur in smaller pieces across the east. Red developed-difference marks are much more localized around Bonners Ferry and the central valley. The distribution shows that the largest long-term differences are not confined to the built corridor.
Forest loss on this layer means that a cell was classified as forest at one endpoint and as another class at the other. It does not identify the cause. Timber activity, wildfire, vegetation succession, long-term moisture differences, or classification variation could produce different endpoint labels. A specific orange patch requires intermediate imagery and additional records before a cause can be assigned.
Selkirk, Purcell, and Cabinet mountain blocks explain why the valley pattern is so narrow
Boundary County’s official comprehensive plan describes three major mountain ranges: the Selkirks in the west, the Purcells in the northeast, and the Cabinets in the southeast. Between them lie the Purcell Trench and the Kootenai and Moyie river valleys. This physical arrangement matches the supplied land-cover pattern closely. Forest dominates the mountain blocks, while agriculture and development are concentrated in the lower, more open valleys.
The Kootenai valley is much broader than the narrow Moyie corridor. North of Bonners Ferry, cultivated land occupies a wide strip on both sides of the river. Eastward, water and development traces pass through narrower openings surrounded by forest. Reading those valleys separately helps explain why one central band is strongly agricultural while other openings remain mostly forest, shrub, or grass.
Compare the same valley location across the four files
The endpoint comparison should be paired with a current-cover image because its colors answer a different question. Purple and orange on the 1985–2025 layer do not describe current shrubland or forest classes; they mark cells whose endpoint classifications differ. Looking back to the current image prevents a class-difference color from being mistaken for a present land-cover category.
Thirty-meter cells and the 2025 observation year limit site-level interpretation
Annual NLCD is a raster product, which means the landscape is divided into square cells and each cell receives a predominant class. At the commonly used 30-meter scale, a single cell may contain trees, grass, a road, a building, and bare ground but still be represented by one category. Narrow river channels, field edges, small wetlands, and roads can therefore look simplified or wider than they are on the ground.
The current maps are labeled with the supplied 2025 observation year. Construction, logging, wildfire, vegetation recovery, agricultural change, or river conditions after that date may not appear. The change layer compares only 1985 and 2025 endpoints; it does not record every intermediate year. A location could change more than once between those dates and still end in a class similar to its starting point.
Four original JPG files in one download
The ZIP contains the original JPGs for 2025 land cover, forest and farmland, impervious surface and developed land, and 1985–2025 land-cover change. Keeping them together makes it easy to compare the Kootenai valley, Bonners Ferry, forested mountain blocks, and endpoint differences at the same image size.
Frequently Asked Questions
What is the largest land-cover class in Boundary County?
Forest is the largest 2025 class at 75.70%. The main visual break is the central Kootenai River valley, where agriculture, water, wetlands, and the Bonners Ferry developed core form a long open corridor between forested mountain blocks.
Why does agriculture look so prominent when it covers only 6.28%?
Agriculture is concentrated in a broad, continuous valley rather than scattered evenly through the county. Boundary County’s comprehensive plan describes the Kootenai River valley north of Bonners Ferry toward Canada as a major agricultural area on fertile river-deposited soils.
Does the 19.23% class difference mean that much of the county was developed?
No. Only 1.08% is listed as classified to developed. The total also includes 7.62% forest loss, 0.22% agricultural loss, and 10.13% other class difference, so the endpoint total combines several kinds of classification change.
Sources and Reference Data
- MRLC Annual NLCD Data – official access point for Annual NLCD land-cover and comparison products
- USGS Annual NLCD Land Cover Classification – definitions for forest, agriculture, developed land, shrubland, grassland, water, and wetlands
- Boundary County Comprehensive Plan – Natural Resources – official county description of the Selkirk, Purcell, and Cabinet Mountains, Purcell Trench, and Kootenai and Moyie river valleys
- Boundary County Comprehensive Plan – Land Use – official context for forest management, Kootenai Valley agriculture, Bonners Ferry, and Moyie Springs
Map File Information
The ZIP contains four original JPG files for comparing Boundary County's 75.70% forest, Kootenai agricultural valley, Bonners Ferry hard surfaces, and 1985–2025 endpoint differences.
- Included Files: Use only the versions confirmed in the article and supplied images
- File Type: Use the confirmed download contents
- Intended Use: Printing, education, presentations, and map-based projects
Related Maps
Green Map creates custom-edited map images using open geographic data sources such as geoBoundaries, Natural Earth, OpenStreetMap, and government open data.
These maps are edited visual materials, not raw data files, and are provided for education, documents, presentations, and graphic reference.