Vermont is a small-population state, but its settlement pattern is not uniform. The strongest concentration sits in the northwest around Burlington and South Burlington, where several neighboring census places and dense census tracts form the state’s clearest urban cluster. Montpelier and Barre create a smaller central hub. Rutland, Bennington, and Brattleboro stand apart in the south, while St. Albans, Newport, and St. Johnsbury serve other parts of the state. Large mountain, forest, and rural areas remain much more lightly populated.
The supplied 2024 ACS 5-year estimates put Vermont’s population at 647,106. The county-density map reports about 9,217 square miles of land and a statewide average near 70 people per square mile. That number conceals a wide internal range. Chittenden County averages about 316 people per square mile, while Essex County is near nine. Chittenden also has by far the largest county population and posted the fastest 2010–2020 growth rate, but other rankings differ: Grand Isle has the second-highest county density despite having one of the smallest population totals.
Table of Contents
Burlington and its neighboring communities form Vermont’s clearest tract-level concentration
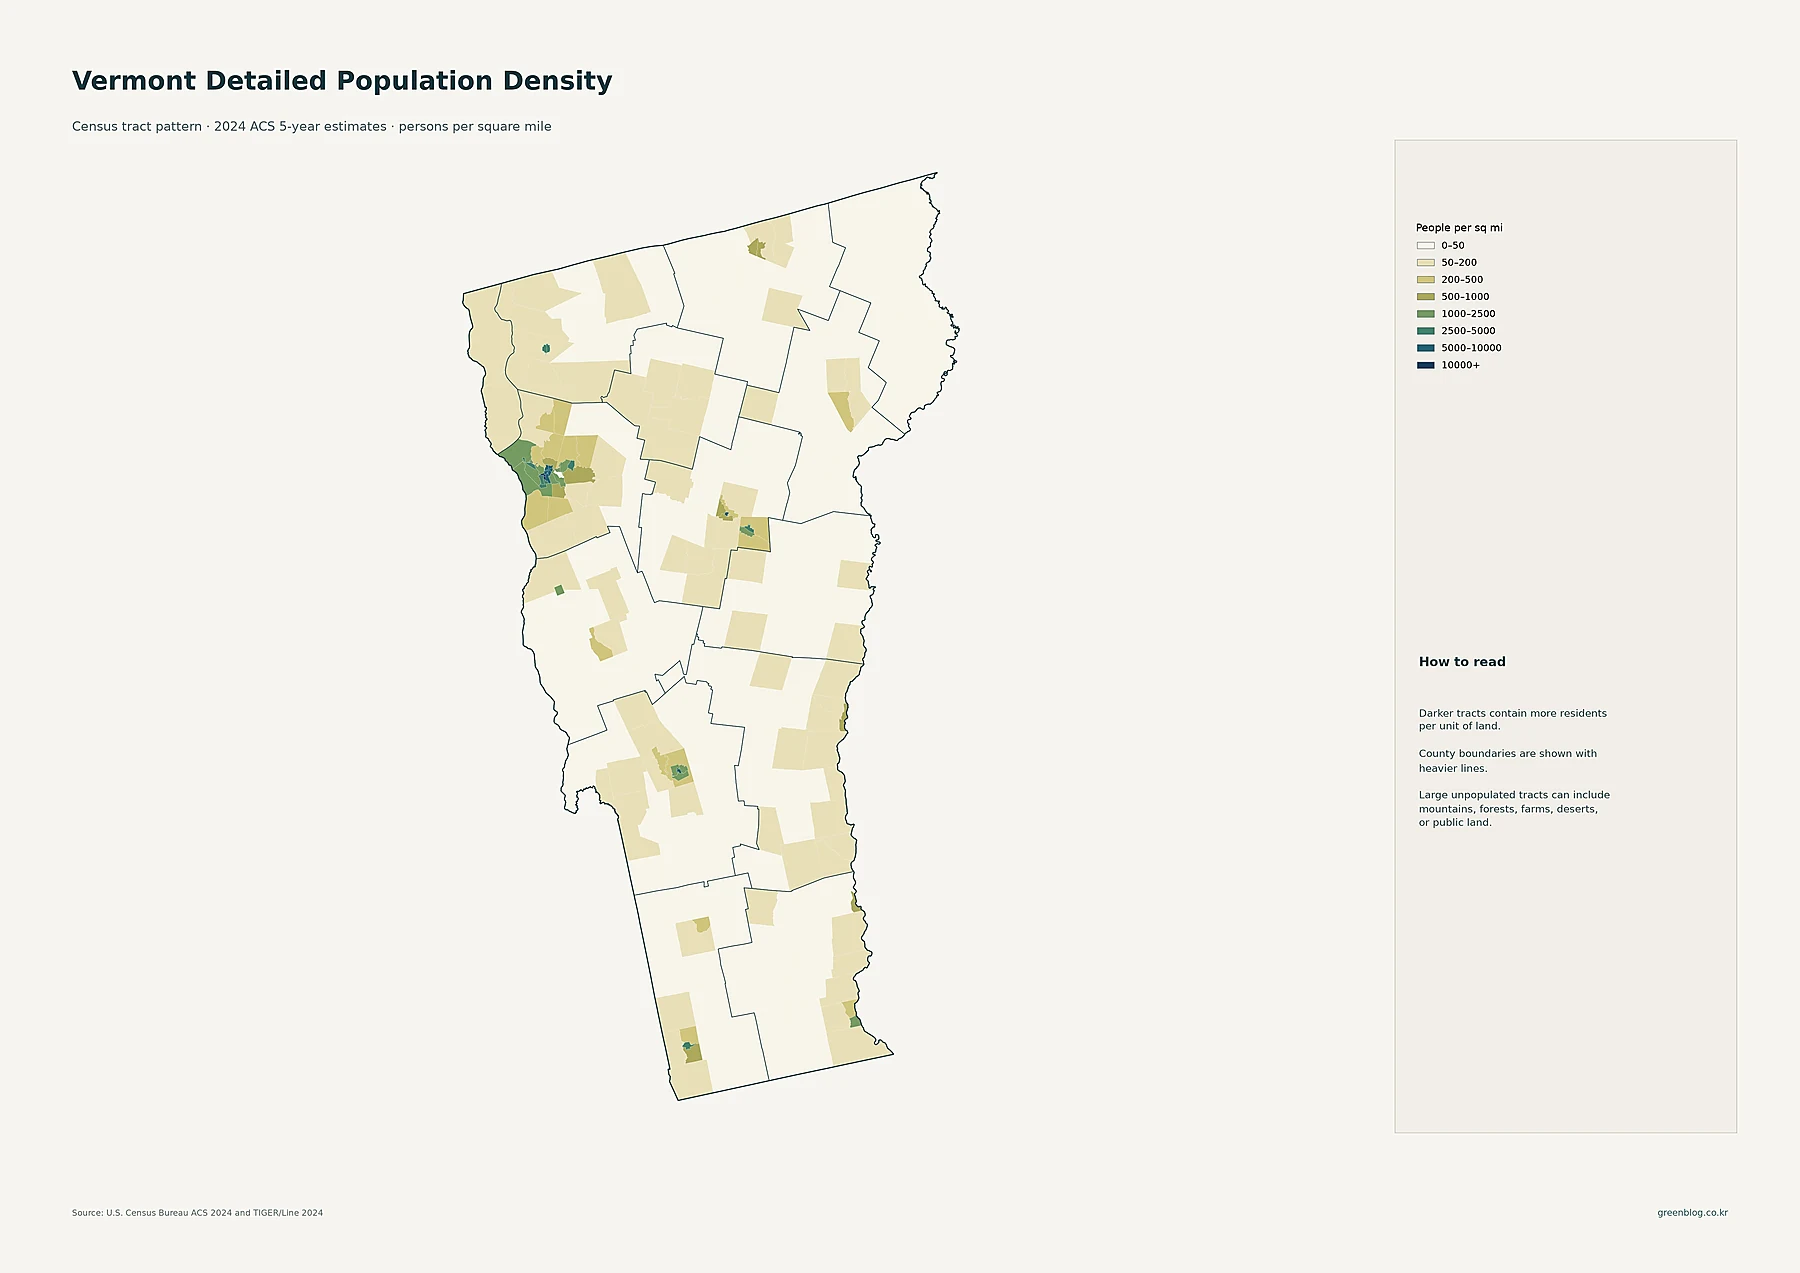
The darkest tracts are concentrated in Chittenden County around Burlington, South Burlington, Winooski, and Essex Junction. Burlington and Winooski contain compact tracts in the higher density classes, while medium- and high-density settlement extends through the surrounding suburban area. No other part of Vermont has a similarly broad collection of connected dense tracts, making the northwest the most obvious urban concentration on the map.
Central Vermont contains a smaller concentration around Montpelier and Barre. These communities are surrounded by much lighter tracts, so their urban footprint stands out despite their modest populations. Farther north, St. Albans and Newport appear as localized centers, while St. Johnsbury is visible in the northeast. Middlebury provides a recognizable focus in west-central Vermont.
Southern Vermont has several separated pockets rather than one continuous urban belt. Rutland forms the largest southern cluster, with Bennington in the southwest and Brattleboro in the southeast. Springfield and smaller Connecticut River communities create additional points of settlement along the eastern side of the state. Between these centers, many tracts fall into the 0–50 or 50–200 people-per-square-mile categories.
The tract layer is important because county averages can hide local differences. A county may include one compact town together with extensive forest or rural land. A low county-average density therefore does not mean every neighborhood or census tract is equally sparse. Vermont’s maps repeatedly show small dense places surrounded by much larger lightly settled areas.
Burlington is Vermont’s largest census place, while several smaller hubs serve different regions
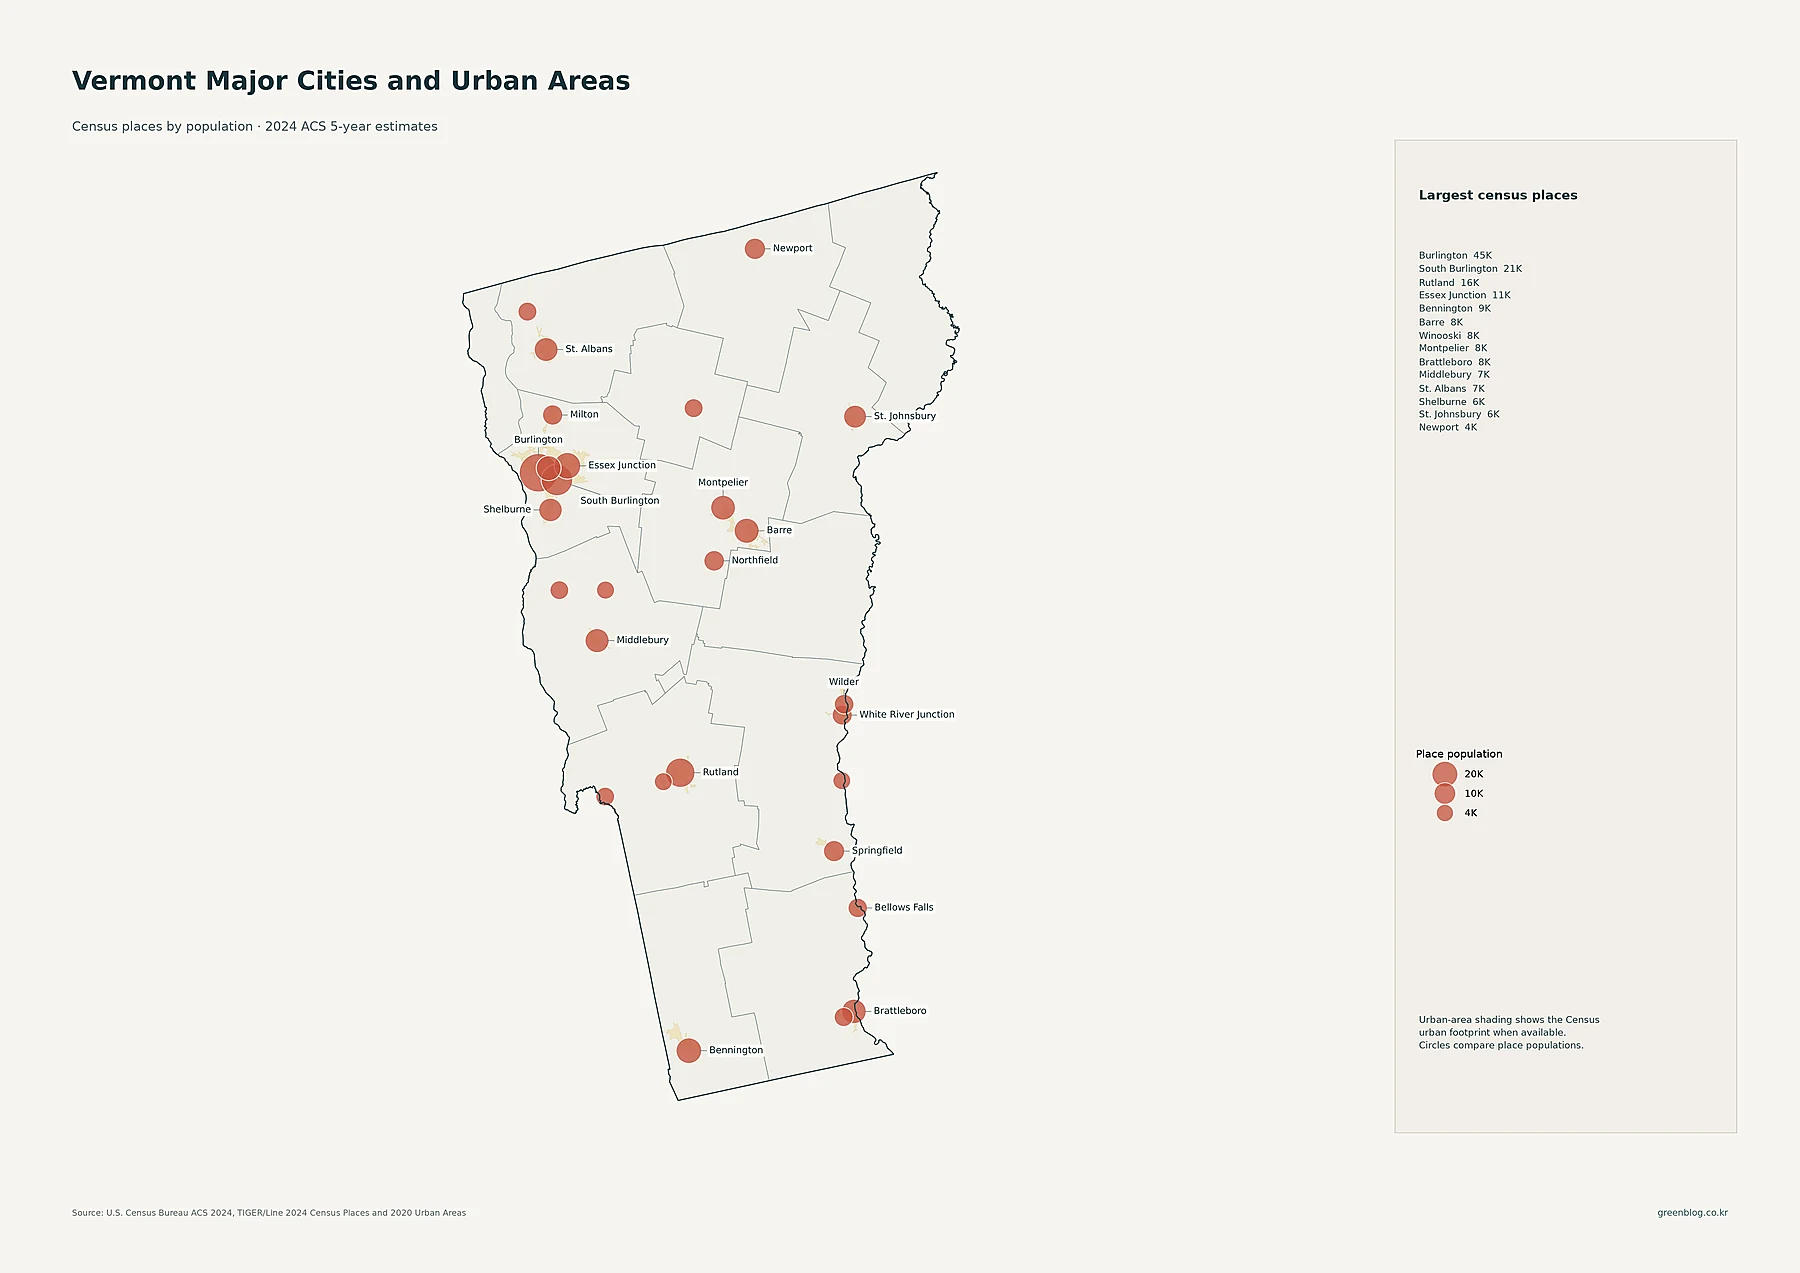
Burlington has 44,675 residents in the supplied census-place data, making it the largest place in Vermont. South Burlington is second at 20,756, followed by Rutland at 15,712 and Essex Junction at 10,803. Bennington has 9,245 residents, Barre 8,412, Winooski 8,293, Montpelier 8,014, Brattleboro 7,657, and Middlebury 7,220.
St. Albans has 6,954 residents, Shelburne 6,499, St. Johnsbury 5,859, Newport 4,394, and Springfield 4,237. Smaller places include Northfield, Milton, White River Junction, Wilder, and Bellows Falls. The arrangement of these circles reinforces the tract pattern: several substantial places cluster close together in Chittenden County, while the rest of Vermont’s population centers are much more widely spaced.
The proportional circles represent total place population, not density. Burlington’s large circle means the census place contains more residents than the other places shown. It does not establish a direct people-per-square-mile ranking. Density should be read from the tract or county-density layers, where land area is part of the comparison.
Chittenden County has nearly three times the population of the next-largest counties
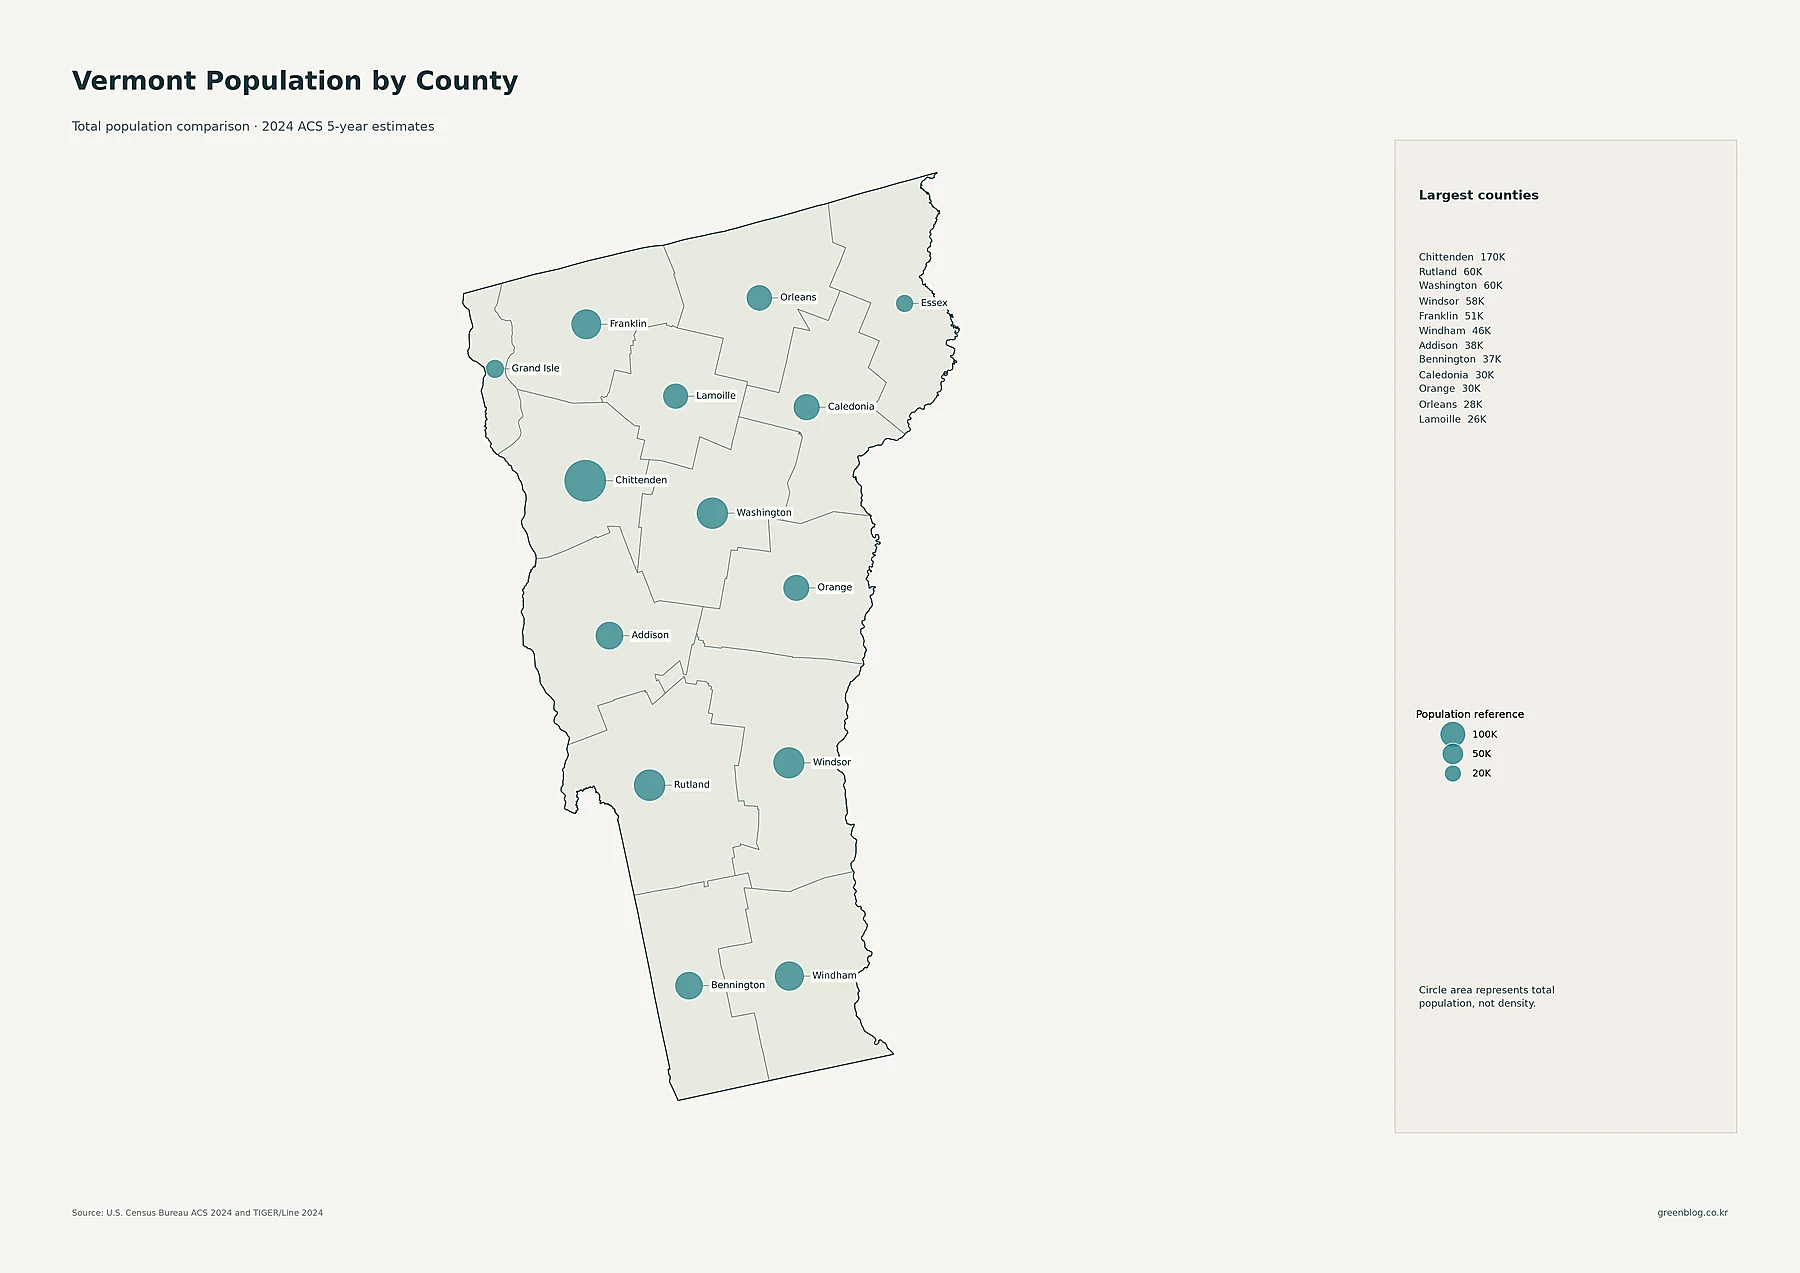
Chittenden County has 169,758 residents, by far the largest county total in the supplied 2024 ACS data. Rutland County is second with 60,425, followed closely by Washington County at 60,017 and Windsor County at 57,990. Franklin County has 50,638 residents and Windham County 45,923. Addison has 37,664 and Bennington 37,269.
Caledonia County has 30,475 residents, Orange 29,761, Orleans 27,606, and Lamoille 26,148. Grand Isle has 7,450 residents and Essex only 5,982. The unusually large Chittenden circle is consistent with the concentration of Burlington, South Burlington, Winooski, Essex Junction, Shelburne, and other communities in the same county.
Total population is not the same as density. Grand Isle is a useful example: it has the second-smallest county population, yet its small land area gives it the second-highest county-average density. Windsor and Windham contain many more residents than Grand Isle but are spread over much larger areas. The proportional-circle map therefore answers how many people live in each county, not how tightly they are packed.
Chittenden is the densest county, while Grand Isle ranks second despite its small population
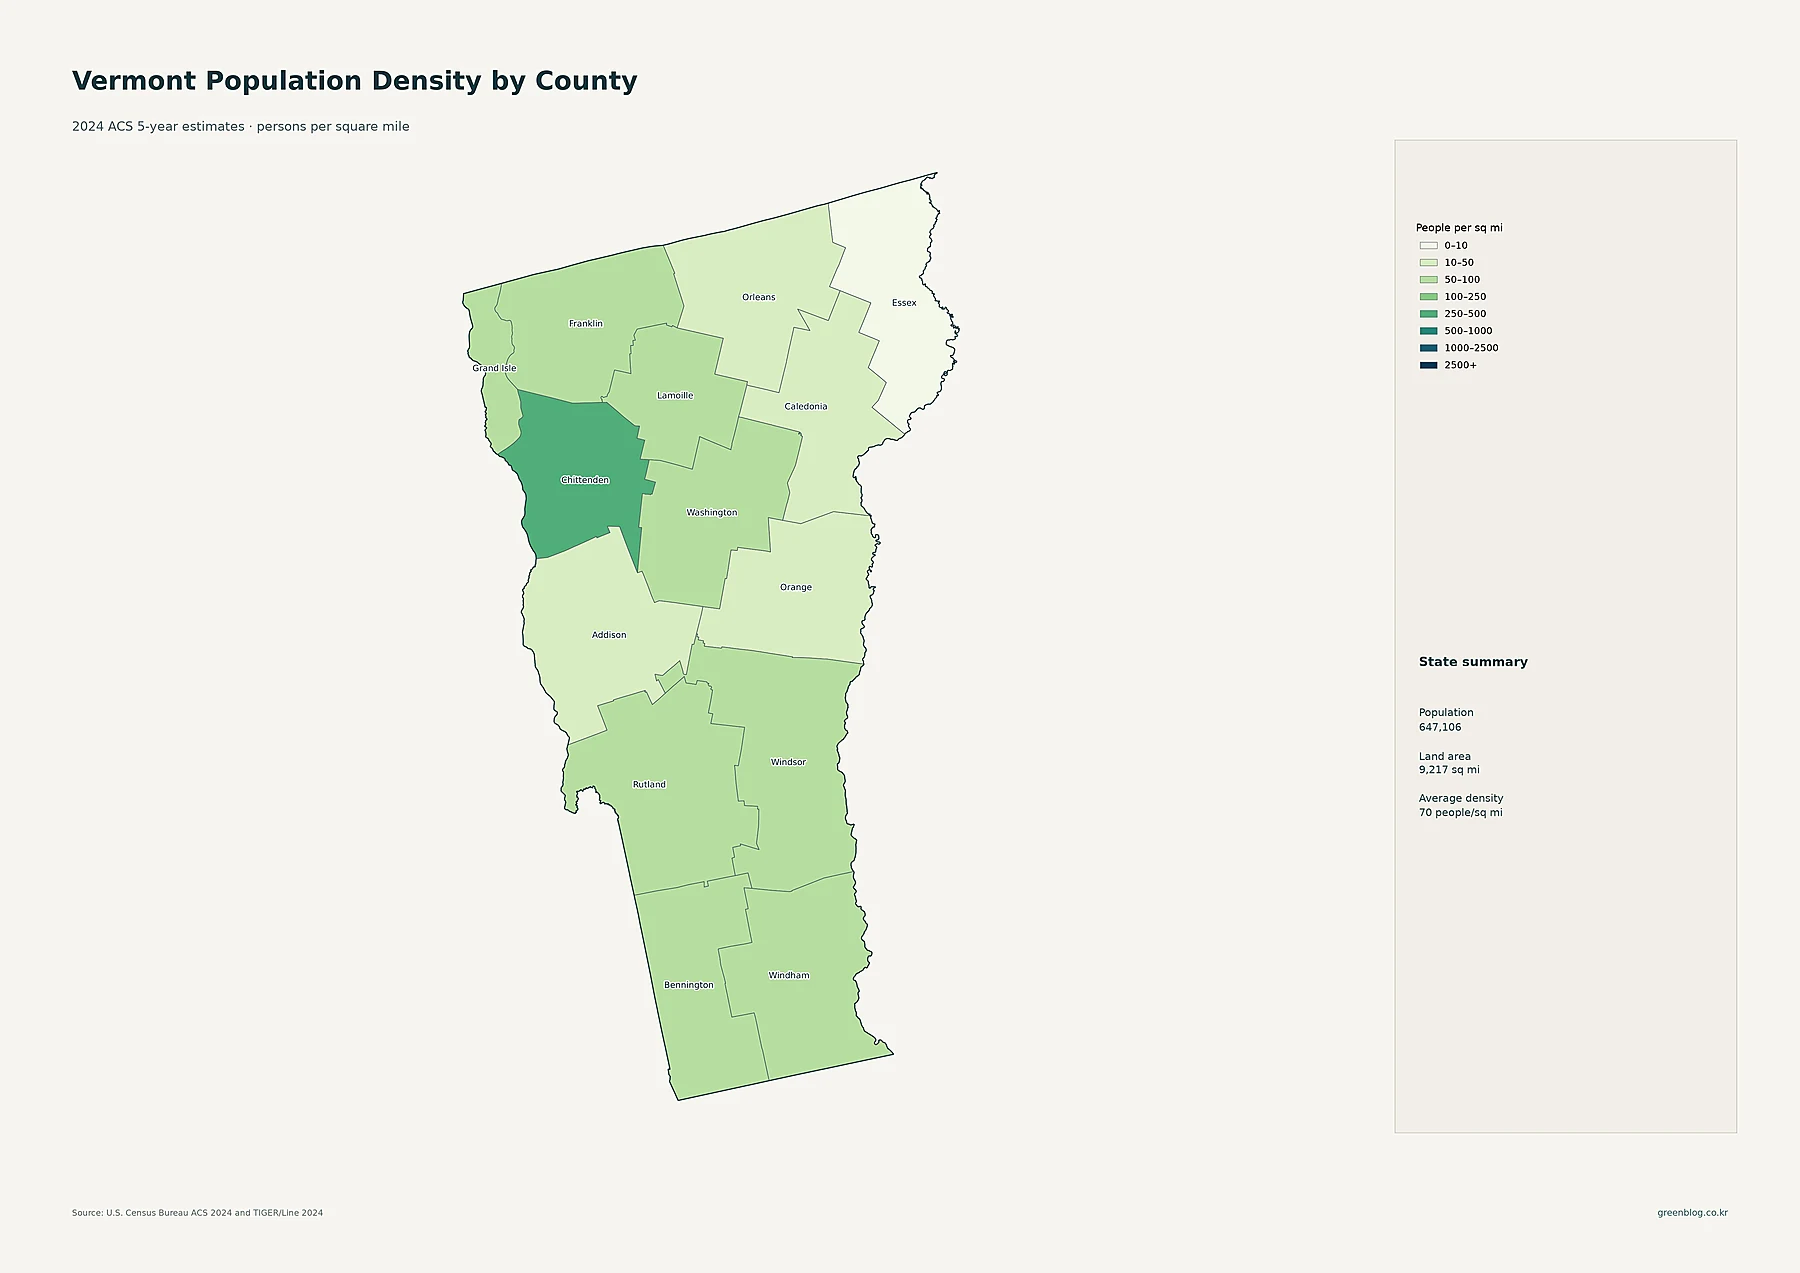
Chittenden County has the highest county-average density at about 316.2 people per square mile. Grand Isle is a distant but notable second at about 91.1. Washington County averages about 87.4, Franklin 80.3, Rutland 64.9, Windsor 59.8, Windham 58.4, Lamoille 56.7, and Bennington 55.3 people per square mile.
Addison County averages about 49.1 people per square mile, Caledonia 46.9, Orange 43.3, and Orleans 39.7. Essex County is by far the sparsest at about 9.0 people per square mile. Chittenden’s county average is roughly thirty-five times Essex’s, which shows how strongly Burlington’s metropolitan concentration differs from the northeastern corner of the state.
Grand Isle’s position is particularly instructive. Its population total is only 7,450, yet it ranks second in density because the county’s land area is small. A county does not need a large absolute population to have a relatively high density. That distinction is why the total-population and density maps should be read as complementary rather than interchangeable.
| Measure | Leading area | Value in supplied data |
|---|---|---|
| State population | Vermont | 647,106 |
| Largest place population | Burlington | 44,675 |
| Largest county population | Chittenden County | 169,758 |
| Highest county density | Chittenden County | about 316.2/sq mi |
| Fastest 2010–2020 growth | Chittenden County | +7.5% |
| Largest 2010–2020 decline | Essex County | -6.1% |
Chittenden and Lamoille grew fastest during the 2010s, while Essex declined most
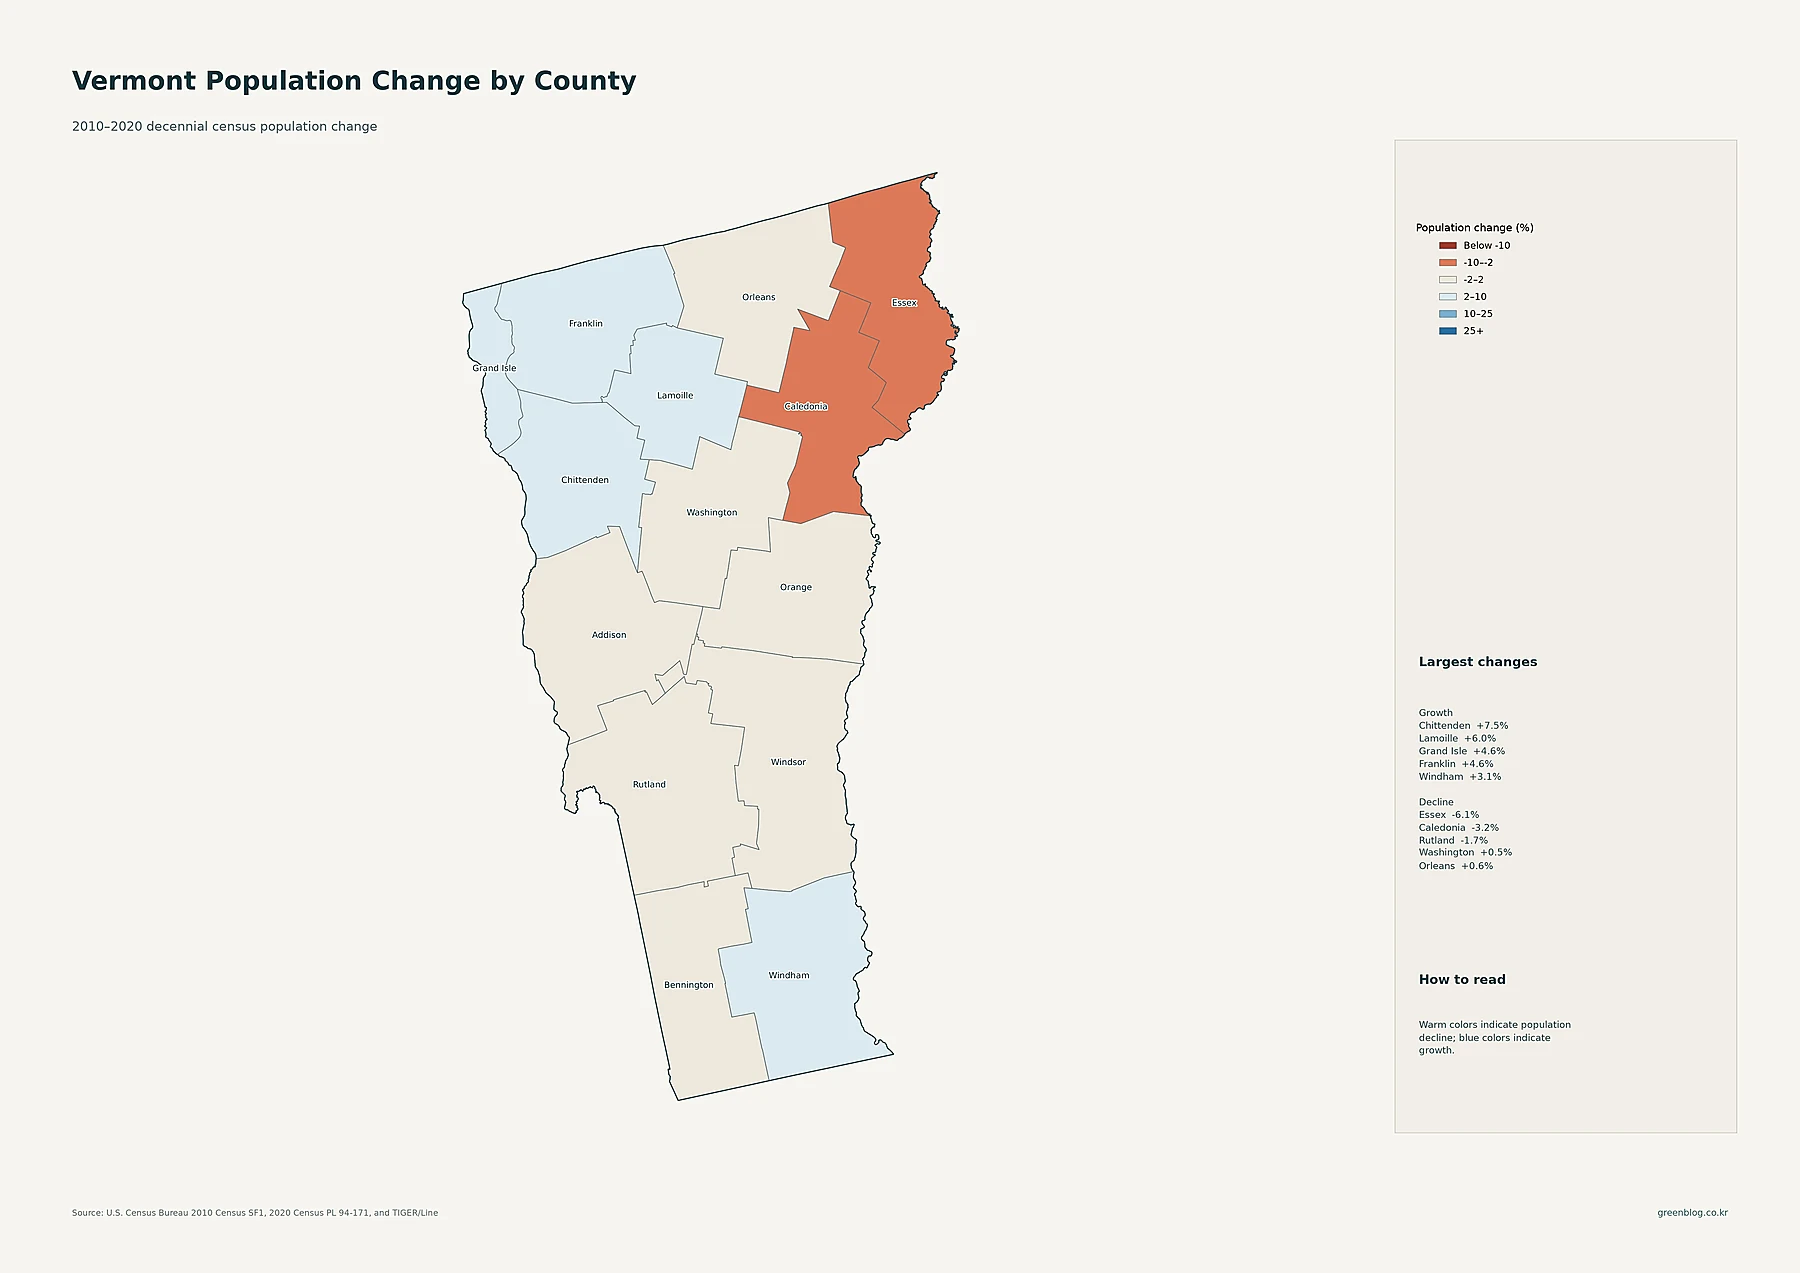
Chittenden County recorded the fastest percentage increase in the supplied decade data. Its population rose from 156,545 in 2010 to 168,323 in 2020, a gain of about 7.5%. Lamoille County increased from 24,475 to 25,945, or about 6.0%. Grand Isle grew 4.6% and Franklin also about 4.6%, while Windham increased 3.1%.
Windsor County grew about 1.9%, Addison 1.5%, and Orange 1.2%. Bennington and Orleans each increased by roughly 0.6%, and Washington County was nearly flat at about +0.5%. The map therefore shows a modest-growth pattern across much of the state rather than uniformly rapid expansion. The strongest blue shades appear in the northwest and Lamoille area.
Three counties declined. Essex County fell from 6,306 residents in 2010 to 5,920 in 2020, a decrease of about 6.1%. Caledonia declined 3.2% and Rutland 1.7%. The neighboring northeastern counties of Essex and Caledonia stand out in warm colors, while Orleans next door recorded a small gain. The pattern shows that even adjacent rural counties did not necessarily move in the same direction.
These percentages belong specifically to the 2010–2020 decennial-census period. They should not be described as changes in the 2024 ACS estimate. The 2024 layers show current estimated population and density, while the historical map shows how county populations changed during the previous census decade.
Vermont’s population pattern is a strong northwest core surrounded by smaller, separated regional centers
The full map set makes Chittenden County the clearest current center of Vermont’s population geography. Burlington is the largest census place, and Chittenden leads county population, county-average density, and 2010–2020 growth. South Burlington, Winooski, Essex Junction, and Shelburne reinforce the northwestern cluster, which is also the broadest concentration of dense census tracts.
Elsewhere, Vermont is organized around a network of smaller hubs rather than another large metropolitan system. Montpelier and Barre anchor central Vermont. Rutland and Bennington serve the southwest and south-central parts of the state, while Brattleboro and Springfield stand out along the southeast. St. Albans, Newport, and St. Johnsbury provide northern and northeastern centers. Grand Isle shows how a small county can still rank high in density, while Essex combines the state’s lowest county density with the largest 2010–2020 percentage decline.
That combination makes Vermont more than a simple low-density rural state. The most accurate reading keeps five measures separate: place population, county population, county-average density, tract-level density, and historical population change. Together they show where Vermonters live now, how sharply Burlington differs from the rest of the state, and which counties gained or lost residents during the 2010s.
Download the Vermont population map collection
The ZIP includes detailed census-tract density, major cities and urban areas, county population totals, 2010–2020 county population change, and county population density.
FAQ
Which Vermont county has the largest population?
Chittenden County is the largest in the supplied 2024 ACS 5-year estimates, with 169,758 residents. Rutland County has 60,425 and Washington County 60,017.
Which Vermont county has the highest population density?
Chittenden County has the highest county-average density at about 316.2 people per square mile. Grand Isle is about 91.1 and Washington County about 87.4 people per square mile.
Which Vermont county grew fastest from 2010 to 2020?
Chittenden County grew about 7.5%, followed by Lamoille at 6.0%. Grand Isle and Franklin each grew about 4.6%. These percentages compare the 2010 and 2020 decennial censuses.
Related Maps
Sources
- U.S. Census Bureau — American Community Survey (ACS): 2024 5-year population and density estimates
- U.S. Census Bureau — TIGER/Line Shapefiles: 2024 state, county, census tract, and census place boundaries
- U.S. Census Bureau — Decennial Census: 2010 and 2020 county population comparison
Green Map creates custom-edited map images using open geographic data sources such as geoBoundaries, Natural Earth, OpenStreetMap, and government open data. These maps are edited visual materials, not raw data files, and are provided for education, documents, presentations, and graphic reference.