Shrubland is the defining cover on the supplied 2025 Blaine County map, accounting for 52.17% of the county. Grassland adds another 22.92%, while forest covers 12.48%, barren ground 5.05%, and agriculture 3.99%. The most striking contrast is not simply between those percentages. A narrow developed concentration follows the western Wood River side of the county while broad shrub and grass country occupies much of the center, east, and long southern extension. This Blaine County Idaho Land Cover Map is organized around that contrast.
Four map views are provided: 2025 land cover, forest and farmland, impervious surface with developed land, and a 1985–2025 class-difference comparison. The WebP versions appear with the discussion, and the four original 2480 × 1754-pixel JPG files are available together in one ZIP below. Looking at the same location across the set makes the Wood River settlements, agricultural pockets, high-country forest, and broad open vegetation much easier to separate.
Table of Contents
A county dominated by shrub and grass still contains sharply different landscapes
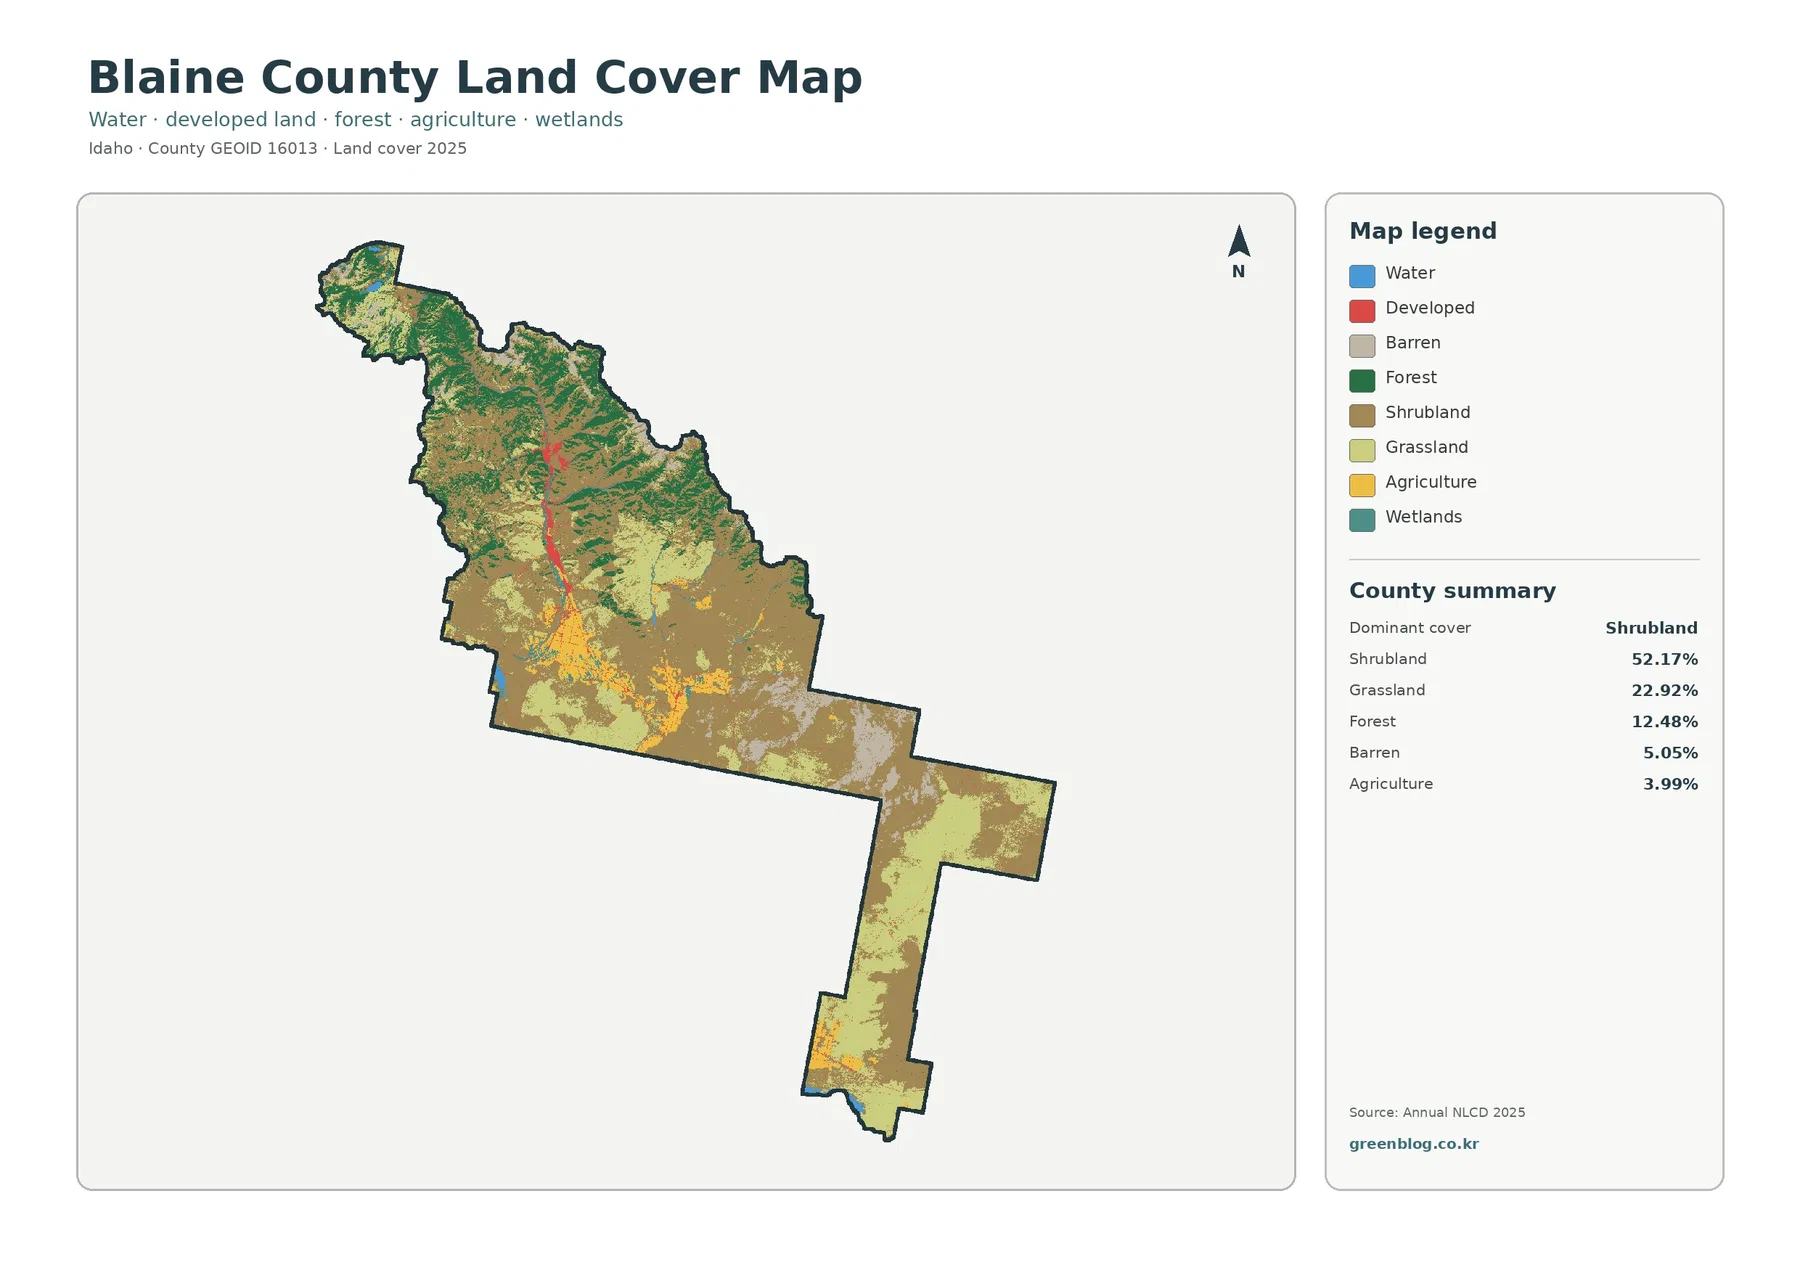
Brown shrubland covers more than half of the supplied summary and is especially extensive across central, eastern, and southern parts of Blaine County. Light green grassland forms another large share and fills many open areas between shrub-covered slopes and forested uplands. Together, shrubland and grassland account for roughly three quarters of the mapped surface. That countywide dominance explains why most of the southern extension remains visually open even though the northern half contains substantial dark-green forest.
The Wood River settlement corridor appears as a narrow red line inside a very large county
Blaine County’s official transportation plan places Sun Valley, Ketchum, Hailey, and Bellevue in the western part of the county along State Highway 75 in the Big Wood River Valley. The land-cover image does not draw municipal boundaries or highway labels, but its strongest developed concentration follows the same general north–south valley direction. A compact red center in the north-central area continues southward as a narrow developed trace before branching into smaller concentrations farther down the valley.
Small agricultural shares become conspicuous along valley bottoms and southern open ground
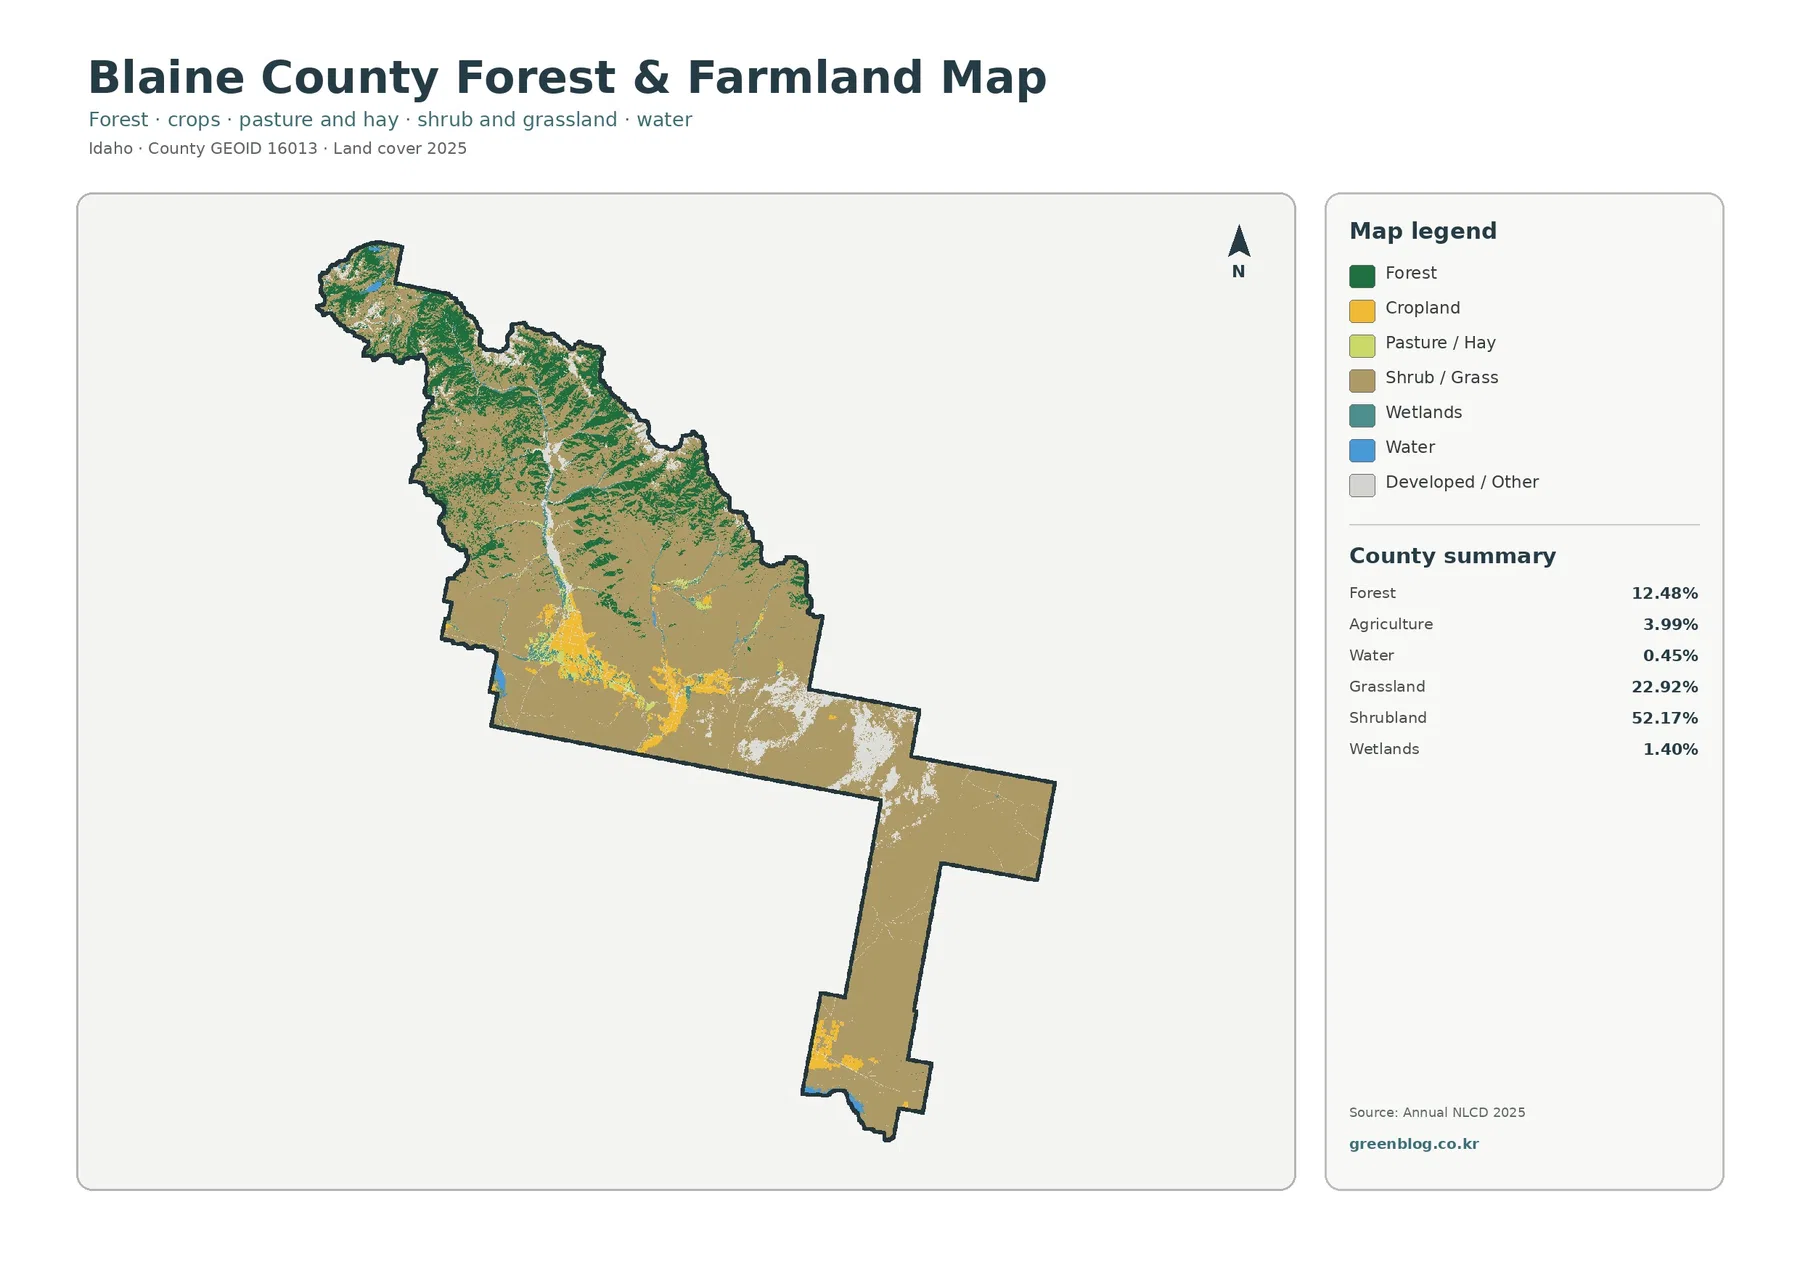
The forest-and-farmland view removes several smaller classes and makes the vegetation contrast easier to trace. Forest remains most continuous in the northern and northeastern high country. Agriculture, by contrast, forms narrow yellow areas in the south-central valley system, with additional patches near the southwest and at the southern end. The rest of the county is largely shrub and grass, which keeps the cultivated footprint from being mistaken for all open-looking land.
Agriculture accounts for 3.99% of the 2025 summary. The number is modest, but the yellow fields form recognizable pockets because they are concentrated rather than evenly scattered. Blaine County’s official agriculture chapter describes a long history of irrigation in the Big Wood and Little Wood basins. That source provides context for why cultivated land appears in selected valleys and flatter areas within an otherwise dry, open landscape.
Impervious cover is only 0.38% on average, but its concentration is unmistakable
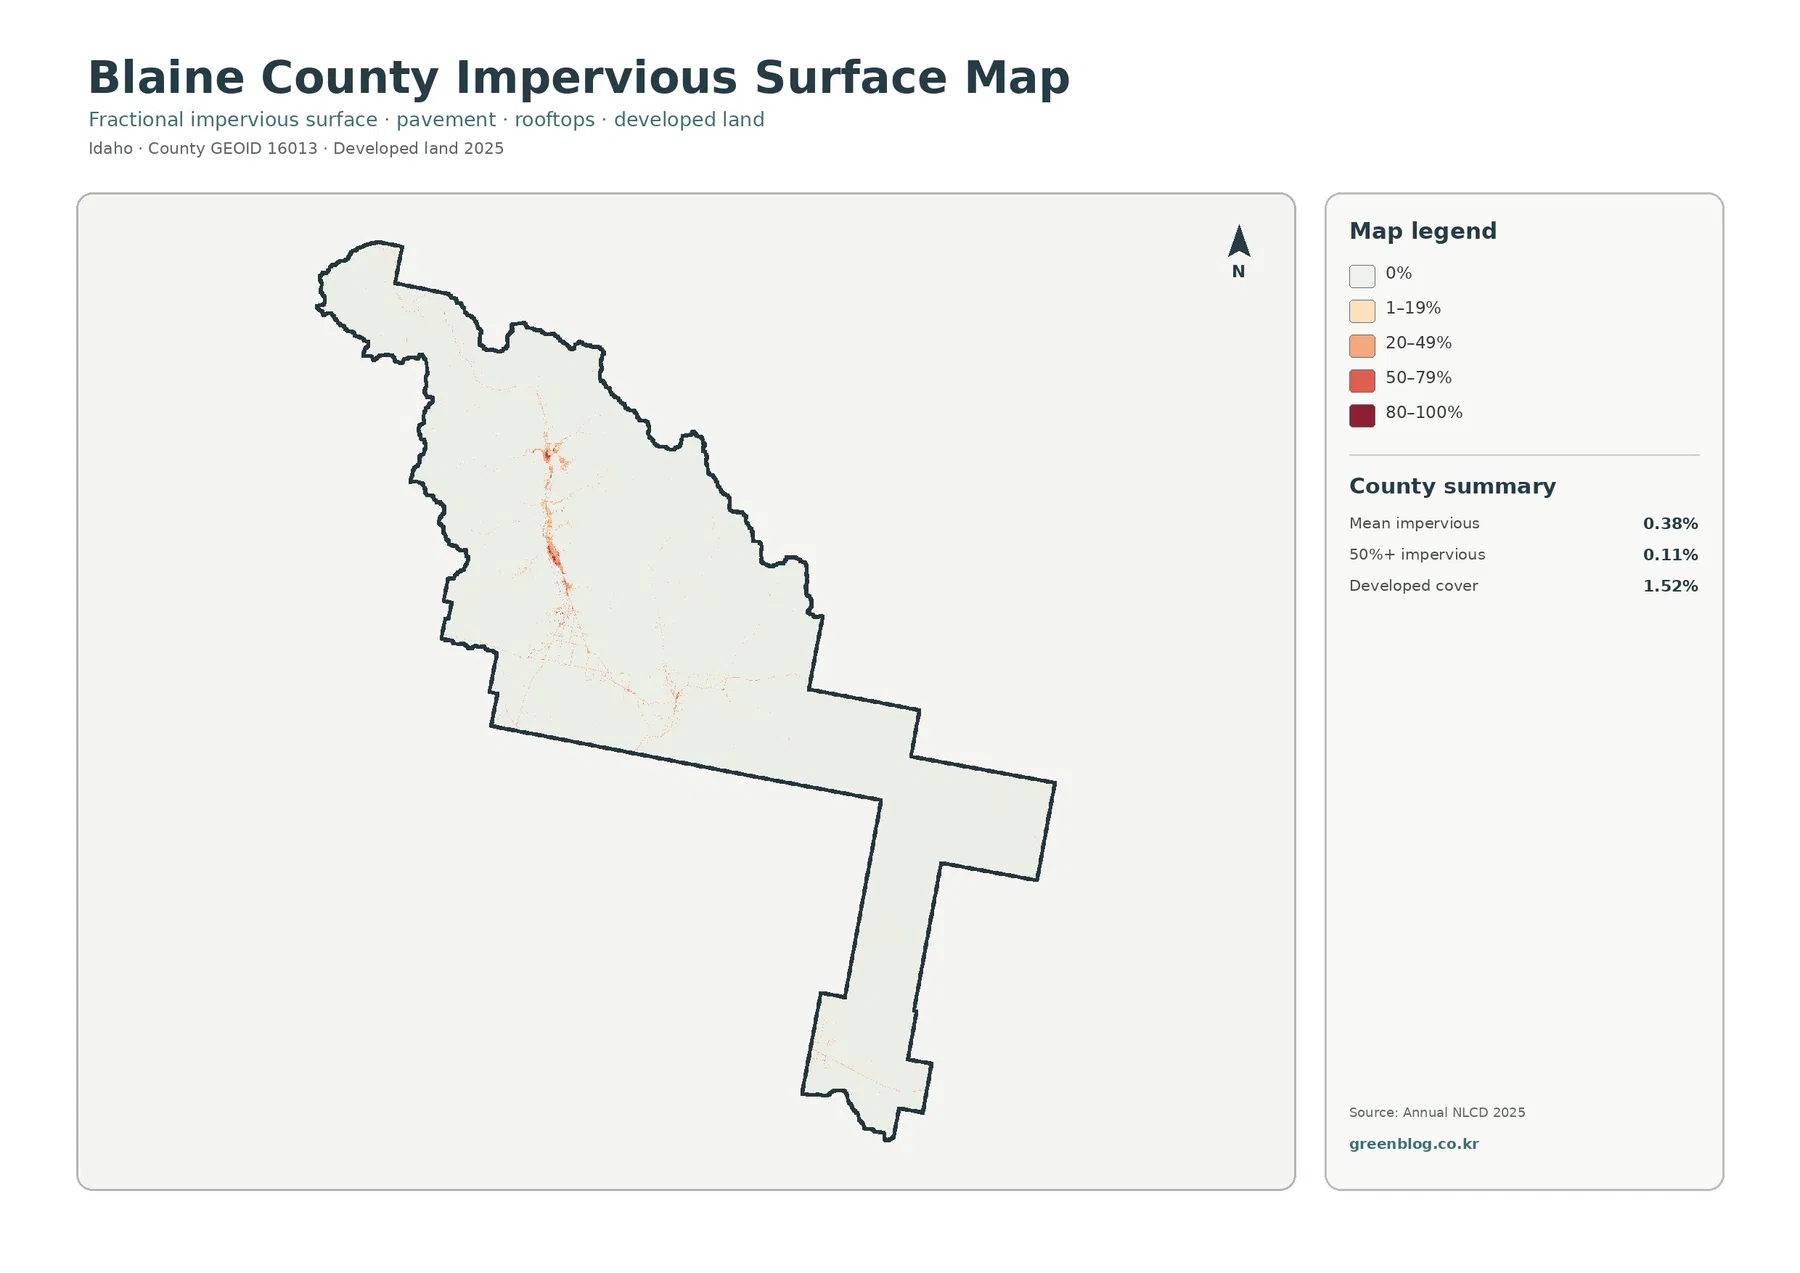
Impervious surface means hard cover such as rooftops, pavement, and parking areas where water does not readily soak into the ground. Blaine County’s mean impervious value is 0.38%, and only 0.11% of the county falls in cells with at least 50% impervious cover. Those very low averages reflect the enormous extent of open and forested land. They do not mean that every part of the county has almost no hard surface.
The strongest orange and red values form a narrow north–south concentration in the north-central portion of the county. That cluster aligns broadly with the Wood River communities identified by the county transportation plan. Smaller traces extend south and branch through the lower valley. The long eastern and southern parts of Blaine County remain almost entirely pale on this layer, which emphasizes how localized the hard-surface footprint is.
Developed cover is listed at 1.52%, much higher than the 0.38% mean impervious value. These measures are not contradictory. A developed land-cover class can include lawns, trees, soil, and other permeable surfaces around buildings and roads. The impervious layer isolates the hard fraction within those developed areas. In the Wood River corridor, the two measures overlap spatially, but they answer different questions.
Most 1985–2025 differences are not classified as new development
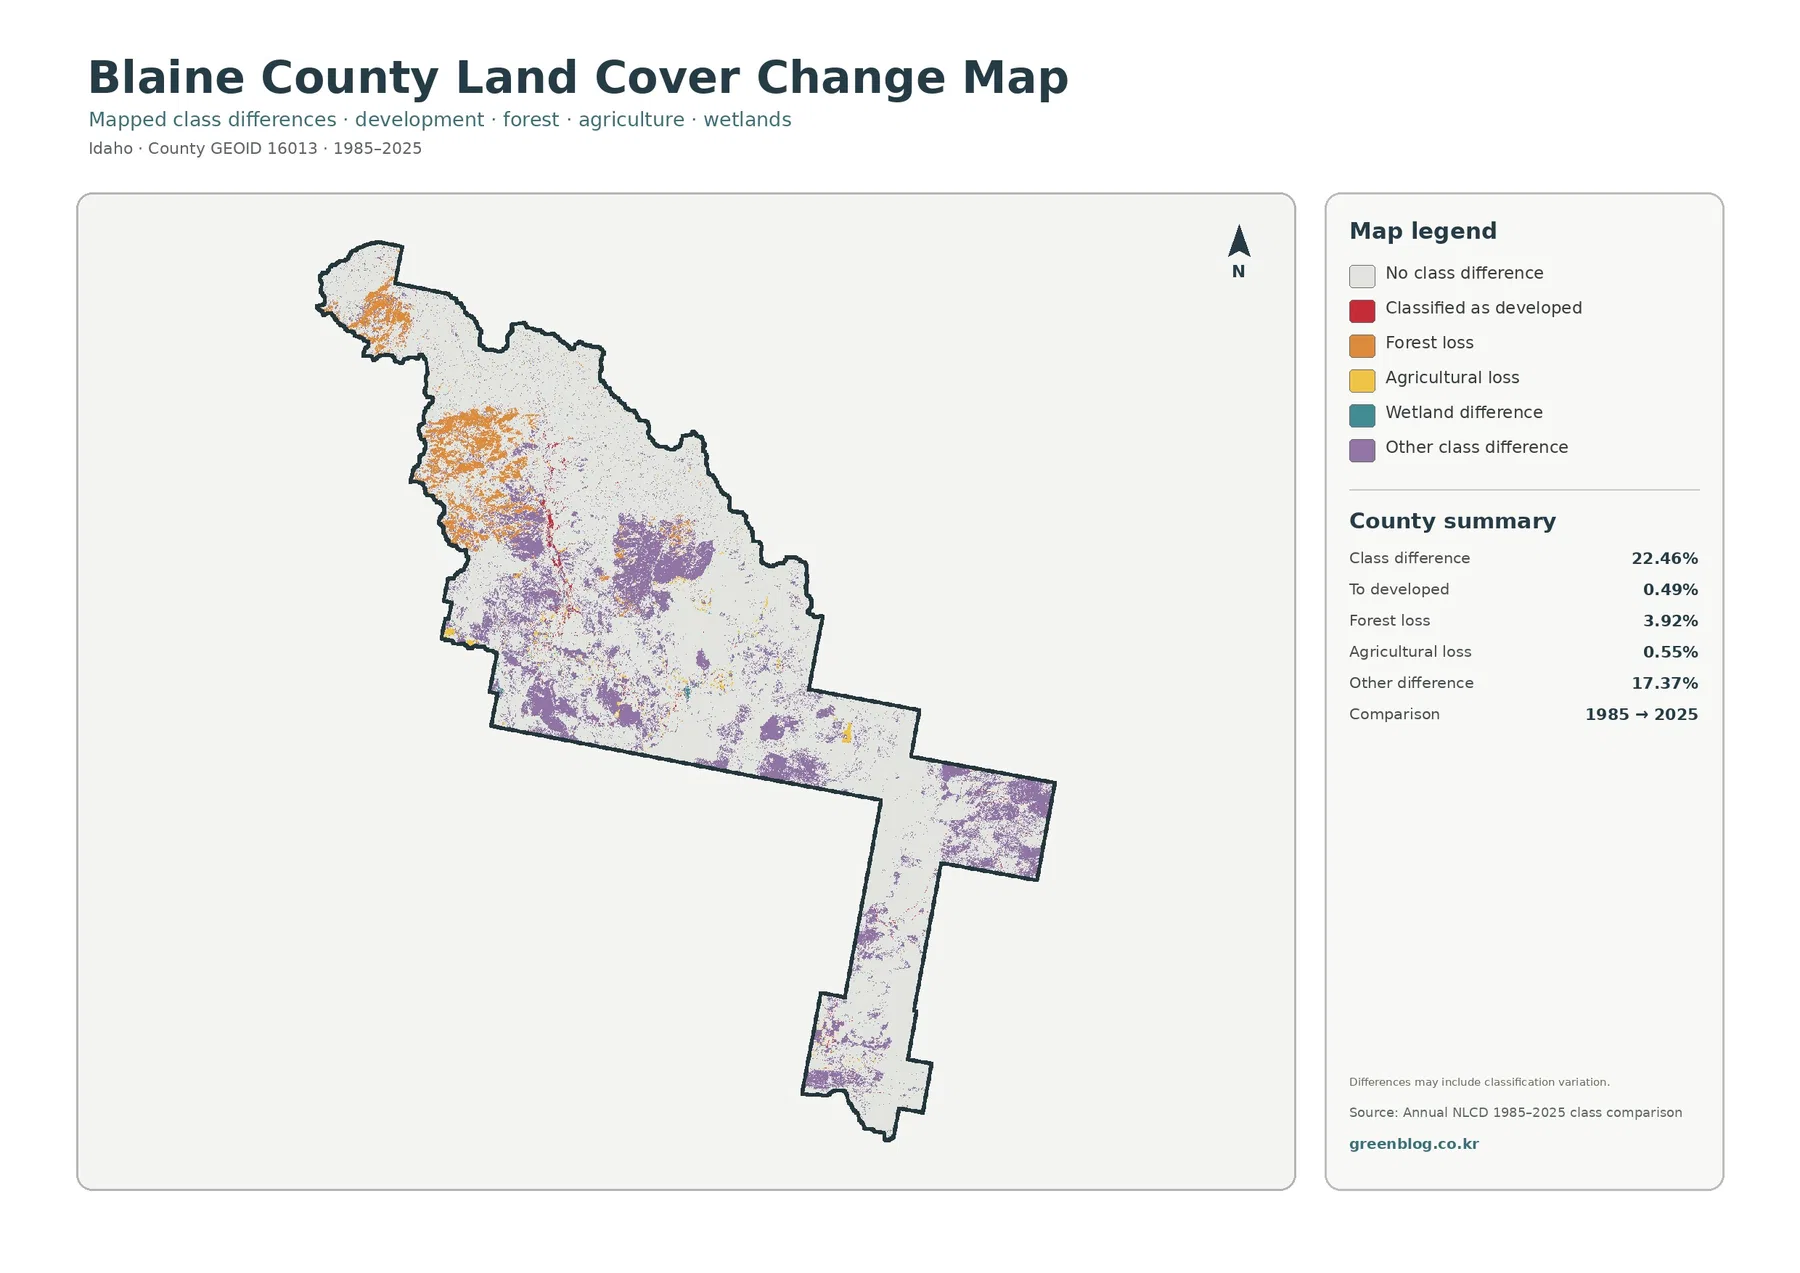
The supplied 1985–2025 comparison marks 22.46% of the county as having a different class at the two endpoints. Only 0.49% is listed as classified to developed. Forest loss is 3.92%, agricultural loss 0.55%, and other class difference 17.37%. The total therefore should not be described as a 22.46% development increase. Most of the mapped difference belongs to transitions or classification variation among non-developed classes.
Forest loss on this layer has a specific meaning: a cell was classified as forest at one endpoint and as another class at the other. The image does not determine whether the cause was wildfire, timber activity, vegetation succession, long-term climate effects, or classification variation. Establishing a cause requires intermediate imagery and other records. The same caution applies to agricultural loss, which does not automatically mean that farmland was converted to buildings.
Big Wood, Little Wood, and Silver Creek add context to the narrow water and wetland classes
Blaine County’s official land, water, and habitat material identifies the Big Wood River, Little Wood River, and Silver Creek as major parts of the county’s water system. The county is within the Snake River watershed, and local conservation programs emphasize river corridors, wetlands, water quality, wildlife habitat, and working farms and ranches. Those official descriptions are helpful when reading the thin water and wetland features on the land-cover maps.
Match the map to the Blaine County question instead of shrinking all four into one graphic
For a presentation, two large maps usually communicate Blaine County better than four small thumbnails. A Wood River growth discussion can pair current cover with impervious surface. A vegetation discussion can pair the forest-and-farmland image with the endpoint comparison. Keeping the legends readable is especially important because brown shrubland, light grassland, pale barren ground, and white low-impervious areas serve very different purposes across the four images.
Thirty-meter cells and the 2025 observation date set the scale of interpretation
Annual NLCD is a raster product, meaning the landscape is divided into small square cells. At the commonly used 30-meter cell size, a single cell receives a predominant class even when trees, grass, a road, a building, and bare soil share the same area. That generalization matters in Blaine County’s narrow valleys, where developed traces, streams, and irrigated fields may be much narrower than the surrounding uplands.
Zooming the JPG makes symbols larger but cannot recover parcel-level detail that was never present in the source cells. A narrow river can appear simplified, a field edge can look blocky, and small developed features can merge with nearby surfaces. Property boundaries, zoning, legal access, wetland jurisdiction, building permits, and current road conditions must be checked in newer and more specialized county or agency records.
The current maps are labeled with the supplied 2025 observation year. Construction, wildfire, vegetation recovery, agricultural change, flooding, or other events after that date may not appear. The change layer compares only the 1985 and 2025 endpoints and does not describe every intermediate year. A location could change several times between those dates and still end in a class similar to its starting point.
Four original JPG maps in the Blaine County download
The ZIP combines the original JPGs for 2025 land cover, forest and farmland, impervious surface and developed land, and 1985–2025 land-cover change. Keeping the files together makes it straightforward to compare the same Wood River location, agricultural pocket, forest block, or shrub-covered upland across several layers without relying on a reduced composite image.
Frequently Asked Questions
What is the largest land-cover class in Blaine County?
Shrubland is the largest 2025 class at 52.17%, followed by grassland at 22.92% and forest at 12.48%. Shrub and grass cover dominate much of the center, east, and south, while forest is more concentrated in the northern and northeastern high country.
Why does the Wood River corridor stand out when developed cover is only 1.52%?
Development is concentrated rather than evenly distributed. Blaine County’s official transportation plan places Sun Valley, Ketchum, Hailey, and Bellevue along State Highway 75 in the Big Wood River Valley, and the developed and impervious layers show their strongest concentration in the same general corridor.
Does the 22.46% class difference mean that 22.46% of Blaine County became developed?
No. Only 0.49% is listed as classified to developed. The total also includes 3.92% forest loss, 0.55% agricultural loss, and 17.37% other class difference, so it represents several kinds of endpoint classification change rather than urban growth alone.
Sources and Reference Data
- MRLC Annual NLCD Data – official access point for Annual NLCD land-cover and comparison products
- USGS Annual NLCD Land Cover Classification – definitions for shrubland, grassland, forest, developed land, agriculture, wetlands, and other classes
- Blaine County Land Use & Transportation – official county planning context for land use, growth, and the Wood River transportation corridor
- Blaine County Land, Water and Habitat Conservation – official information on the Big and Little Wood river valleys, wildlife habitat, water quality, and working farms and ranches
Map File Information
The ZIP contains four original JPG maps for comparing Blaine County's broad shrub-and-grass cover, northern forest, valley agriculture, Wood River hard surfaces, and 1985–2025 endpoint differences.
- Included Files: Use only the versions confirmed in the article and supplied images
- File Type: Use the confirmed download contents
- Intended Use: Printing, education, presentations, and map-based projects
Related Maps
Green Map creates custom-edited map images using open geographic data sources such as geoBoundaries, Natural Earth, OpenStreetMap, and government open data.
These maps are edited visual materials, not raw data files, and are provided for education, documents, presentations, and graphic reference.