Wyoming’s statewide average makes it look uniformly empty, but the detailed maps show a more useful pattern: small, distinct population centers separated by enormous low-density areas. The supplied 2024 ACS 5-year estimates total 582,397 residents. The county-density map lists 97,089 square miles of land, which works out to an average of about 6 people per square mile. Even the state’s densest county remains below 40 people per square mile, while several counties fall near or below 2.
The five maps answer different questions. Census-tract density shows where settlement is concentrated inside broad county boundaries. The major-cities map sizes Census places by population. The county population map compares total residents, whereas the county density map adjusts those totals for land area. The 2010–2020 change map switches to decennial census counts and shows growth or decline over a decade. Keeping those measures separate is especially important in Wyoming because a county can cover a huge area, contain a recognizable town, and still have a very low countywide density.
Table of Contents
The tract map turns Wyoming’s cities into isolated pockets of density
The most detailed map uses 2024 ACS 5-year estimates at the census-tract level. Its legend begins at 0–50 people per square mile and steps through 50–200, 200–500, 500–1,000, 1,000–2,500, 2,500–5,000, 5,000–10,000, and 10,000 or more. Darker colors mean more residents per unit of land, while heavier outlines mark county boundaries. The map also notes that very large unpopulated tracts can include mountains, forests, farms, deserts, or public lands.
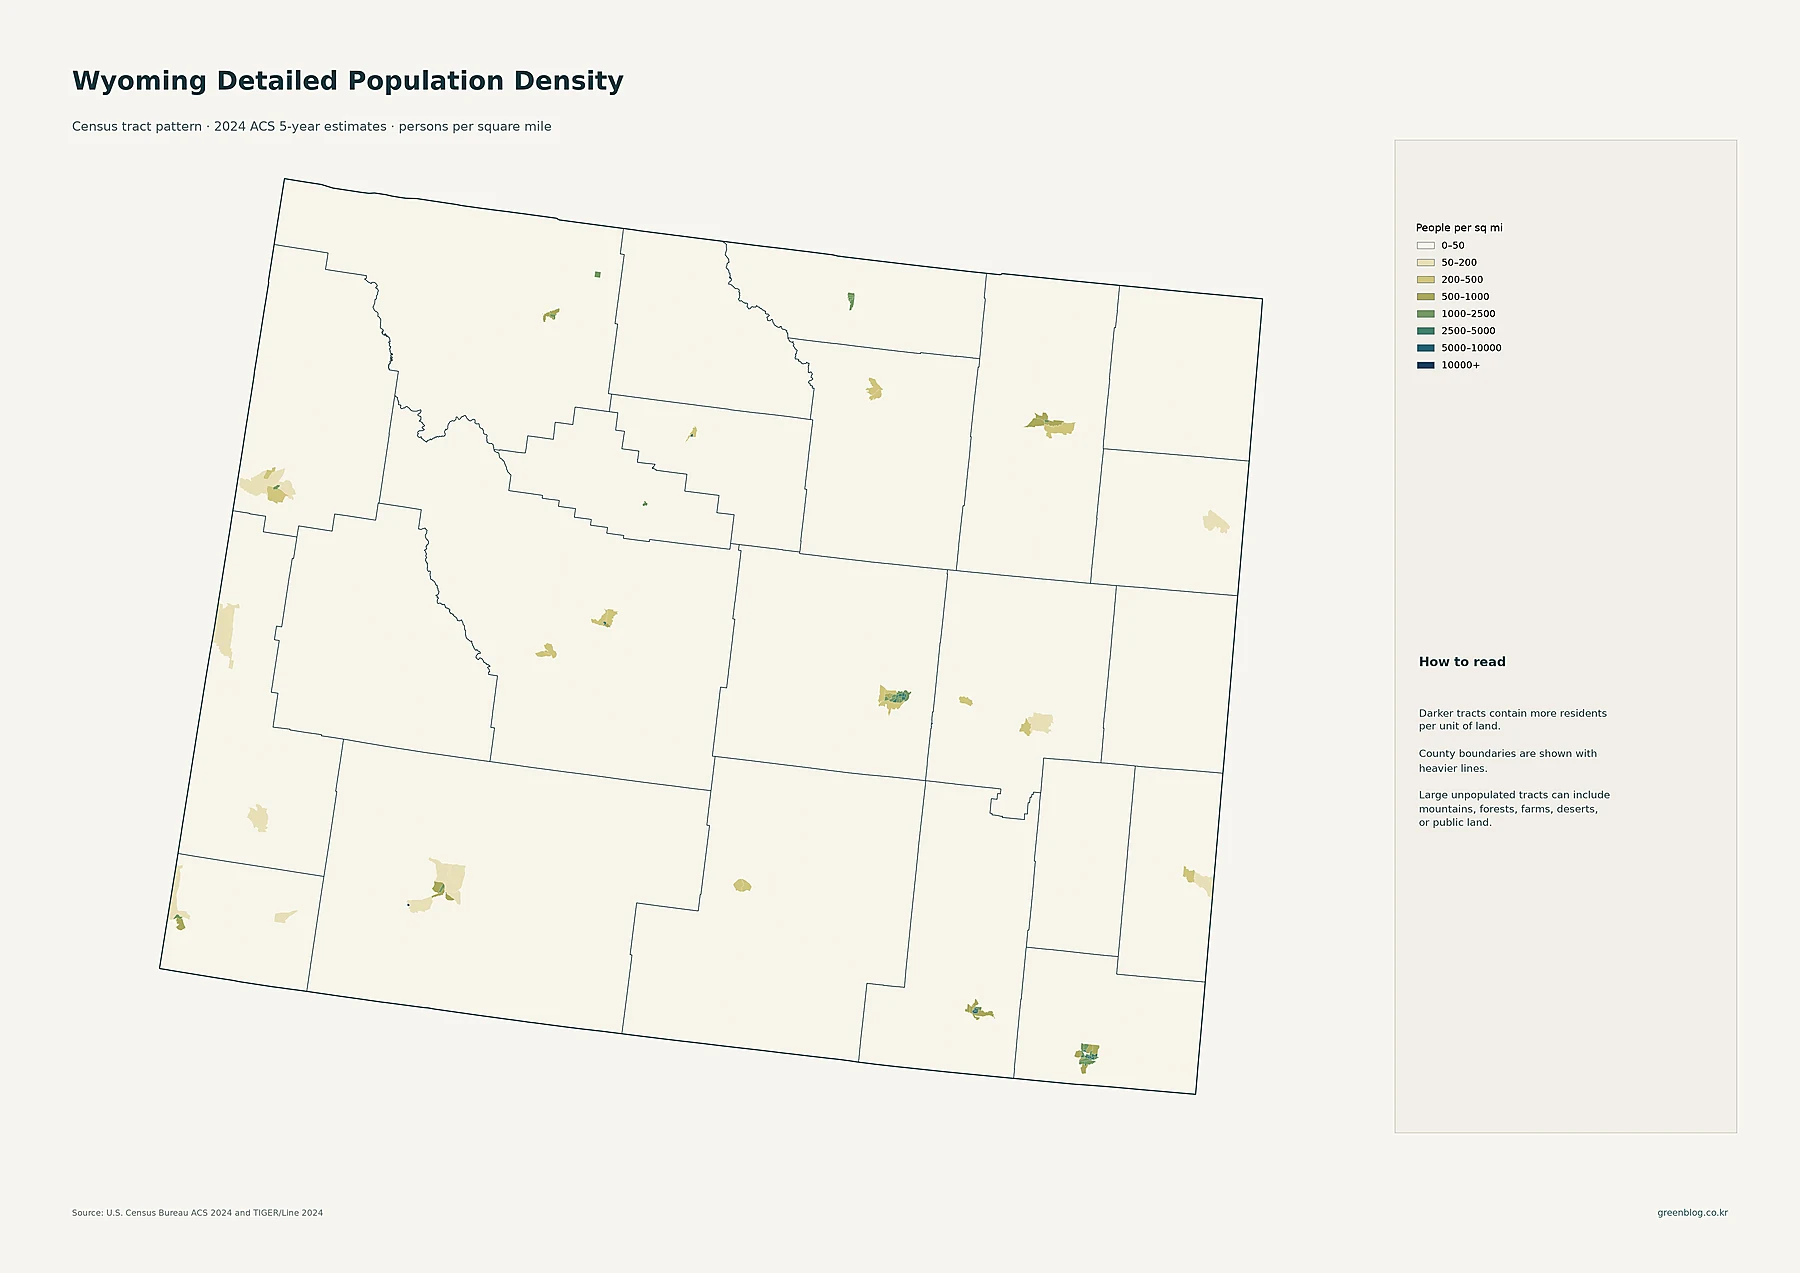
The strongest pockets appear around Cheyenne in the southeast and Casper near the center of the state. Laramie forms another visible cluster west of Cheyenne. Gillette stands out in the northeast, Sheridan in the north-central area, and Rock Springs–Green River in the southwest. Smaller concentrated tracts appear around Jackson, Riverton, Lander, Cody, Powell, Evanston, Rawlins, and several other towns. Outside those compact settlements, most of Wyoming is shown in the lightest density class. The pattern is less a continuous urban corridor than a network of separated local centers surrounded by sparsely settled land.
Cheyenne and Casper dominate the place ranking, then the scale drops quickly
On the major-cities map, circle size represents the total population of a Census place, not density. Cheyenne is the largest place in the supplied 2024 ACS file with 65,239 residents, followed by Casper with 58,839. Gillette has 33,431 and Laramie 32,234. Rock Springs is next at 23,127, followed by Sheridan at 19,285. After that, the leading places are much smaller: Evanston has 11,800, Green River 11,581, Riverton 10,856, Jackson 10,756, and Cody 10,276.
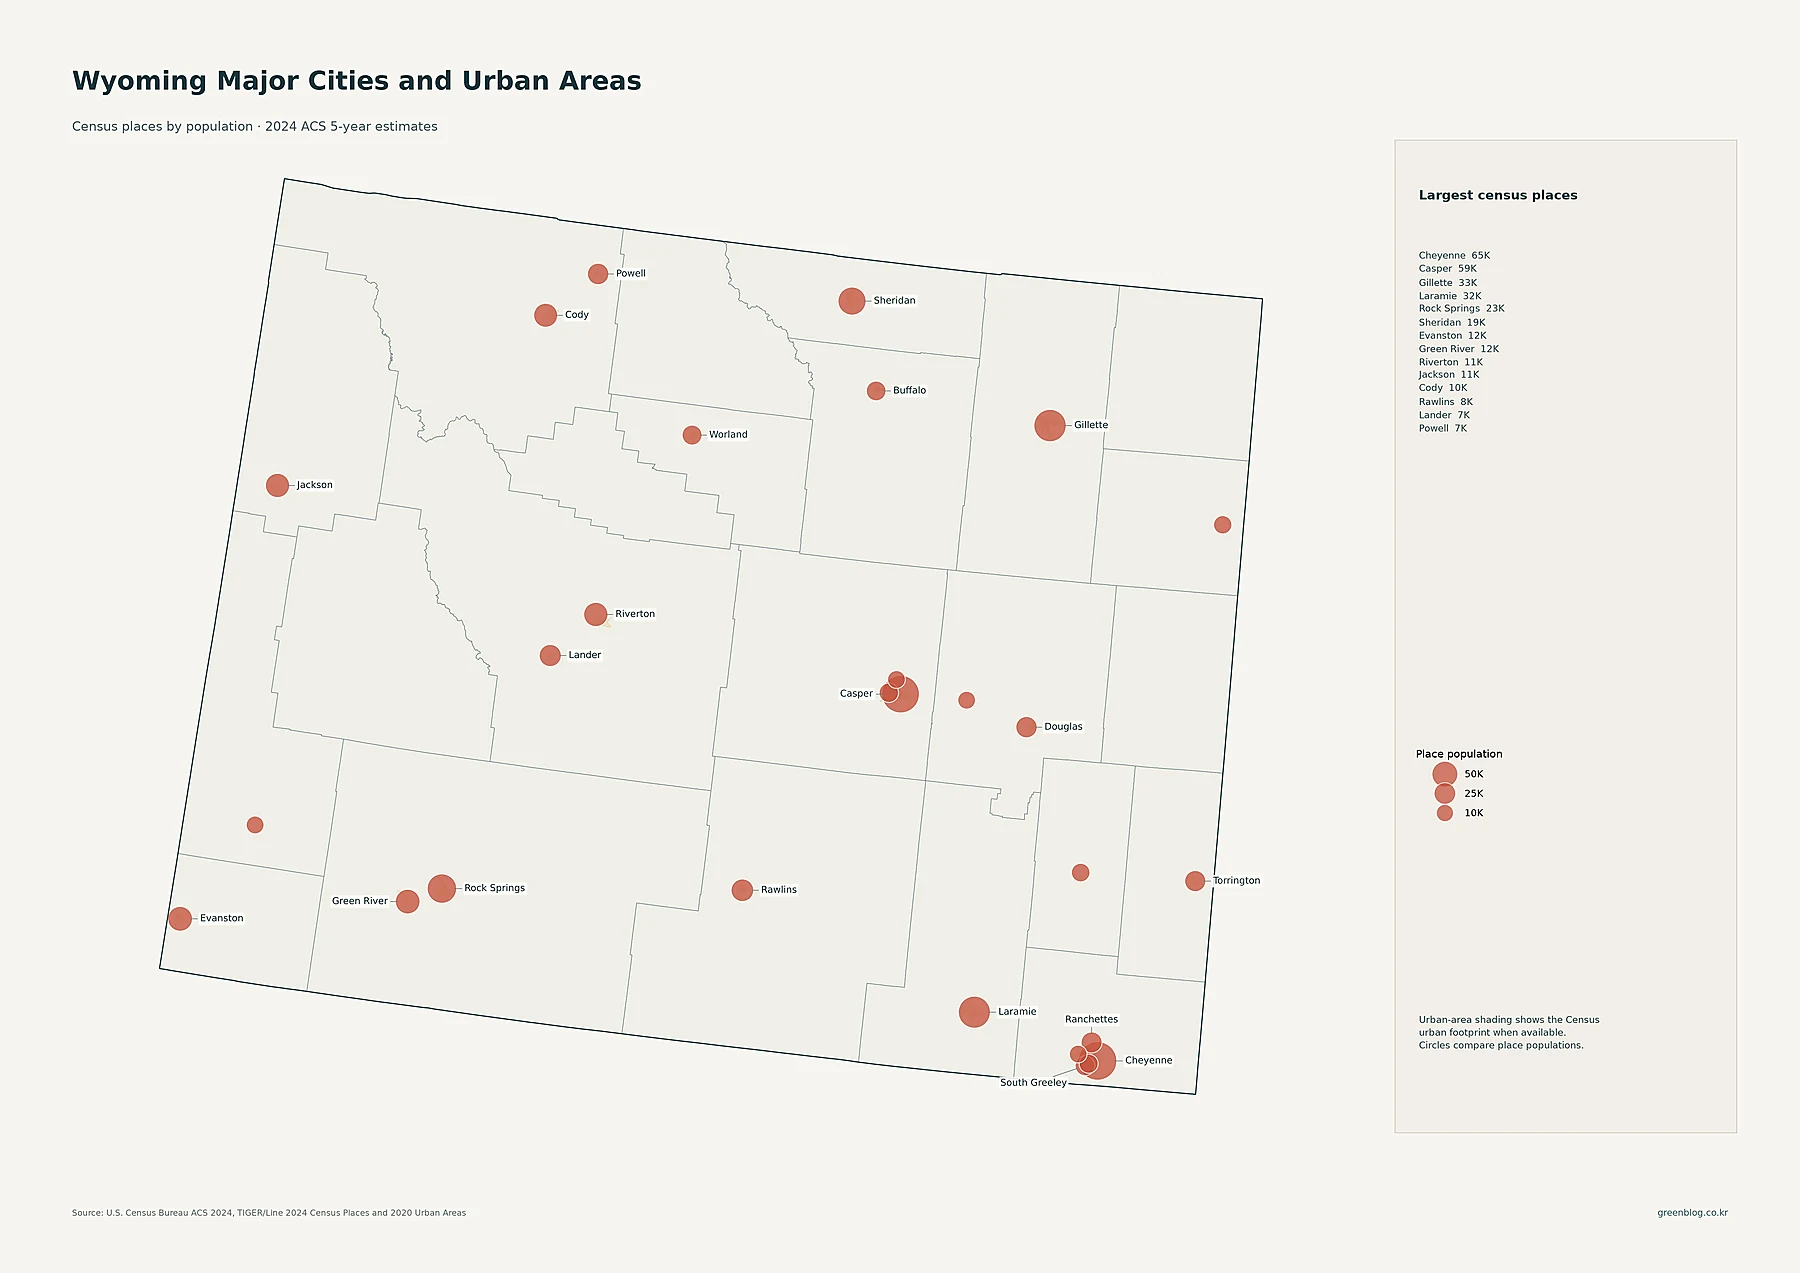
The geography of those circles helps explain the tract map. Cheyenne and Laramie create two large southeastern centers. Casper is the clearest central hub. Gillette and Sheridan anchor separate northern clusters, while Rock Springs and Green River sit close together in the southwest. Jackson appears as an isolated western center, and Cody and Powell form smaller northwestern points. Wyoming therefore has several regionally important cities without a single broad band of high density extending across the state.
Laramie County leads in both population and density, but the rest of the rankings diverge
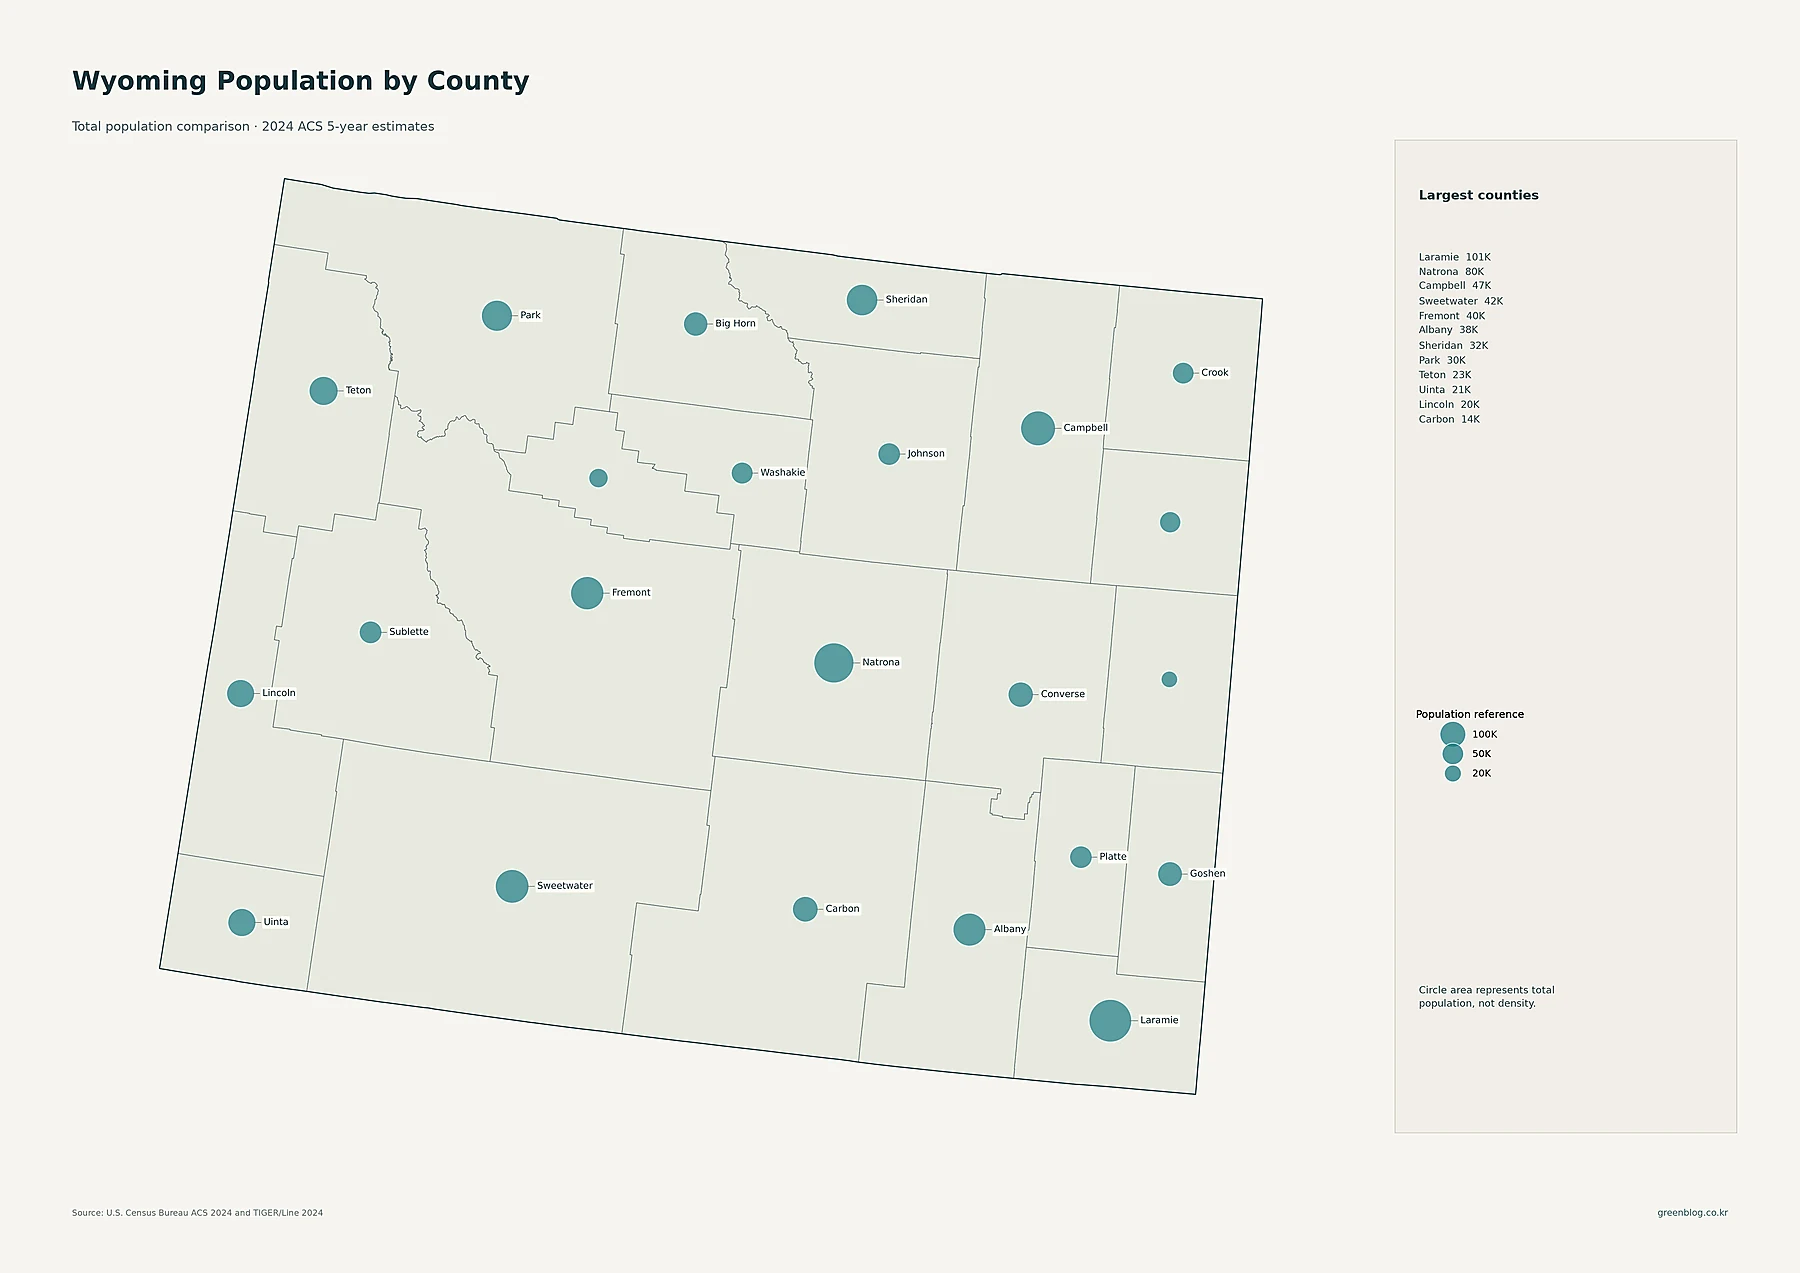
Laramie County has the largest 2024 ACS population in the supplied county file at 101,060. Natrona follows with 79,977, Campbell with 47,240, Sweetwater with 41,542, Fremont with 39,533, and Albany with 38,249. Sheridan has 32,055, Park 30,449, Teton 23,396, Uinta 20,644, and Lincoln 20,486. On the county population map, proportional-circle area represents these totals, so the largest circles appear over Laramie and Natrona counties.
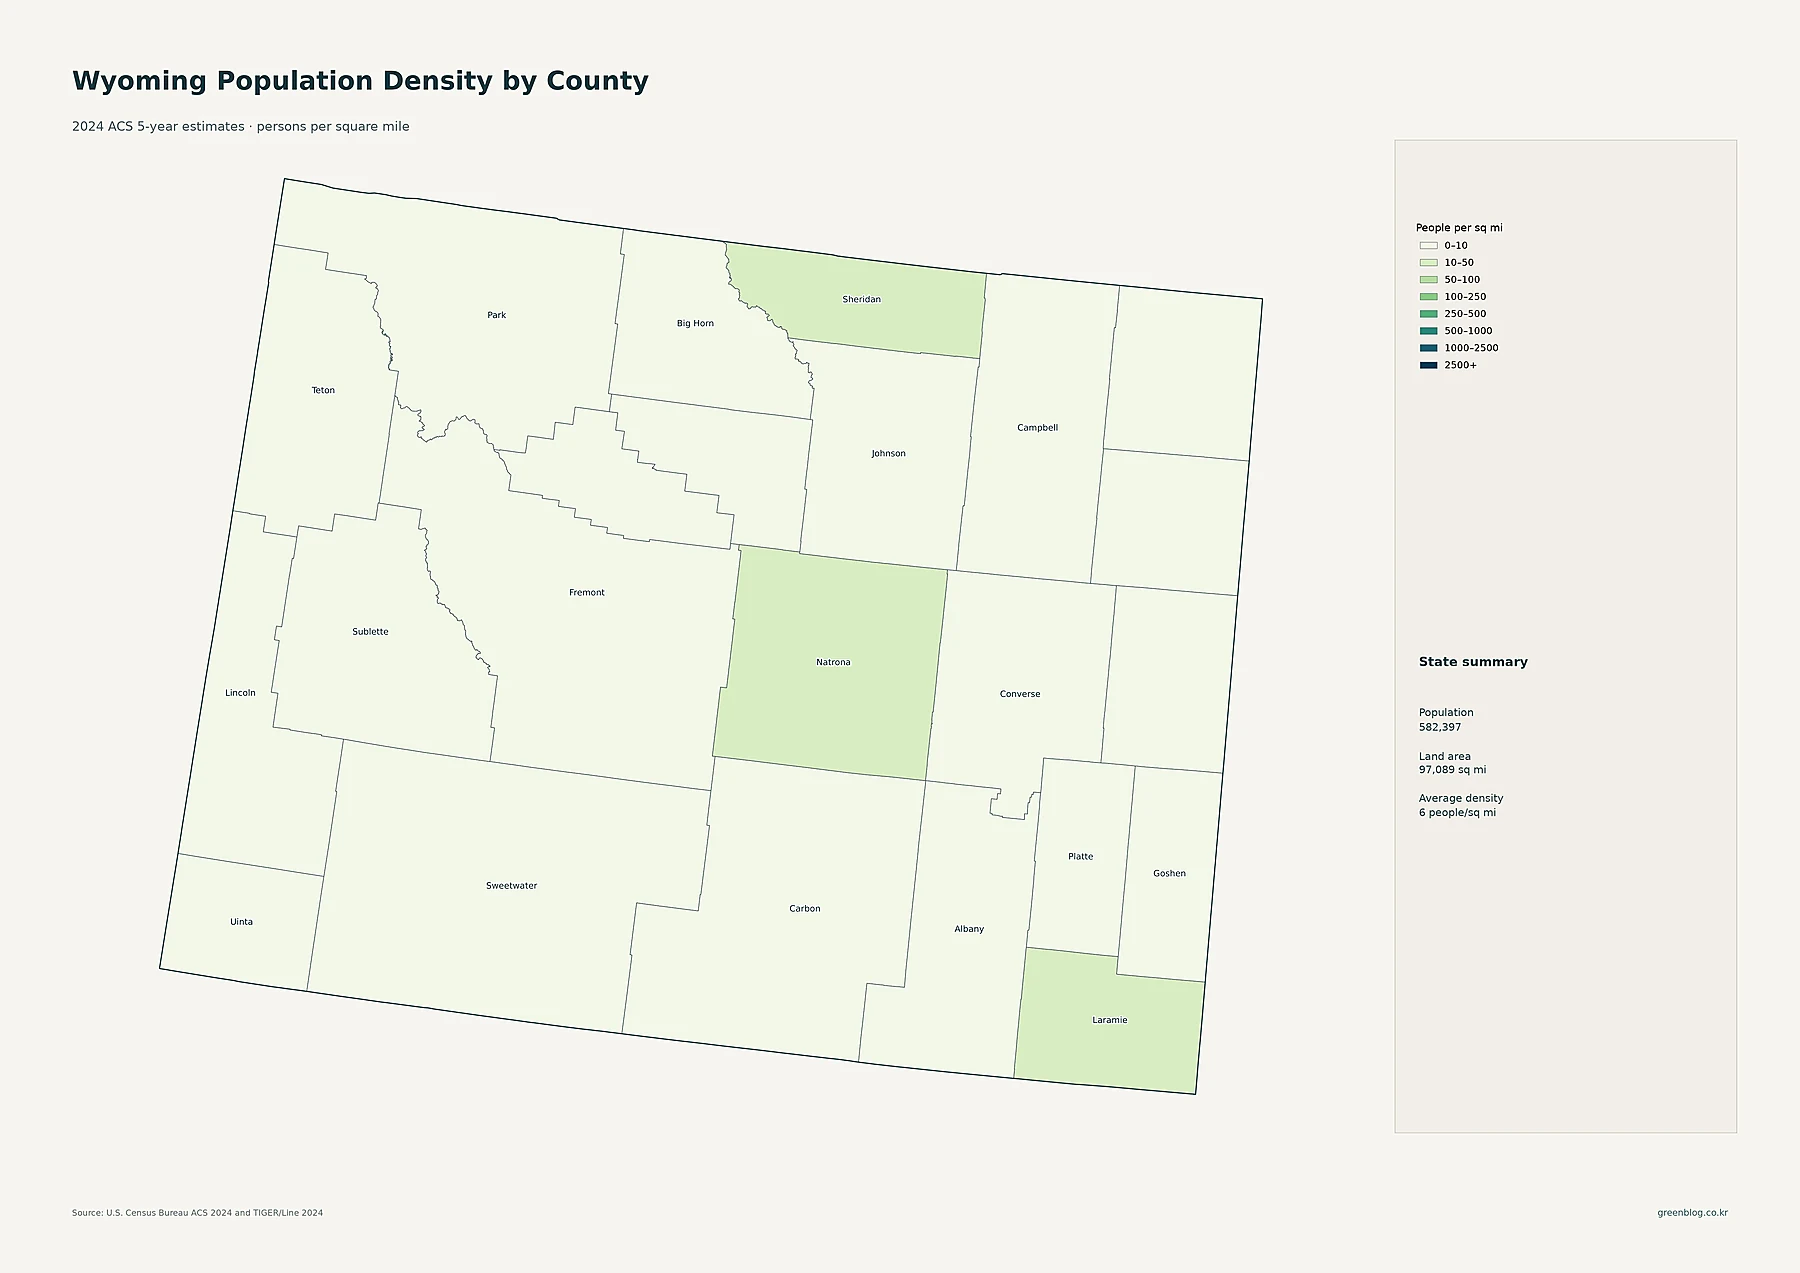
The density map produces a different scale because it divides population by land area. Laramie County is highest at about 37.6 people per square mile. Natrona is about 15.0 and Sheridan 12.7. Uinta and Campbell are both just under 10, while Albany is about 8.9. At the sparse end, Niobrara is only about 0.9 person per square mile. Sublette and Carbon are each about 1.8, Johnson about 2.1, and Hot Springs about 2.3. The county map’s legend starts with 0–10 people per square mile, and most Wyoming counties fall in that first class.
| County | 2024 ACS population | People/sq mi | 2010–2020 change |
|---|---|---|---|
| Laramie | 101,060 | 37.6 | +9.6% |
| Natrona | 79,977 | 15.0 | +6.0% |
| Sheridan | 32,055 | 12.7 | +6.2% |
| Teton | 23,396 | 5.9 | +9.6% |
| Sublette | 8,838 | 1.8 | -14.8% |
| Niobrara | 2,368 | 0.9 | -0.7% |
Teton and Laramie grew by about 9.6%, while Sublette fell nearly 15%
The change map compares 2010 and 2020 decennial census populations, rather than the 2024 ACS estimates used on the current-population maps. Blue shades show growth and warm colors show decline. In the supplied county data, 9 of Wyoming’s 23 counties increased while 14 declined. The result is a mixed map rather than a simple east-versus-west or urban-versus-rural split.
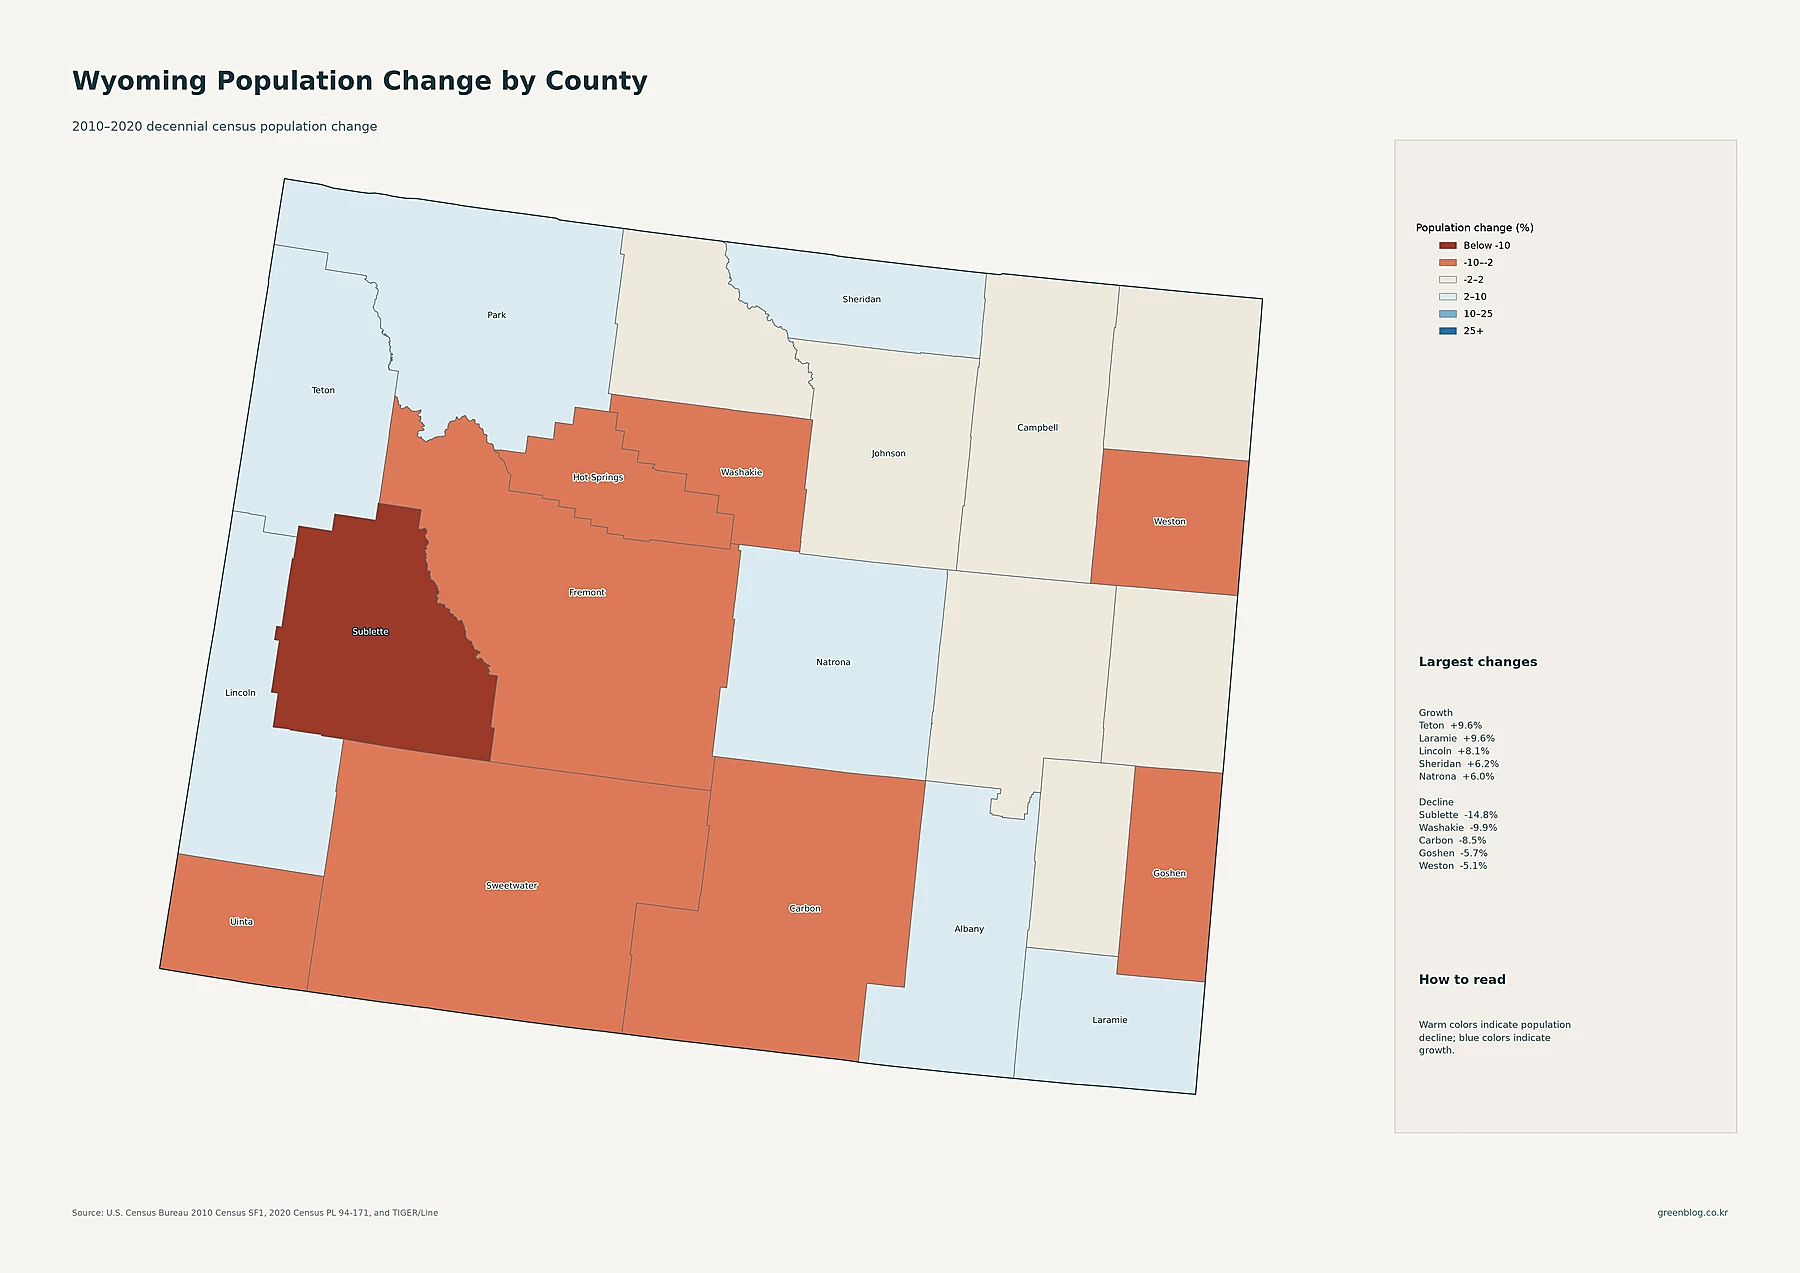
Teton County rose from 21,294 residents in 2010 to 23,331 in 2020, an increase of about 9.57%. Laramie County moved from 91,738 to 100,512, about 9.56%. At one decimal place both display as +9.6%, with Teton only fractionally higher in the underlying data. Lincoln increased 8.1%, Sheridan 6.2%, Natrona 6.0%, and Park 5.0%. The largest decline was in Sublette County, where population fell from 10,247 to 8,728, or about -14.8%. Washakie declined 9.9%, Carbon 8.5%, Goshen 5.7%, and Weston 5.1%.
Those changes do not line up perfectly with current size. Laramie combines the state’s largest 2024 county population, its highest county density, and strong 2010–2020 growth. Teton is much smaller in total population but posted the highest growth rate in the supplied decade data. Sweetwater, by contrast, is still the fourth-largest county in the 2024 ACS file at 41,542 residents, yet it declined by about 3.5% between 2010 and 2020. Sublette is both very low-density and the steepest-declining county over that decade.
Three rules make the Wyoming maps easier to read
- Do not treat big circles as high density: circles on the place and county-population maps represent total residents. Density is shown separately as people per square mile.
- Pair county averages with tract detail: a county can average fewer than 10 people per square mile and still contain a compact town with much higher tract density.
- Keep the reference periods separate: current population and density use 2024 ACS 5-year estimates, while the change map compares the 2010 and 2020 decennial censuses.
Taken together, the maps describe Wyoming as a state of widely separated settlement nodes rather than a continuous urban system. Cheyenne is the largest Census place, with Casper close behind. Laramie County is the largest and densest county, yet its density is only about 38 people per square mile. The tract map reveals why that county average can still contain clearly urban neighborhoods: most residents occupy a small share of the land. The decade-change map adds another layer, separating Teton, Laramie, Lincoln, Sheridan, and Natrona growth from substantial losses in Sublette, Washakie, and Carbon.
Download the Wyoming population map collection
The collection includes the census-tract density map, major cities and urban areas, county population, 2010–2020 county change, and county population density. Use the ZIP below to get the full set, or open an individual image from its figure above.
Frequently asked questions
Which Wyoming county has the highest population density?
Laramie County is highest in the supplied 2024 ACS 5-year data at about 37.6 people per square mile. Natrona is next at about 15.0, followed by Sheridan at about 12.7.
Is Cheyenne the largest city in Wyoming?
Using the Census place data supplied with these maps, Cheyenne is the largest at 65,239 residents in the 2024 ACS 5-year estimates. Casper follows at 58,839, with Gillette at 33,431 and Laramie at 32,234.
Which Wyoming county changed the most from 2010 to 2020?
Teton had the highest growth rate at about +9.57%, only fractionally above Laramie at +9.56%; both round to +9.6% on the map. Sublette had the largest decline at about -14.8%.
Related Maps
Sources
- U.S. Census Bureau — American Community Survey Data: 2024 ACS 5-year population and small-area estimates.
- U.S. Census Bureau — 2024 TIGER/Line Shapefiles: county, census tract, Census place, and other geographic boundaries.
- U.S. Census Bureau — 2010 Census Summary File 1: 2010 population reference.
- U.S. Census Bureau — 2020 Census P.L. 94-171: 2020 population reference.
Note: Values follow the period printed on each map. ACS figures are survey-based estimates, while the 2010–2020 change values compare decennial census counts.
Green Map creates custom-edited map images using open geographic data sources such as geoBoundaries, Natural Earth, OpenStreetMap, and government open data.
These maps are edited visual materials, not raw data files, and are provided for education, documents, presentations, and graphic reference.