Indiana’s population pattern is more complex than a single large dot at Indianapolis. At the census-tract level, the Indianapolis area forms the state’s broadest continuous high-density cluster, but several other urban concentrations are easy to see: the Lake County communities tied to the Chicago metropolitan area, Fort Wayne in the northeast, South Bend and Elkhart in the north, and Evansville in the southwest. The 2024 ACS 5-year estimates used for these maps put Indiana’s population at 6,851,073. The county-density map reports about 35,825 square miles of land and a statewide average of roughly 191 people per square mile.
That statewide average should not be mistaken for a typical local density. The maps are designed to answer different questions. Census tracts show fine-grained density inside and around urban areas. The cities map compares the populations of census places. The county population map uses proportional circles for total residents, while the county density map divides population by land area. The 2010–2020 change map adds a different time dimension by showing percentage growth or decline over the decade. Keeping those measures separate is essential because a large population does not automatically mean high density, and a fast-growing county does not have to be the most populous one.
Table of Contents
The Indianapolis area forms Indiana’s broadest tract-level density cluster
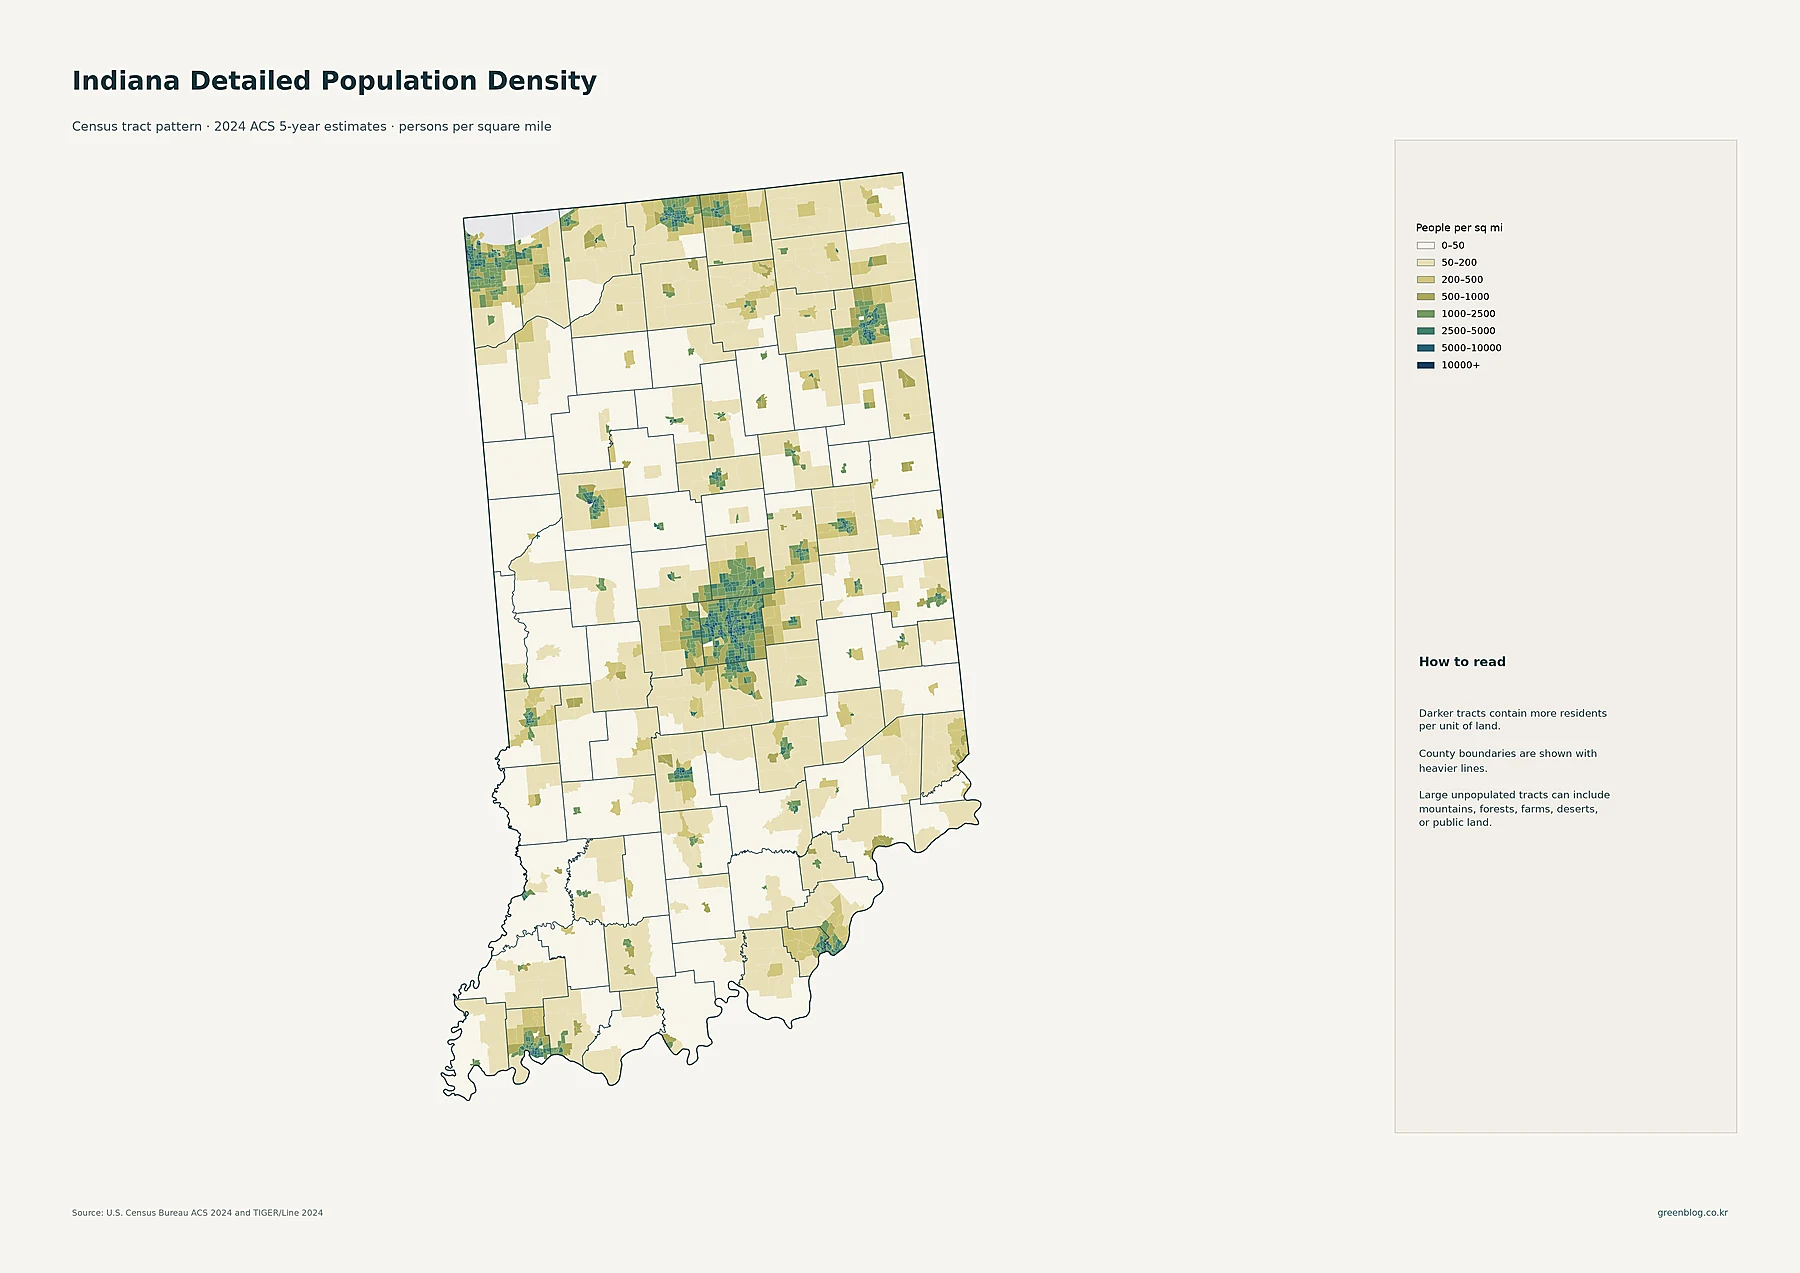
The tract map uses eight density classes, ranging from 0–50 people per square mile to 10,000 or more. The strongest continuous concentration sits in central Indiana around Indianapolis. High-density tracts fill much of Marion County’s urban core, and developed tracts extend north toward Hamilton County, west toward Hendricks County, and south toward Johnson County. This makes the metropolitan pattern visible across county boundaries rather than reducing the area to a single county average.
Outside central Indiana, dense areas are more localized. Fort Wayne creates a clear northeastern cluster. South Bend and Elkhart stand out in the north, while Hammond and Gary mark the heavily settled northwest near Chicago. Lafayette appears as another distinct concentration west of the state’s center. Evansville forms the principal southwestern cluster, and the Clark–Floyd area near Louisville is visible in the southeast. Between these places, many tracts fall into much lighter density classes, showing how strongly Indiana’s settlement is organized around urban nodes and corridors rather than spread evenly across the state.
Indianapolis dominates the city comparison, with several regional centers beyond it
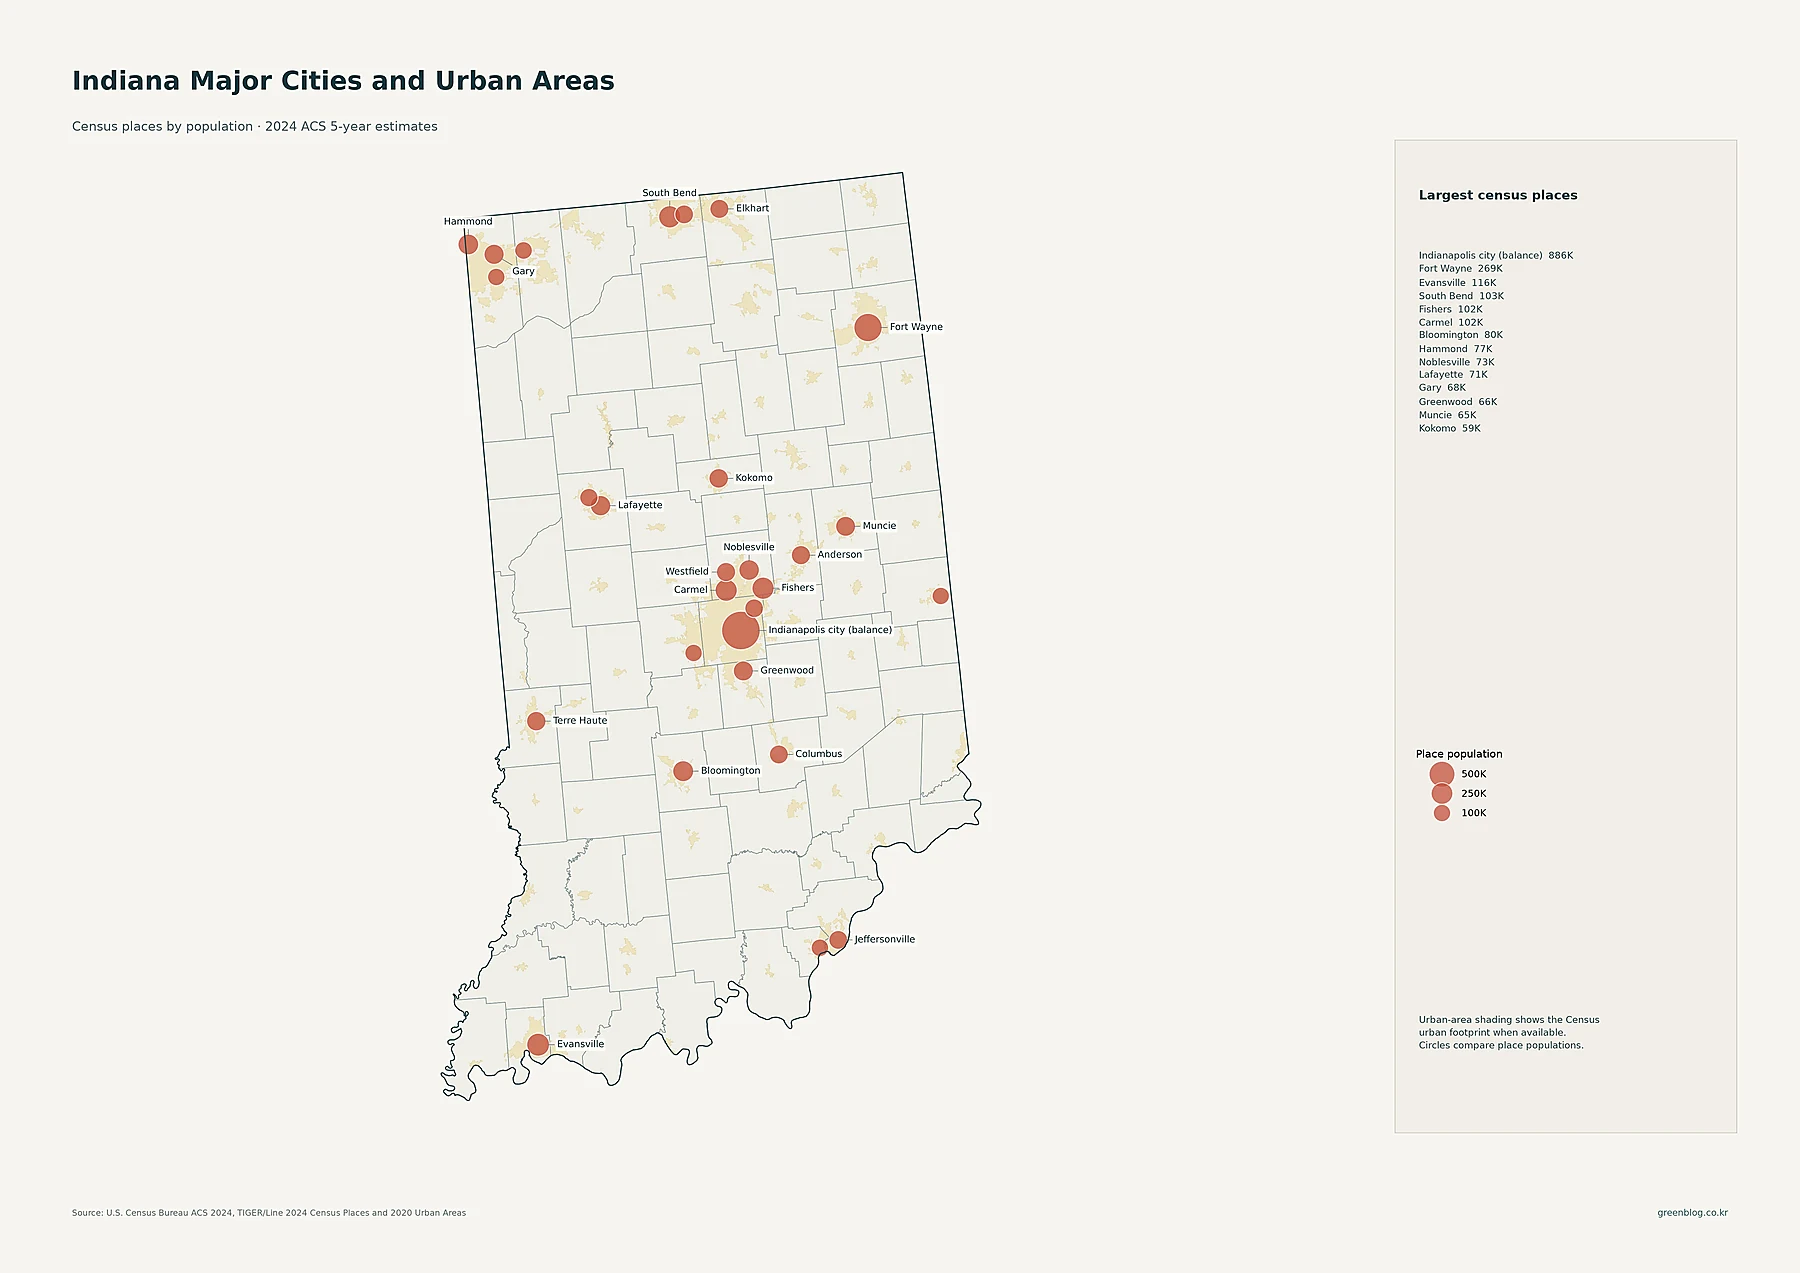
Indianapolis city (balance) is the largest census place on the map at 885,860 people. Fort Wayne is a distant second at 268,589. Evansville has 116,116 residents, South Bend 103,085, Fishers 102,337, and Carmel 101,651. Bloomington is shown at 80,049, Hammond at 76,768, Noblesville at 73,362, Lafayette at 71,159, and Gary at 68,113. Greenwood, Muncie, Kokomo, Terre Haute, Anderson, Westfield, Elkhart, Columbus, and Jeffersonville add more regional centers across the state.
The central metropolitan pattern is especially clear because Fishers, Carmel, Noblesville, and Westfield cluster north of Indianapolis, while Greenwood appears just to the south. Northwest Indiana has a different configuration, with Hammond and Gary positioned close to the Chicago side of the state. South Bend–Elkhart and Fort Wayne form separate northern and northeastern centers. The circles on this map represent place populations, however, not population density. A city can have a large circle because it has many residents even if its population is spread across a comparatively large area.
Marion County leads total population, followed by Lake, Allen, and Hamilton
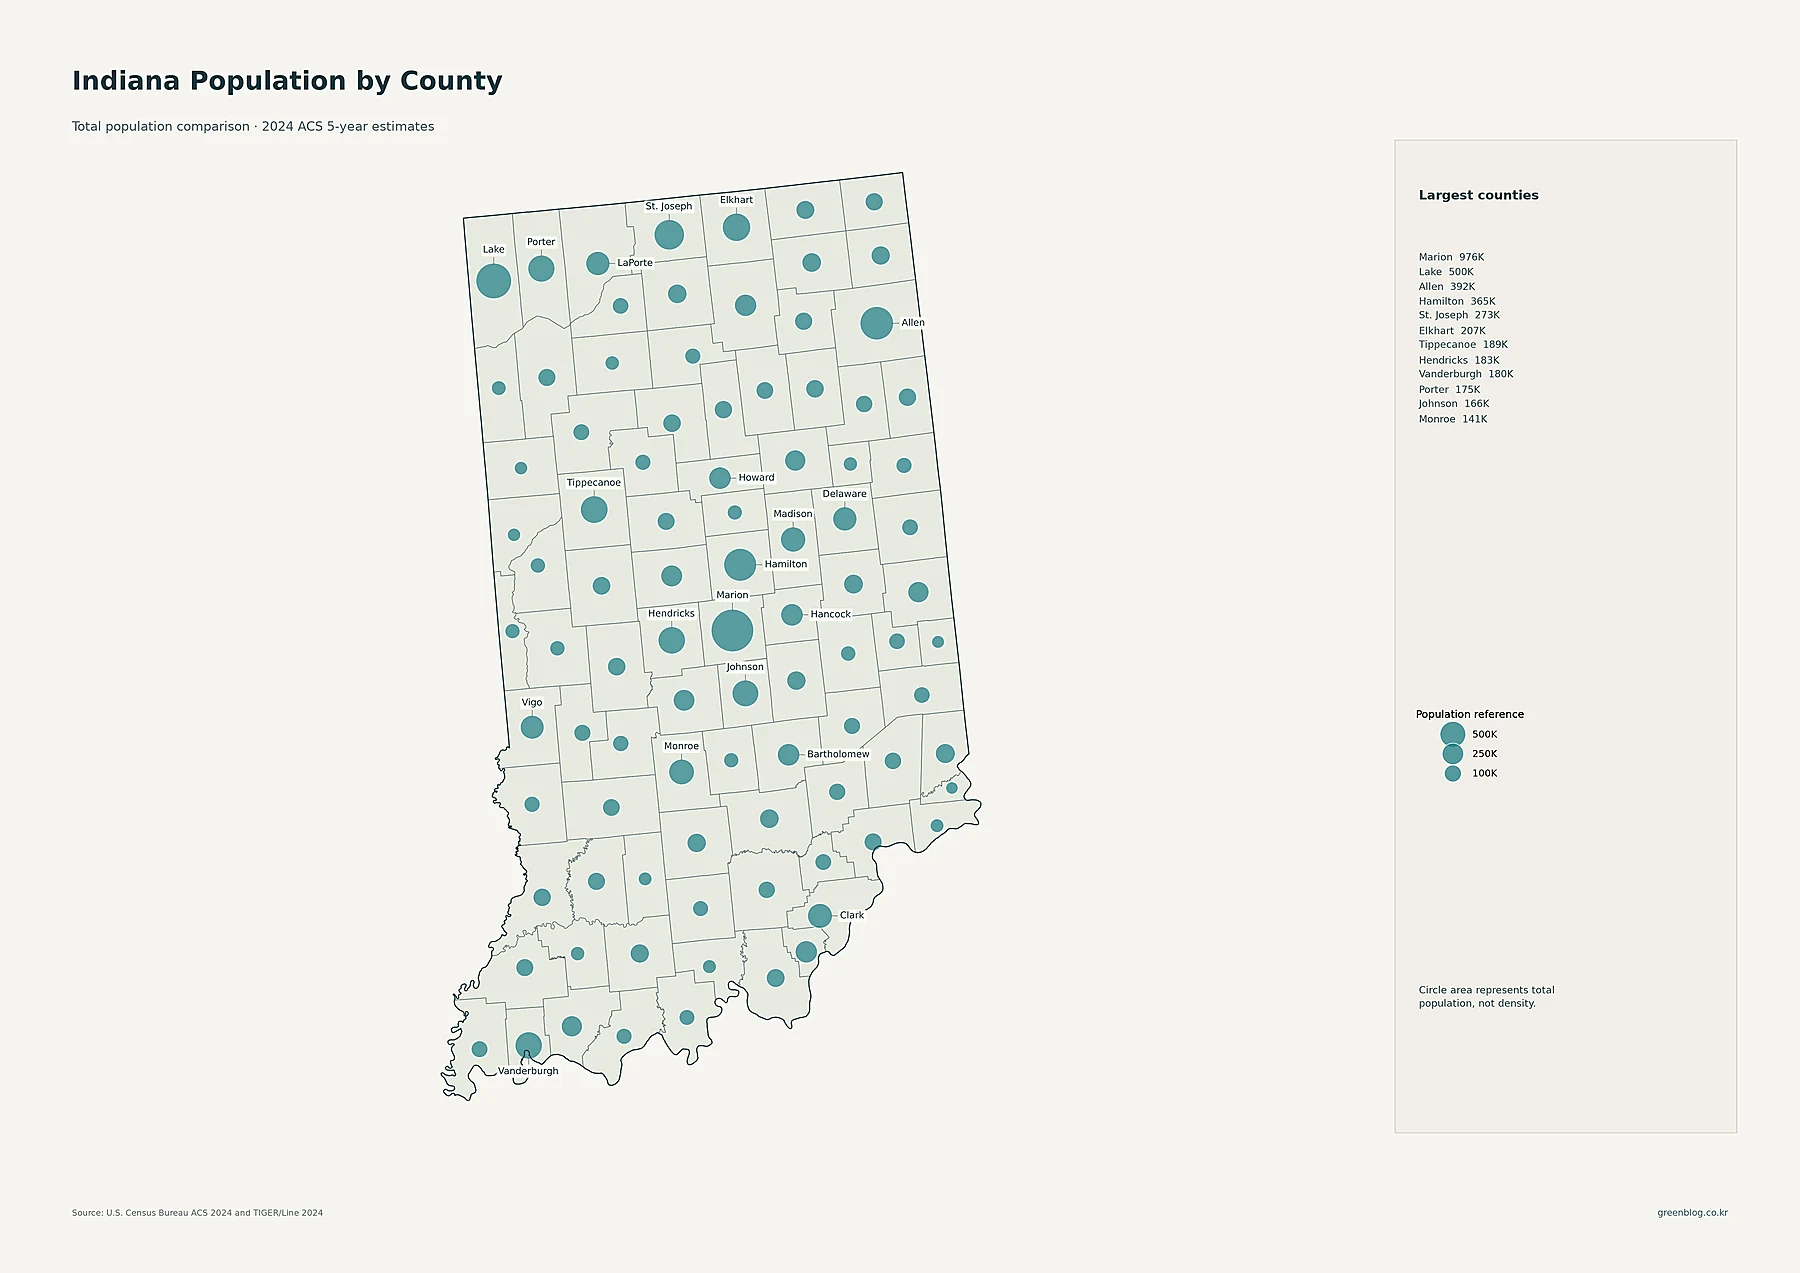
Marion County has the state’s largest county population at 975,809. Lake County is next at 500,379, followed by Allen County at 392,378 and Hamilton County at 365,056. St. Joseph County has 273,040 residents, Elkhart County 207,132, Tippecanoe County 189,071, Hendricks County 183,344, Vanderburgh County 180,117, and Porter County 174,818. Johnson County, immediately south of Marion, has 166,315. These totals highlight both the Indianapolis-centered concentration and a network of large counties associated with Indiana’s other metropolitan areas.
This proportional-circle map answers a very specific question: how many people live in each county. It does not show how tightly those people are packed into the county’s land area. A physically large county can have a substantial population and still have a moderate average density. A smaller urbanized county can rank higher in density than in total population. The next map therefore changes the measure from total residents to residents per square mile.
County density puts Marion above 2,400 people per square mile
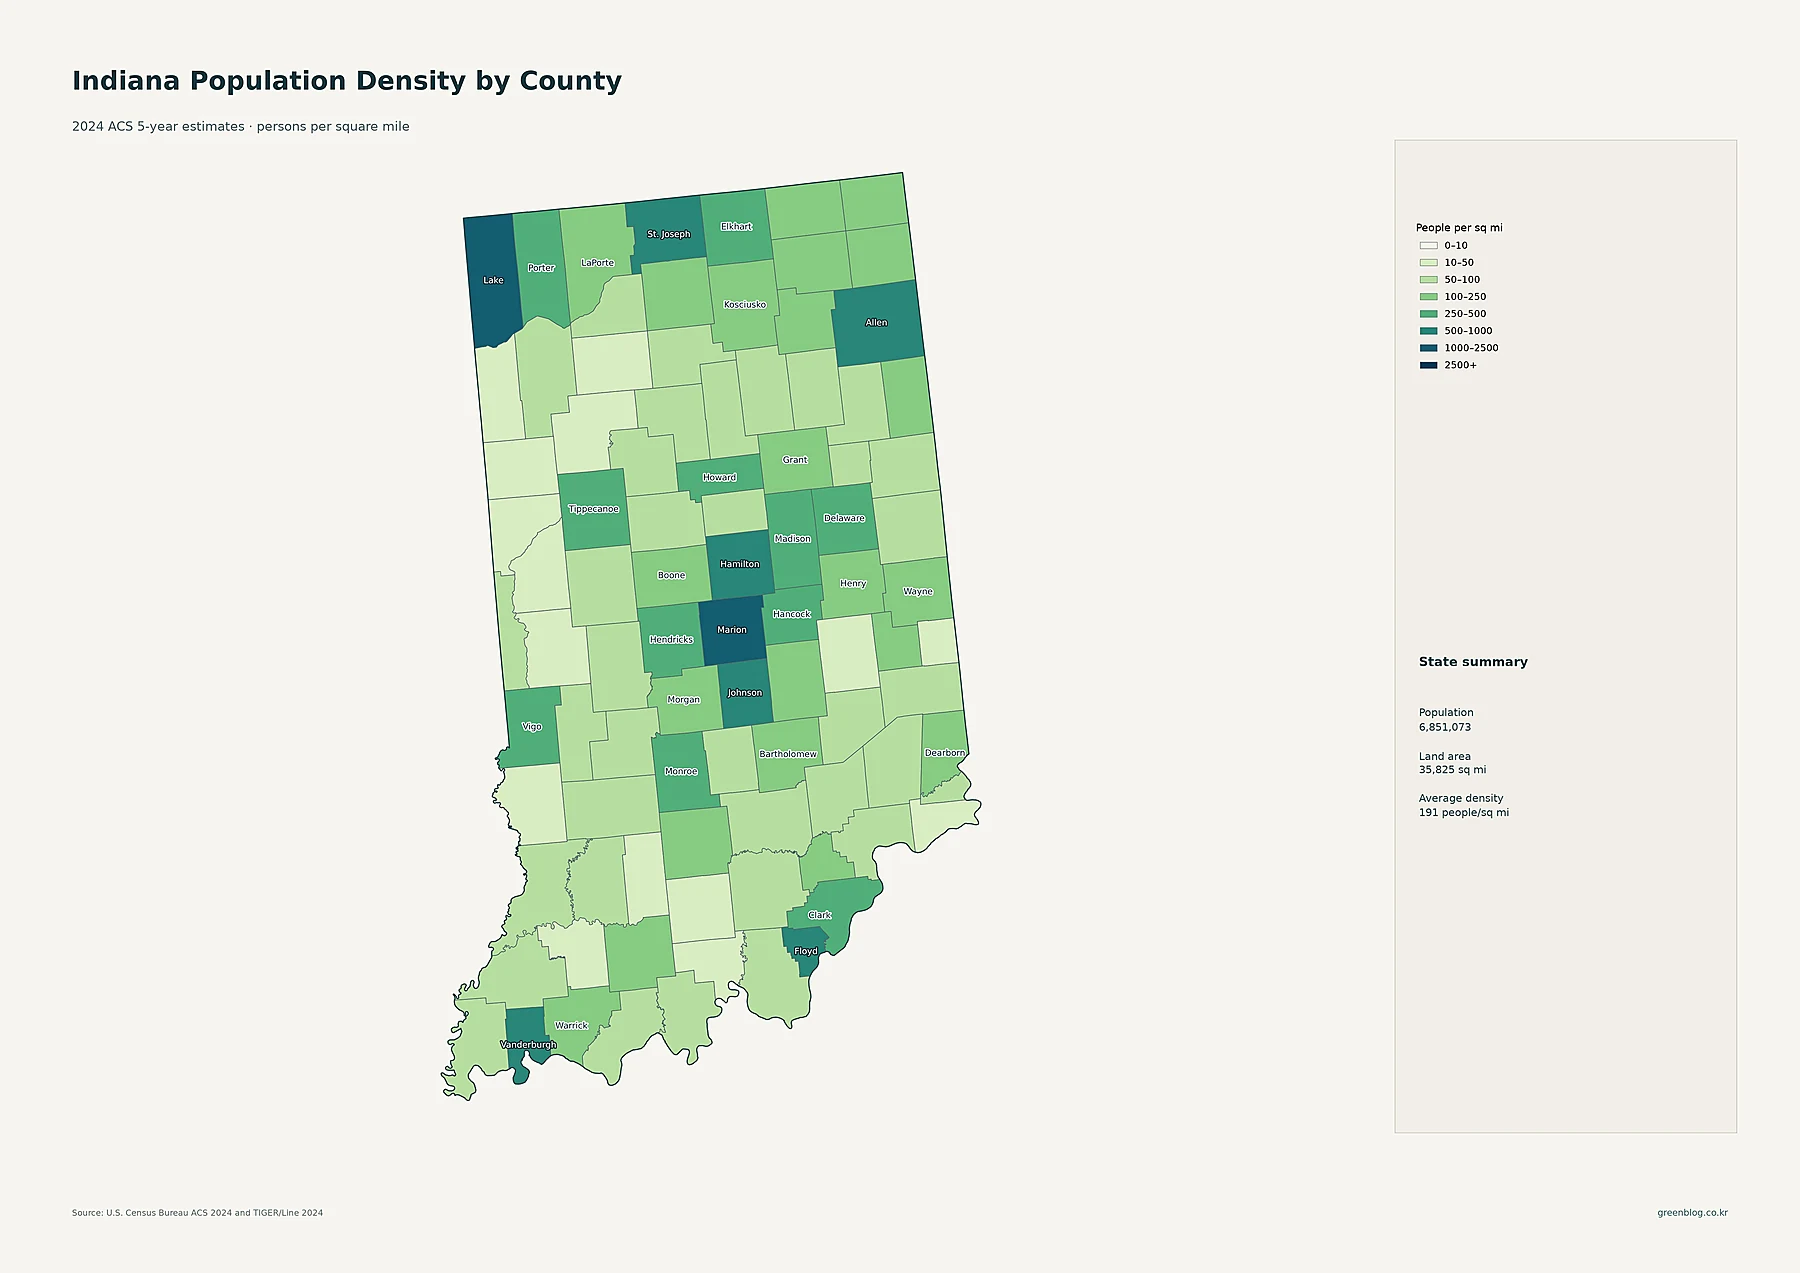
Marion County also ranks first in average density at about 2,464 people per square mile. Lake County is about 1,003, Hamilton County about 926, and Vanderburgh County about 772. Allen and St. Joseph counties are almost identical at roughly 597 and 596 people per square mile. Floyd County is about 545, Johnson about 519, Hendricks about 451, and Elkhart about 447. These values place major metropolitan counties at the darker end of the map even when their total populations differ substantially.
At the low-density end, Benton County is about 21.5 people per square mile and Warren County about 23.2. Pulaski is about 28.7 and Martin about 29.3. Several other rural counties fall below 50 people per square mile. The contrast helps explain why Indiana’s statewide average of about 191 people per square mile can be misleading when used alone. It blends Marion County’s urban density with large stretches of rural land where settlement is much thinner.
| Measure | Leading area | Value shown in the data |
|---|---|---|
| State population | Indiana | 6,851,073 |
| Largest county population | Marion | 975,809 |
| Highest county density | Marion | about 2,464/sq mi |
| Fastest 2010–2020 growth | Hamilton | +26.5% |
| Largest 2010–2020 decline | Switzerland | -8.3% |
Hamilton and Boone posted the strongest 2010–2020 county growth
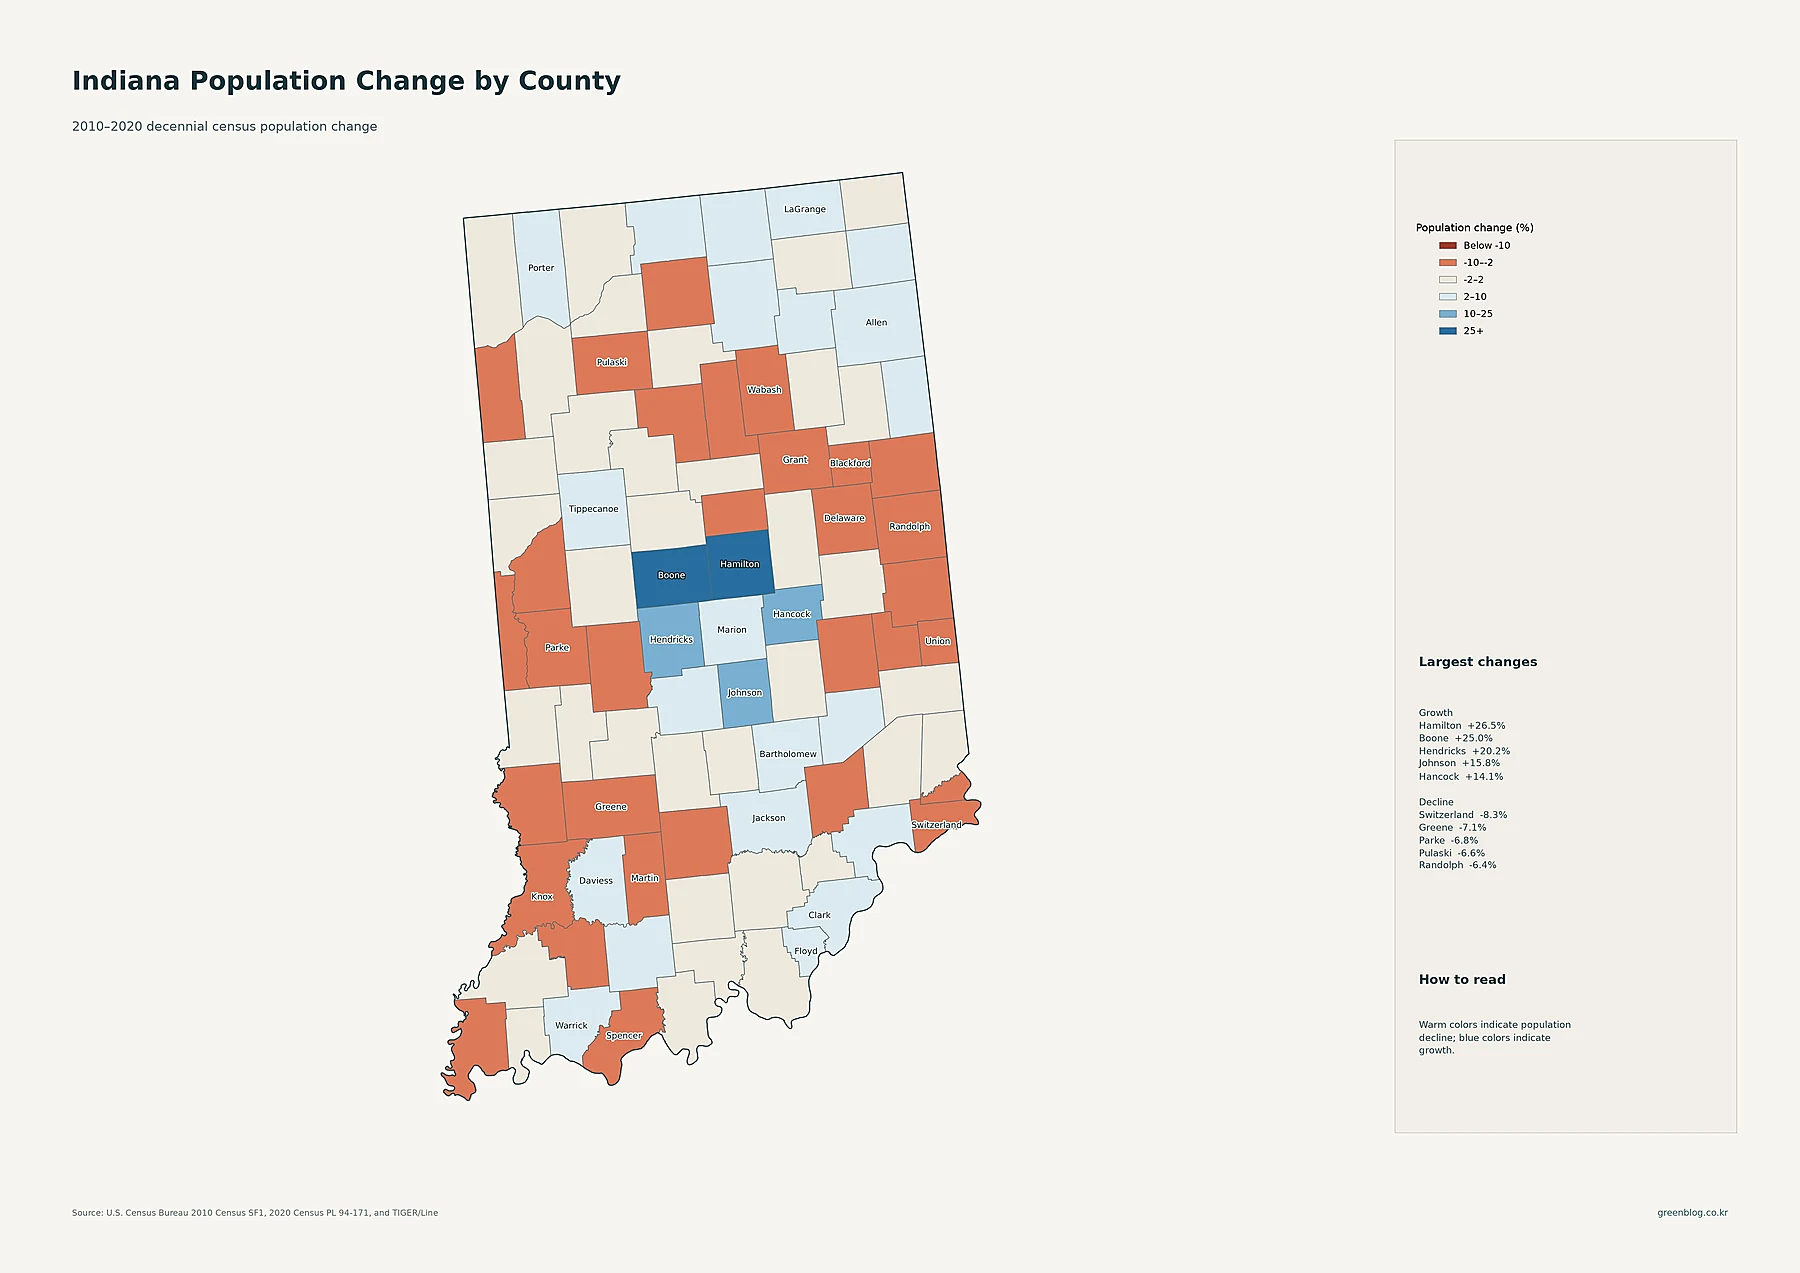
The change map uses 2010 and 2020 Decennial Census counts, so it should not be read as a 2024 growth estimate. Hamilton County had the largest percentage increase at about 26.5%, with Boone County close behind at 25.0%. Hendricks County grew about 20.2%, Johnson County 15.8%, and Hancock County 14.1%. Those counties sit in or near the Indianapolis metropolitan area, creating a visible ring of stronger growth around the state’s largest urban center.
Other gains include Clark County at about 9.9%, Jackson at 9.6%, LaGrange at 8.9%, Allen at 8.5%, and Marion at 8.2%. On the decline side, Switzerland County fell by about 8.3%, Greene by 7.1%, Parke by 6.8%, Pulaski by 6.6%, and Randolph by 6.4%. Warm-colored counties appear in several parts of the state rather than in one single region. The map establishes where population rose or fell, but it does not establish the reasons for those changes, so causes should not be inferred from the color pattern alone.
Reading the five maps together separates size, density, and growth
Taken together, the maps show a state with one dominant central population core and several important regional centers. Indianapolis and Marion County lead both total population and density. Lake County combines a large population with high density in northwest Indiana, while Allen County anchors the Fort Wayne area. St. Joseph and Elkhart define another northern concentration, and Vanderburgh stands out in the southwest. Yet the decade’s fastest growth occurred not in Marion but in suburban Hamilton and Boone counties.
For classroom or reference use, the city and county-population maps make location and relative size easy to compare. For settlement analysis, the tract-density and county-density maps are more informative because they show how concentrated residents are within land area. The 2010–2020 map adds a historical comparison that should be kept separate from the 2024 ACS estimates. Using the maps together prevents three common mistakes: treating a large population as high density, treating high density as fast growth, or treating decade-long growth as a current-year population estimate.
Download the Indiana population map collection
The ZIP collection includes the detailed population-density map, major cities and urban areas, county population, 2010–2020 county change, and county population-density map.
FAQ
Which Indiana county has the highest population density?
Marion County is highest in the supplied 2024 ACS data at about 2,464 people per square mile. Lake County is next at roughly 1,003, followed by Hamilton County at about 926.
Is Marion County also Indiana’s most populous county?
Yes. Its 2024 ACS estimate is 975,809, the largest county total in the state. Total population and density are separate measures, however, so both maps are useful when comparing counties.
Which Indiana county grew fastest from 2010 to 2020?
Hamilton County had the largest percentage increase in the supplied Decennial Census comparison at about 26.5%. Boone County was close behind at about 25.0%, while Switzerland County had the largest decline at about 8.3%.
Related Maps
Sources
- U.S. Census Bureau — American Community Survey (ACS): 2024 ACS 5-year population estimates.
- U.S. Census Bureau — TIGER/Line Shapefiles: 2024 county, tract, and place boundaries used in the maps.
- U.S. Census Bureau — Decennial Census: 2010 and 2020 population counts used for the county change comparison.
Green Map creates custom-edited map images using open geographic data sources such as geoBoundaries, Natural Earth, OpenStreetMap, and government open data.
These maps are edited visual materials, not raw data files, and are provided for education, documents, presentations, and graphic reference.