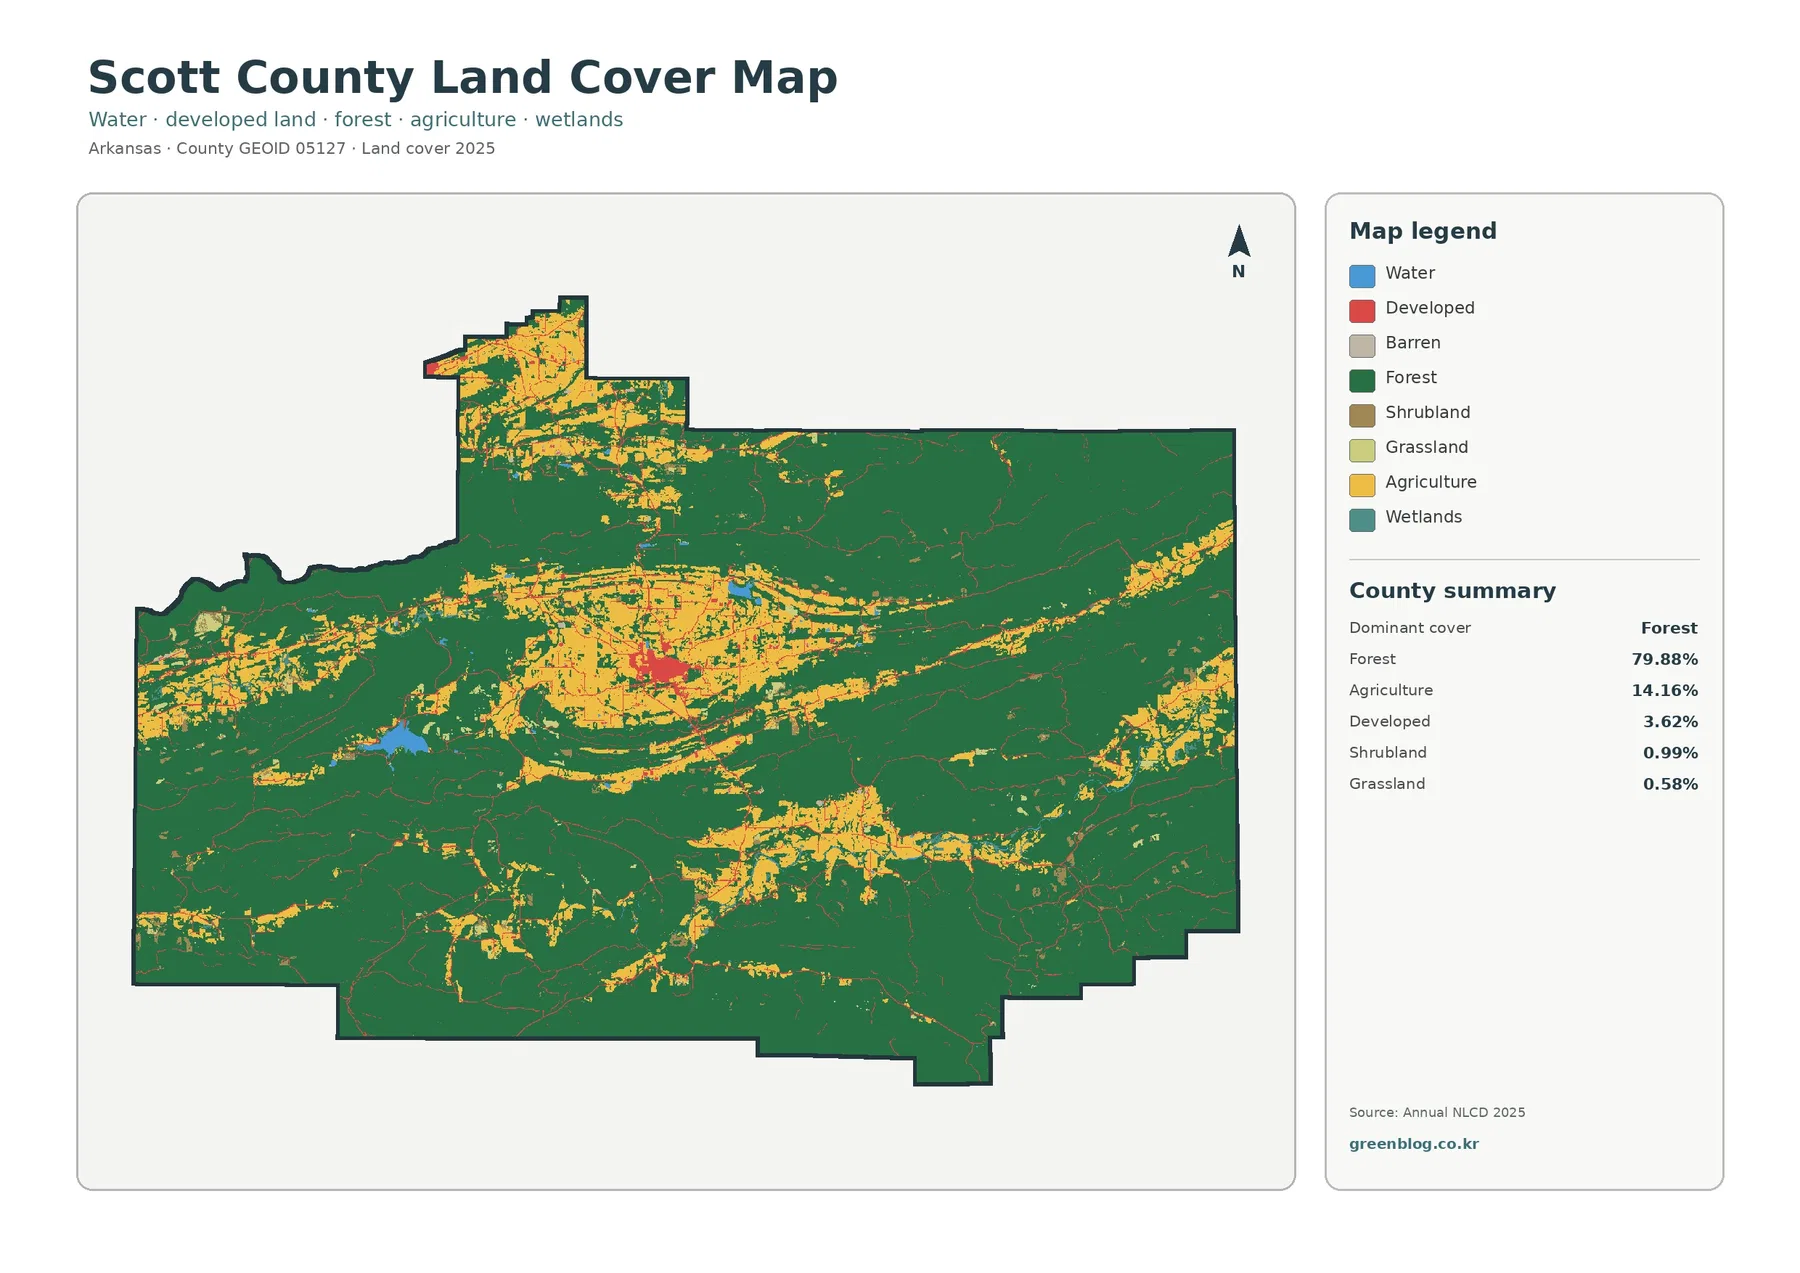
Scott County’s 2025 land-cover map is overwhelmingly green: forest accounts for 79.88% of the county. The pattern is not featureless, though. Broad agricultural and open-land patches break through the forest in the central area and toward the northwest, while the clearest developed concentration sits around Waldron. Those contrasts make the county useful for comparing a heavily forested landscape with a small urban core, limited open water, and scattered agricultural ground.
This page includes four views of the same county: general land cover, forest and farmland, impervious surface/developed land, and a 1985–2025 classification comparison. The WebP images are meant for quick reading in the article. Farther down the page, all four original JPG maps are available in one download. Land cover describes the physical surface seen by the classification, not parcel ownership, zoning, property boundaries, or legal development rights.
Table of Contents
Forest dominates Scott County, but the open land forms recognizable bands and pockets
The general 2025 map shows forest across nearly every part of Scott County. Large connected green areas fill the east and south, and the western side is also mostly wooded. The main breaks occur through the middle of the county and in the northwest, where agricultural cover and other open classes create brighter patches. That visible pattern gives more information than the 79.88% forest figure alone. The county is clearly forest-dominated, but the nonforest ground is organized into several noticeable zones rather than being evenly sprinkled through the landscape.
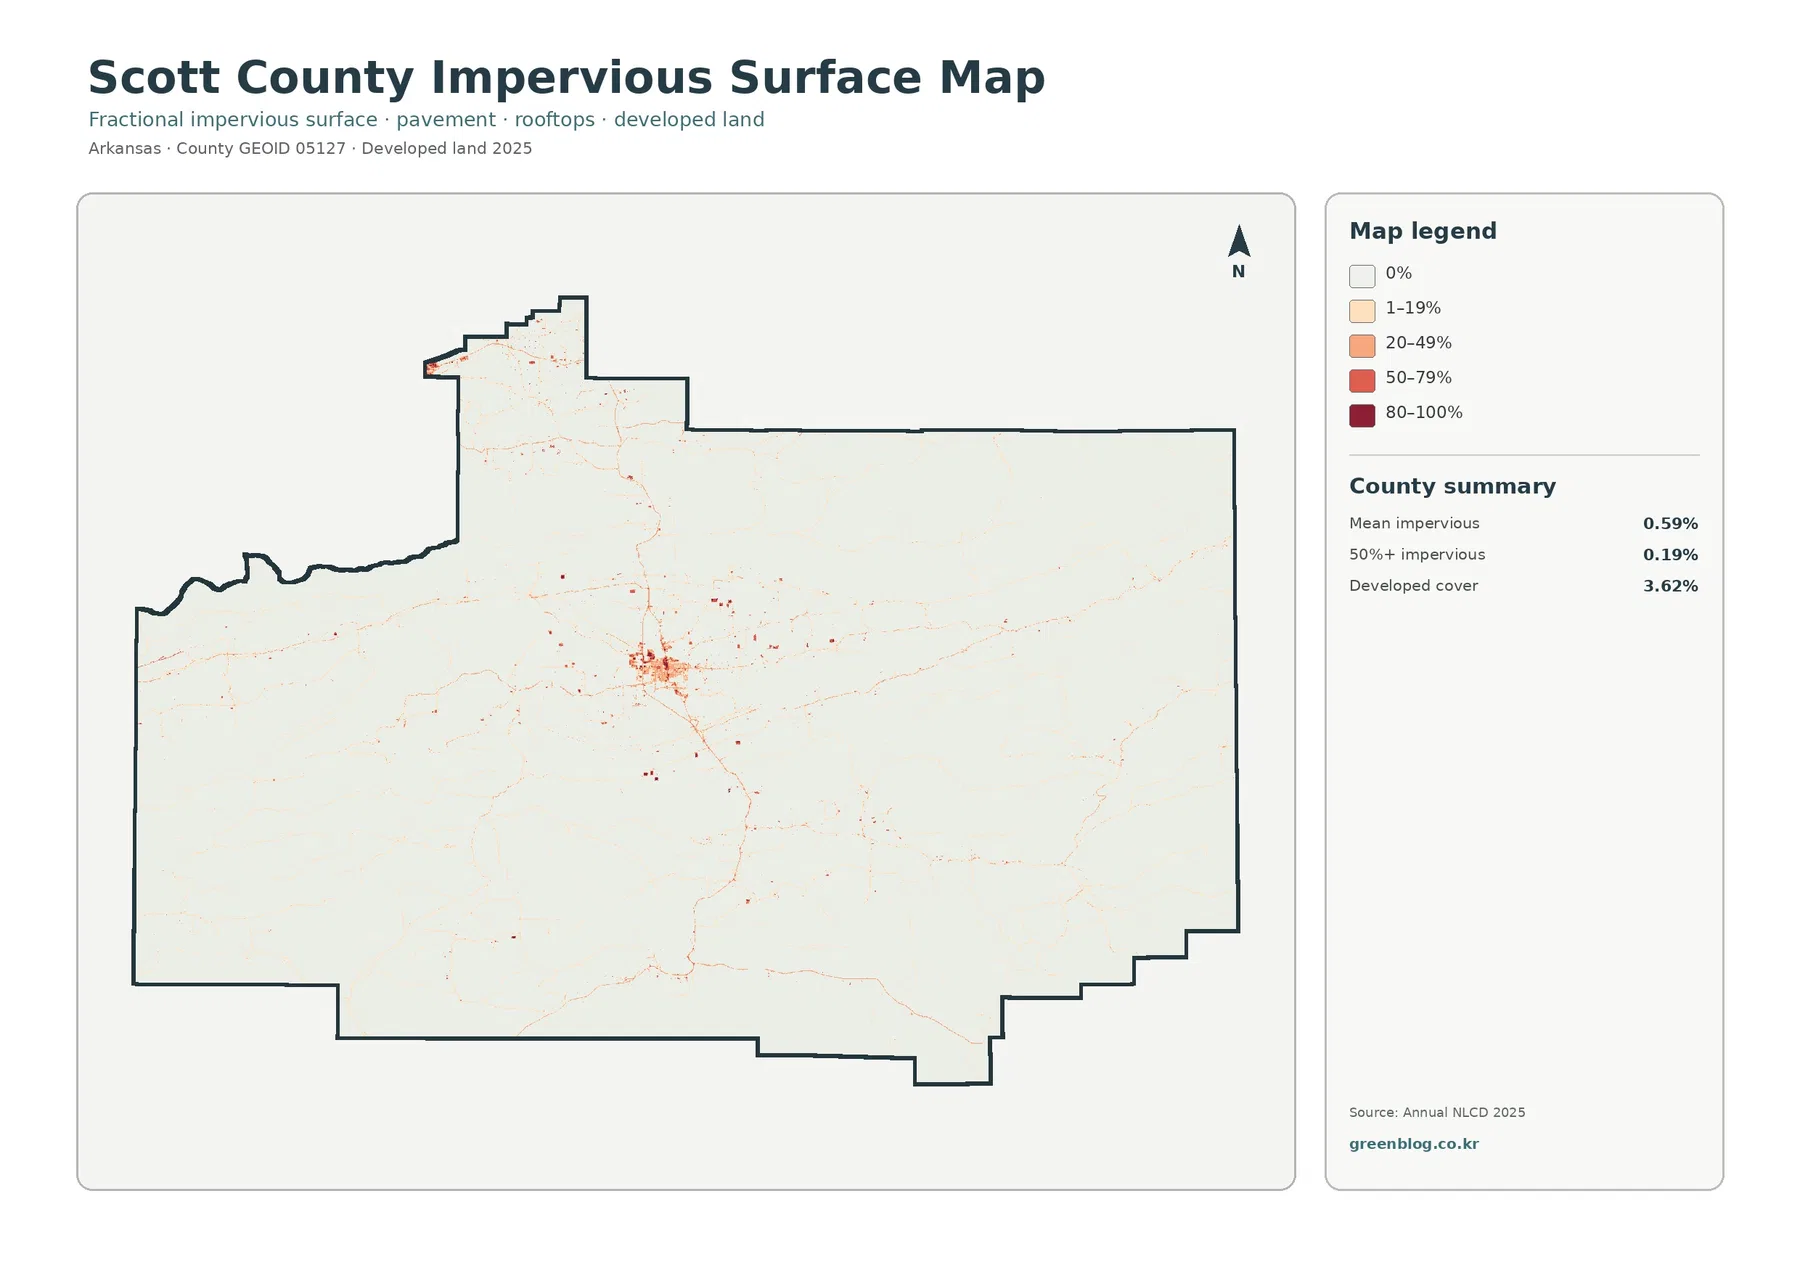
Waldron is a compact hard-surface center inside a county with very low impervious cover
Impervious surface measures hard ground such as pavement, rooftops, parking areas, and similar surfaces that allow little water to soak into the soil. Scott County’s mean impervious value is only 0.59%, and just 0.19% of the county is mapped at 50% or greater imperviousness. Those numbers are lower than the 3.62% developed-land share because a developed class can include lawns, trees, bare ground, and other permeable surfaces around buildings and roads. The two layers are related, but they are not measuring exactly the same thing.
The strongest impervious values form a compact cluster near the center of the county around Waldron, which the official county website identifies as the county seat. Thin, lighter lines extend from that core in several directions and smaller points appear elsewhere, but most of the county remains white or very lightly shaded. The contrast is useful because it separates the built surface of the main community from the much larger forested background. A visitor can see immediately that Scott County does not have a broad continuous urban footprint.
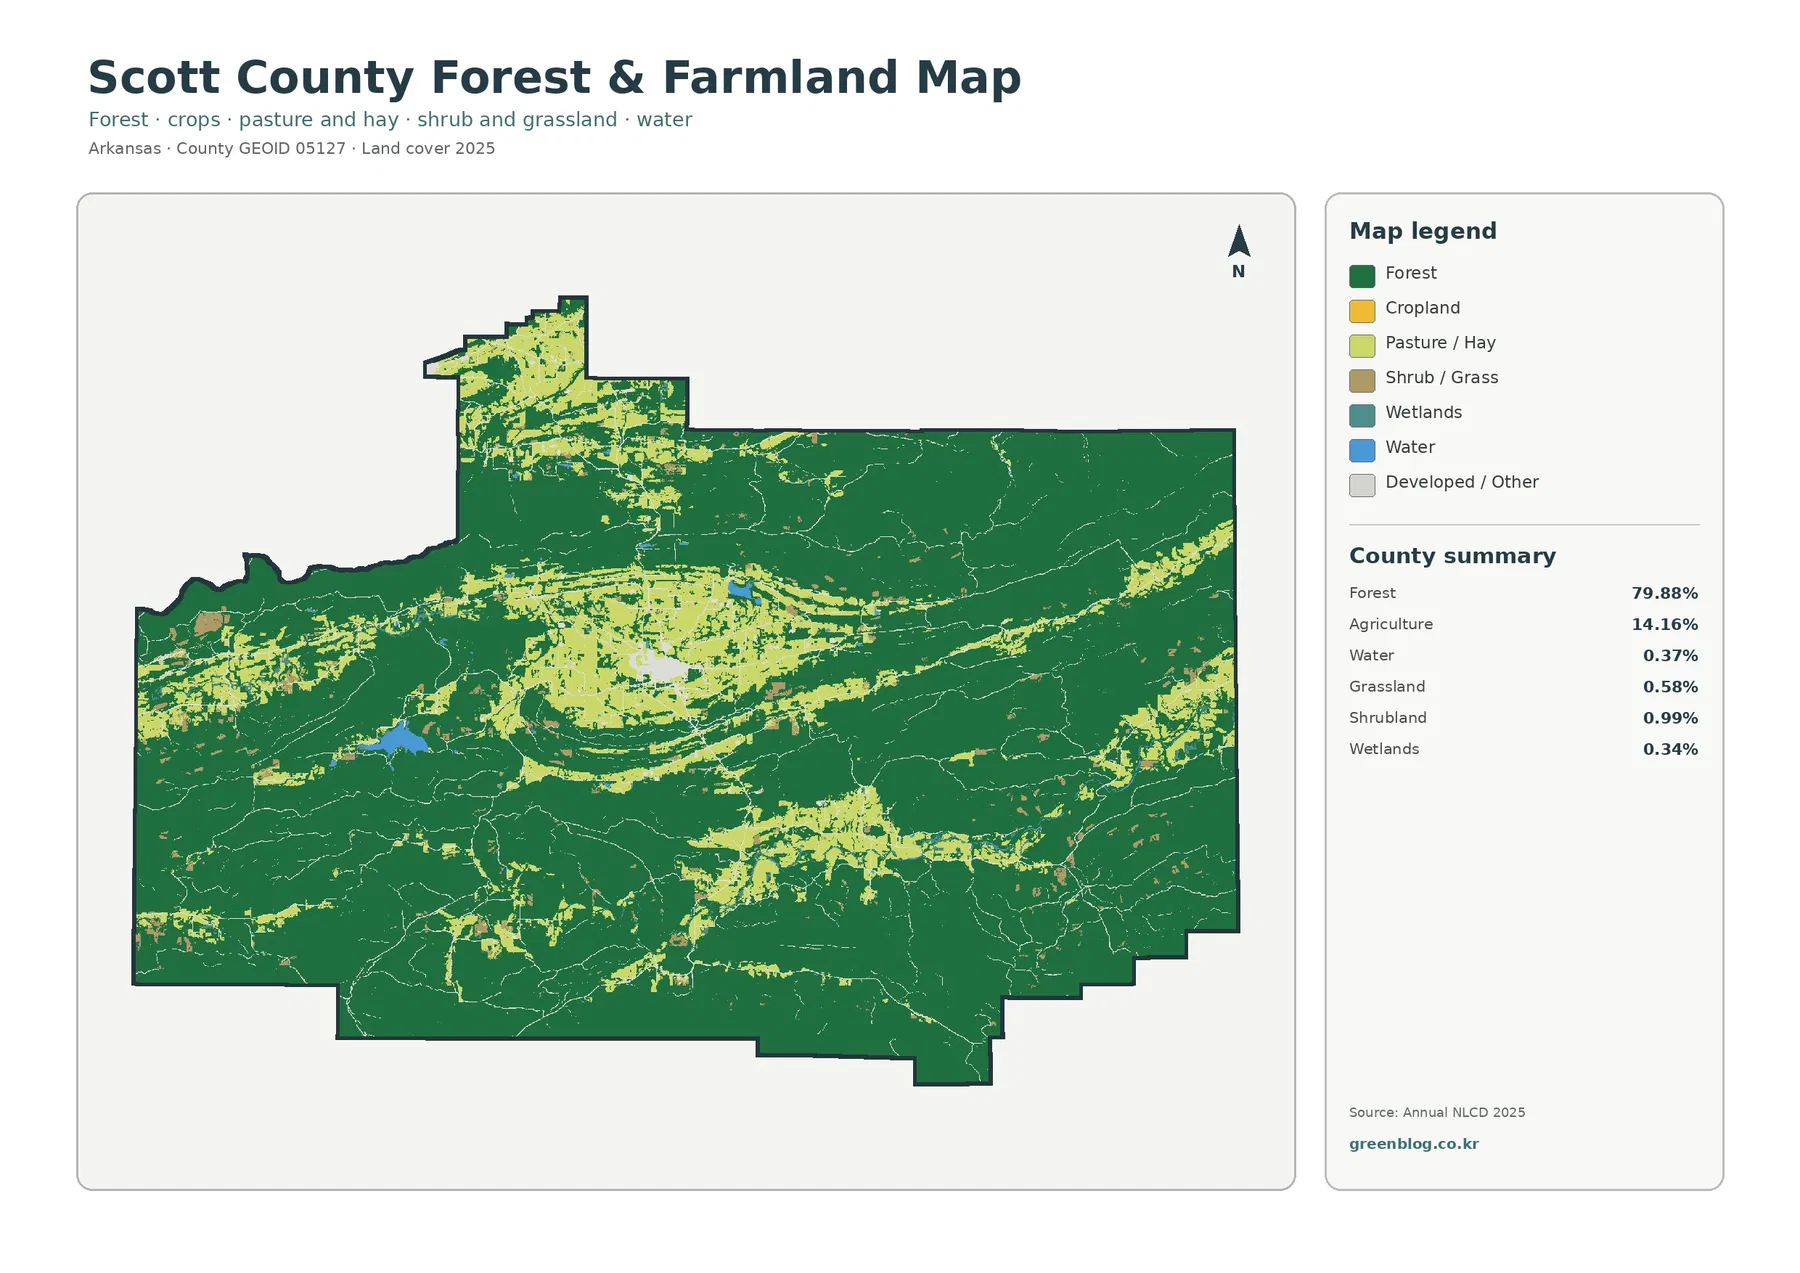
The forest-and-farmland map makes the county’s smaller open areas easier to read
The forest-and-farmland view removes some of the visual competition from developed classes and emphasizes forest, agriculture, pasture or hay, shrub and grass cover, wetlands, and water. Forest still dominates at 79.88%, but the 14.16% agricultural share becomes easier to trace across the middle of the county and into the northwest. Several broad open patches are surrounded by forest, creating a repeated edge between wooded cover and agricultural or pasture-like ground. That transition is one of the most distinctive patterns in this map set.
Open water covers 0.37% and wetlands 0.34% in the supplied 2025 summary. Scott County’s official site names Lake Hinkle, Lake Waldron, and Square Rock Lake among local water resources. Several blue patches are visible on the map, but the preview does not label them, so it would be unsafe to attach one of those names to a particular blue shape without a detailed reference map. The small percentages still matter because a lake or wetland can be locally important even when it occupies very little of the county’s total area.
The 1985–2025 comparison shows many small differences rather than one dominant conversion zone
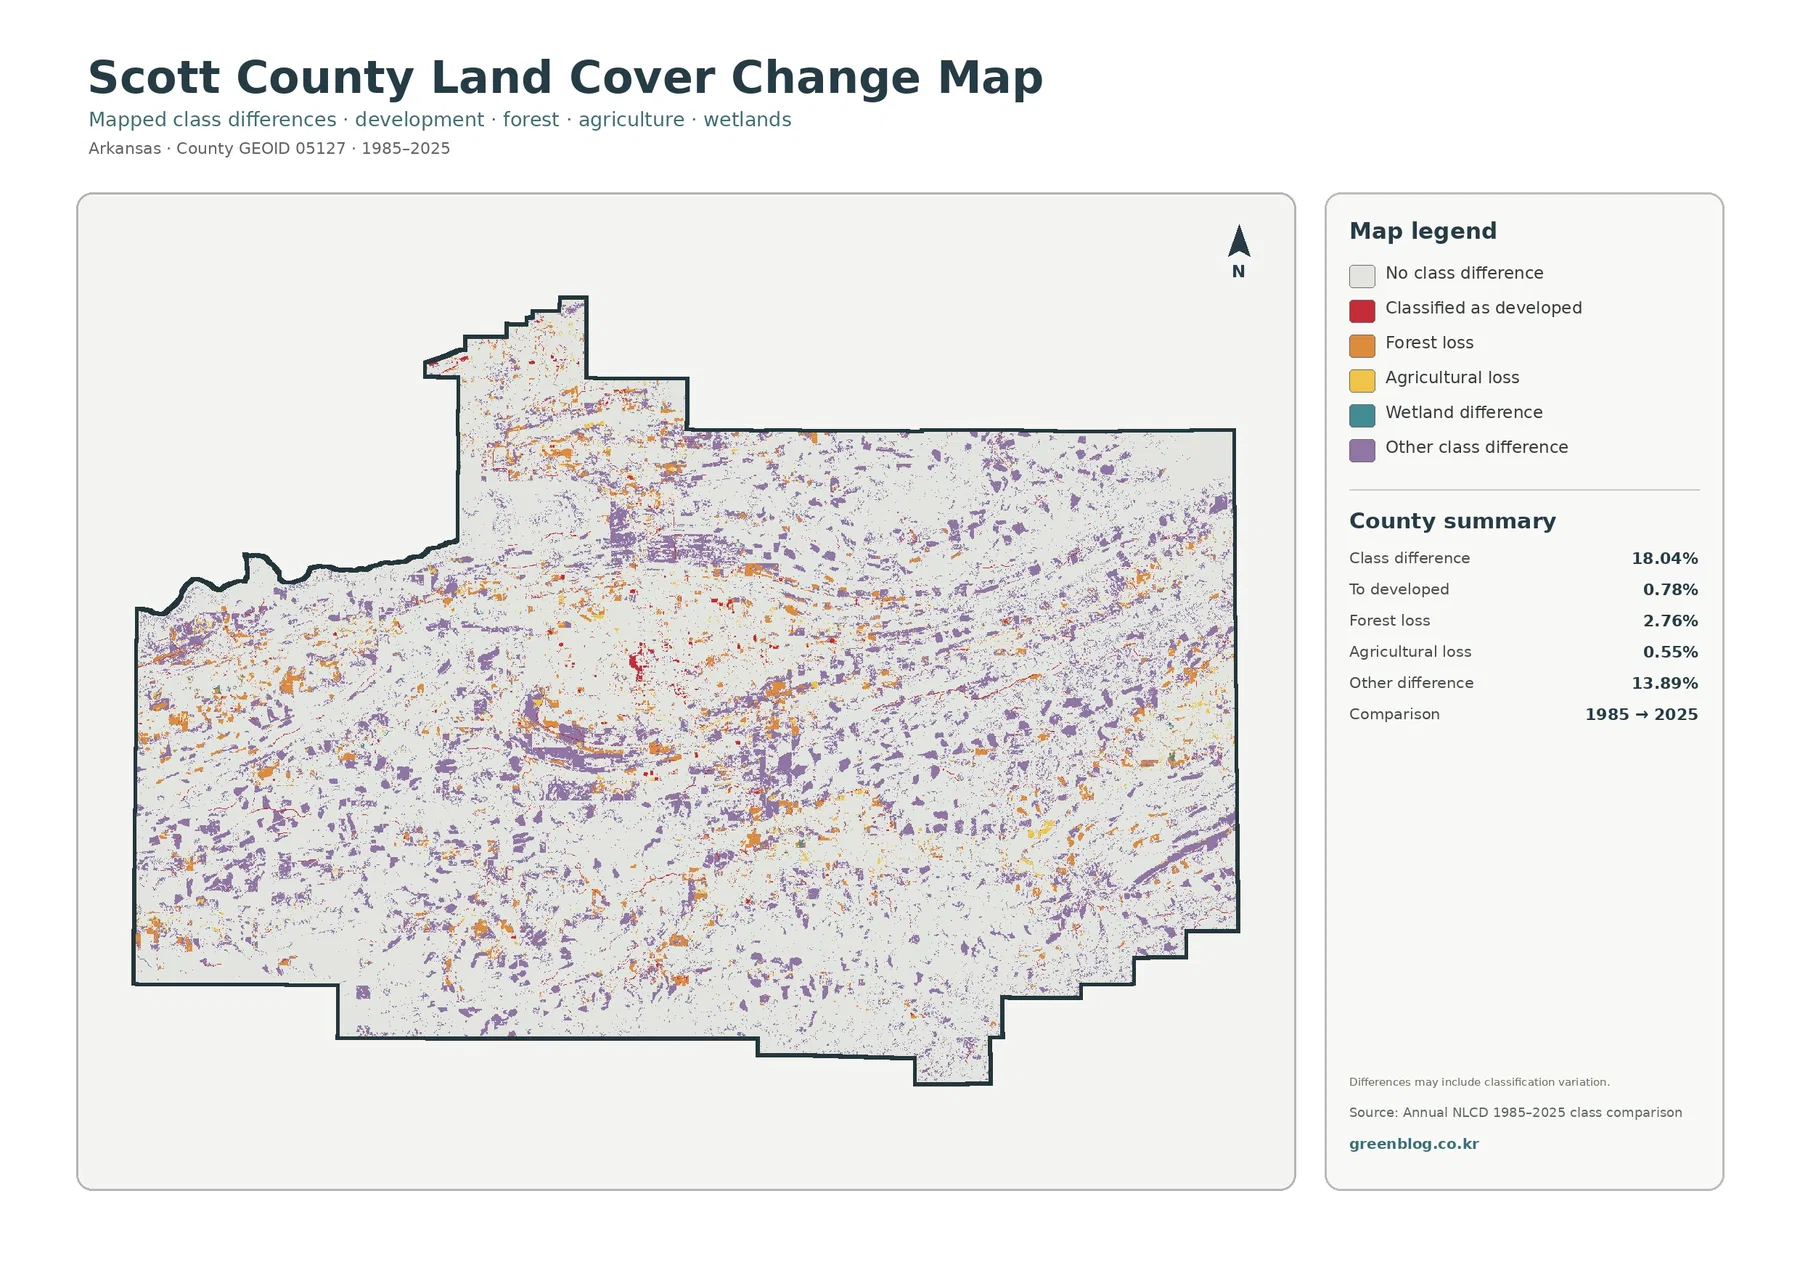
The change map compares broad land-cover classifications from 1985 and 2025. Its county summary reports a class difference across 18.04% of Scott County. Within that comparison, 0.78% is marked as classified to developed, 2.76% as forest loss, 0.55% as agricultural loss, and 13.89% as other class difference. Most of the county is still shown as having no class difference, but the colored cells are spread widely enough to appear in nearly every major part of the map.
Forest-loss colors appear as scattered patches inside the wooded west, center, north, and east rather than forming one large clearing. Red cells classified to developed are more noticeable around the Waldron area and along selected linear corridors, while agricultural-loss colors occur in smaller pockets around open-land zones. Purple “other difference” cells are the most widespread change category. Because that class accounts for 13.89%, a large portion of the colored map cannot be reduced to a simple story of forest clearing or urban expansion.
The source note on the map warns that differences may include classification variation. A cell can receive a different class because of actual surface change, but imagery dates, vegetation condition, moisture, mixed pixels, and classification methods can also affect the result. For that reason, 18.04% should not be read as “18.04% of Scott County definitely changed legal land use.” It is a screening layer that shows where the broad classes differ between the two comparison years. Confirming a particular timber harvest, new building, or agricultural conversion requires dated imagery or local records.
Choose the map by the question, then compare locations instead of percentages alone
Start with the general land-cover map when you need one image that summarizes the entire county. It provides the clearest view of the 79.88% forest share, the agricultural openings, the Waldron developed cluster, and the smaller water or wetland classes. Use the forest-and-farmland map when the main question is where open rural land interrupts the forest. The impervious map is better for built-surface intensity around Waldron and smaller settlement traces. The change map belongs last, because its colors are easier to interpret after the current 2025 pattern is already familiar.
Scale and classification limits are especially important for small roads, lakes, and forest edges
Annual NLCD is a generalized raster dataset commonly organized in 30-meter cells. That scale is appropriate for countywide patterns, but it cannot reproduce every narrow road, small building, field edge, stream, or shoreline. A single cell can contain trees, pavement, grass, and a structure at the same time and still receive one dominant land-cover classification. Scott County’s broad forest pattern is well suited to this type of overview, while its narrow developed corridors and small water features can be simplified.
Frequently Asked Questions
Why does Scott County look almost entirely forested even though agriculture covers 14.16%?
Forest is the dominant 2025 class at 79.88%, but agriculture is concentrated in several broad central and northwestern openings rather than spread evenly. Those open zones are visually noticeable because they form clear breaks inside the larger forest cover.
What does the 0.59% mean impervious value say about Waldron and the rest of the county?
It means hard surfaces such as pavement and rooftops make up a very small share of Scott County overall. The strongest impervious values cluster around Waldron, while most forest and agricultural areas remain very low. Only 0.19% of the county is mapped at 50% or greater imperviousness.
Does the 18.04% change value mean 18.04% of Scott County definitely changed land use?
No. It is the share of cells with a different broad class in the 1985–2025 comparison. The summary includes 2.76% forest loss and 13.89% other class difference, but classification variation and mixed pixels can also contribute, so parcel-level change requires other evidence.
Sources and reference material
- MRLC Annual NLCD Data – current and annual land-cover dataset reference
- USGS Annual NLCD Land Cover Classification – class definitions and interpretation
- U.S. Census Bureau TIGER/Line Shapefiles – Scott County boundary reference
- Scott County, Arkansas Official Website – Waldron, terrain, timber, and local lake context
- University of Arkansas Cooperative Extension – Scott County – local agriculture and community education context
Map File Information
The four original Scott County maps shown on this page are packaged in one ZIP file. The JPG files are larger than the in-page previews and are suitable for printing, classroom reference, presentation graphics, and side-by-side county comparisons.
- Included Files: Use only the versions confirmed in the article and supplied images
- File Type: Use the confirmed download contents
- Intended Use: Printing, education, presentations, and map-based projects
Related Maps
- A Craighead County Arkansas Land Cover Map
- Arkansas County Arkansas Land Cover Map
- Ashley County Arkansas Land Cover Map
Green Map creates custom-edited map images using open geographic data sources such as geoBoundaries, Natural Earth, OpenStreetMap, and government open data.
These maps are edited visual materials, not raw data files, and are provided for education, documents, presentations, and graphic reference.