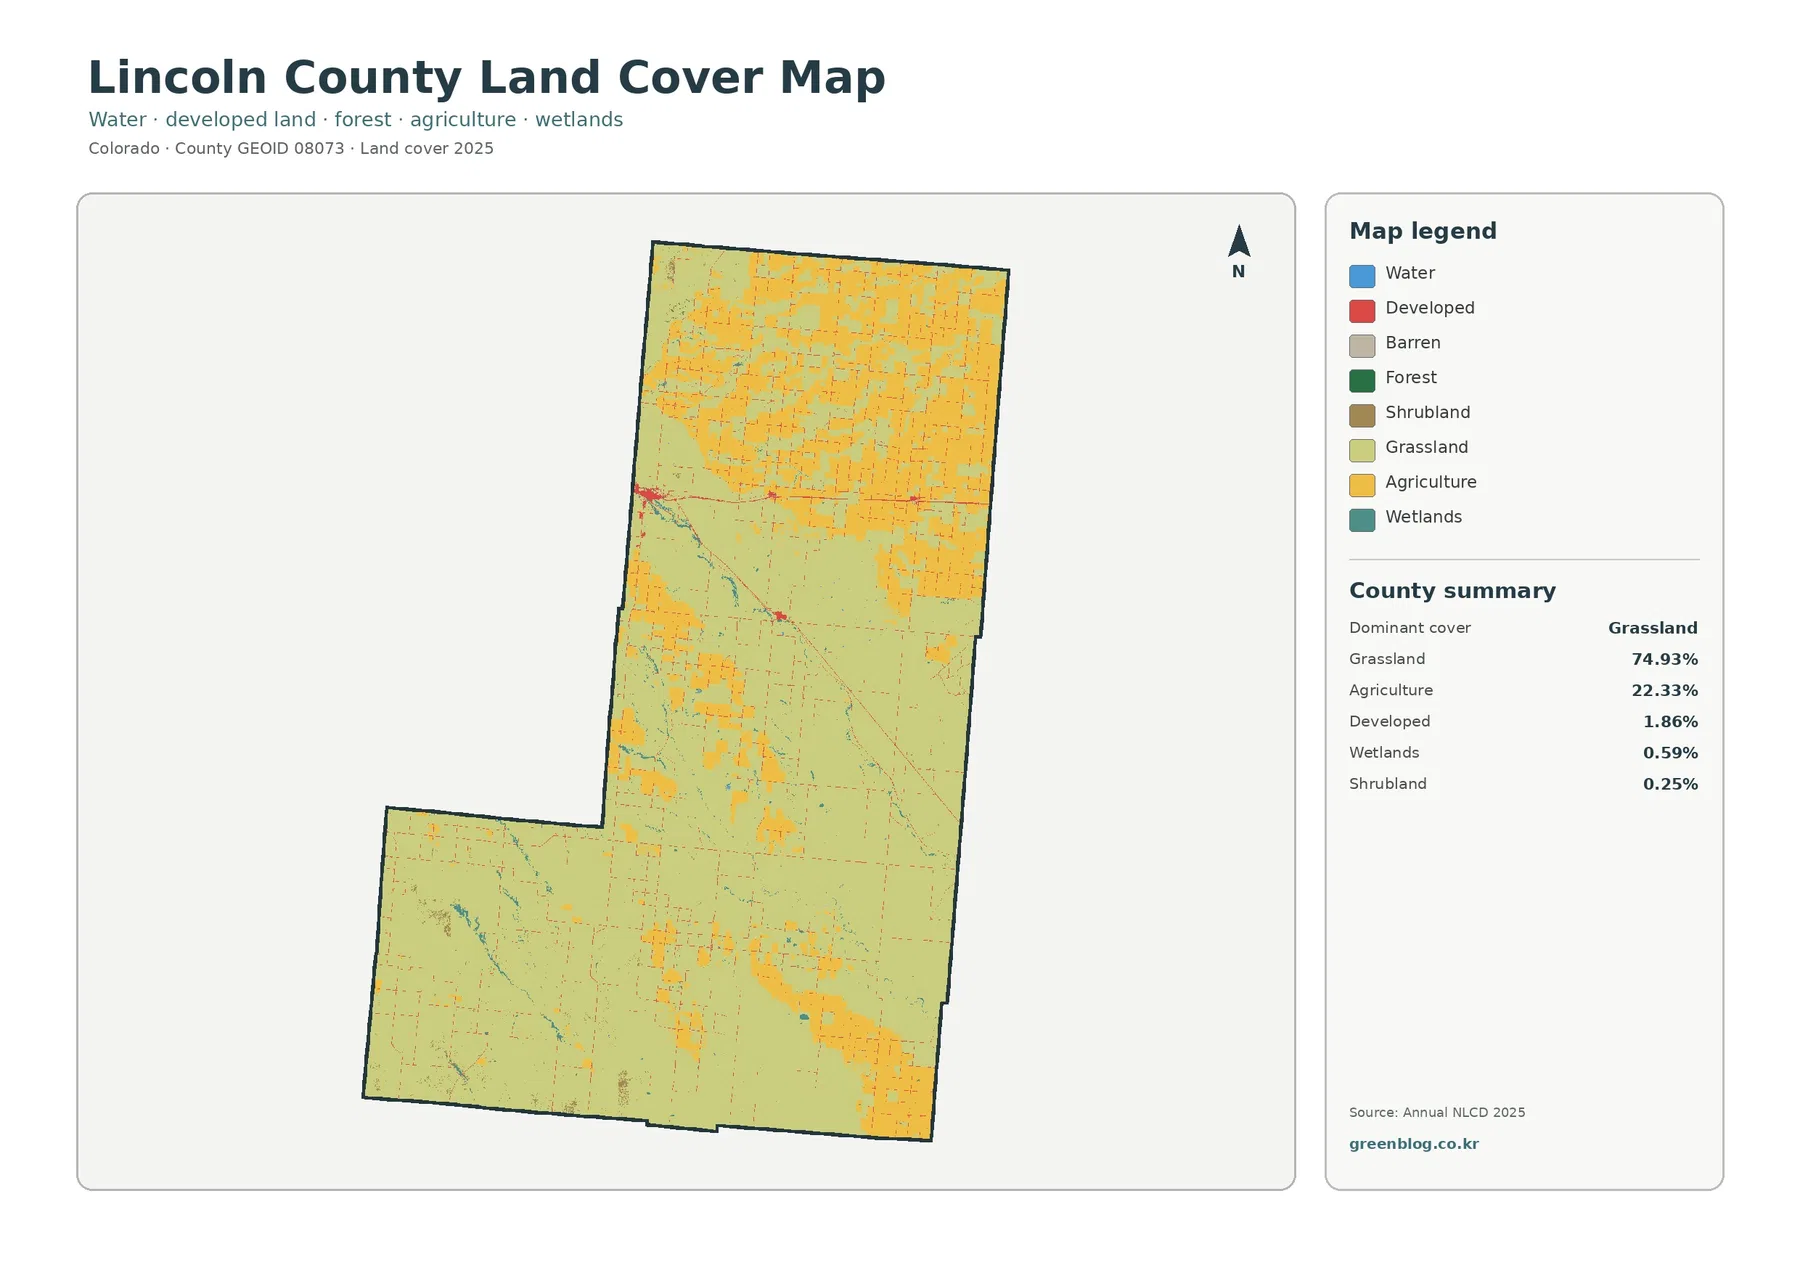
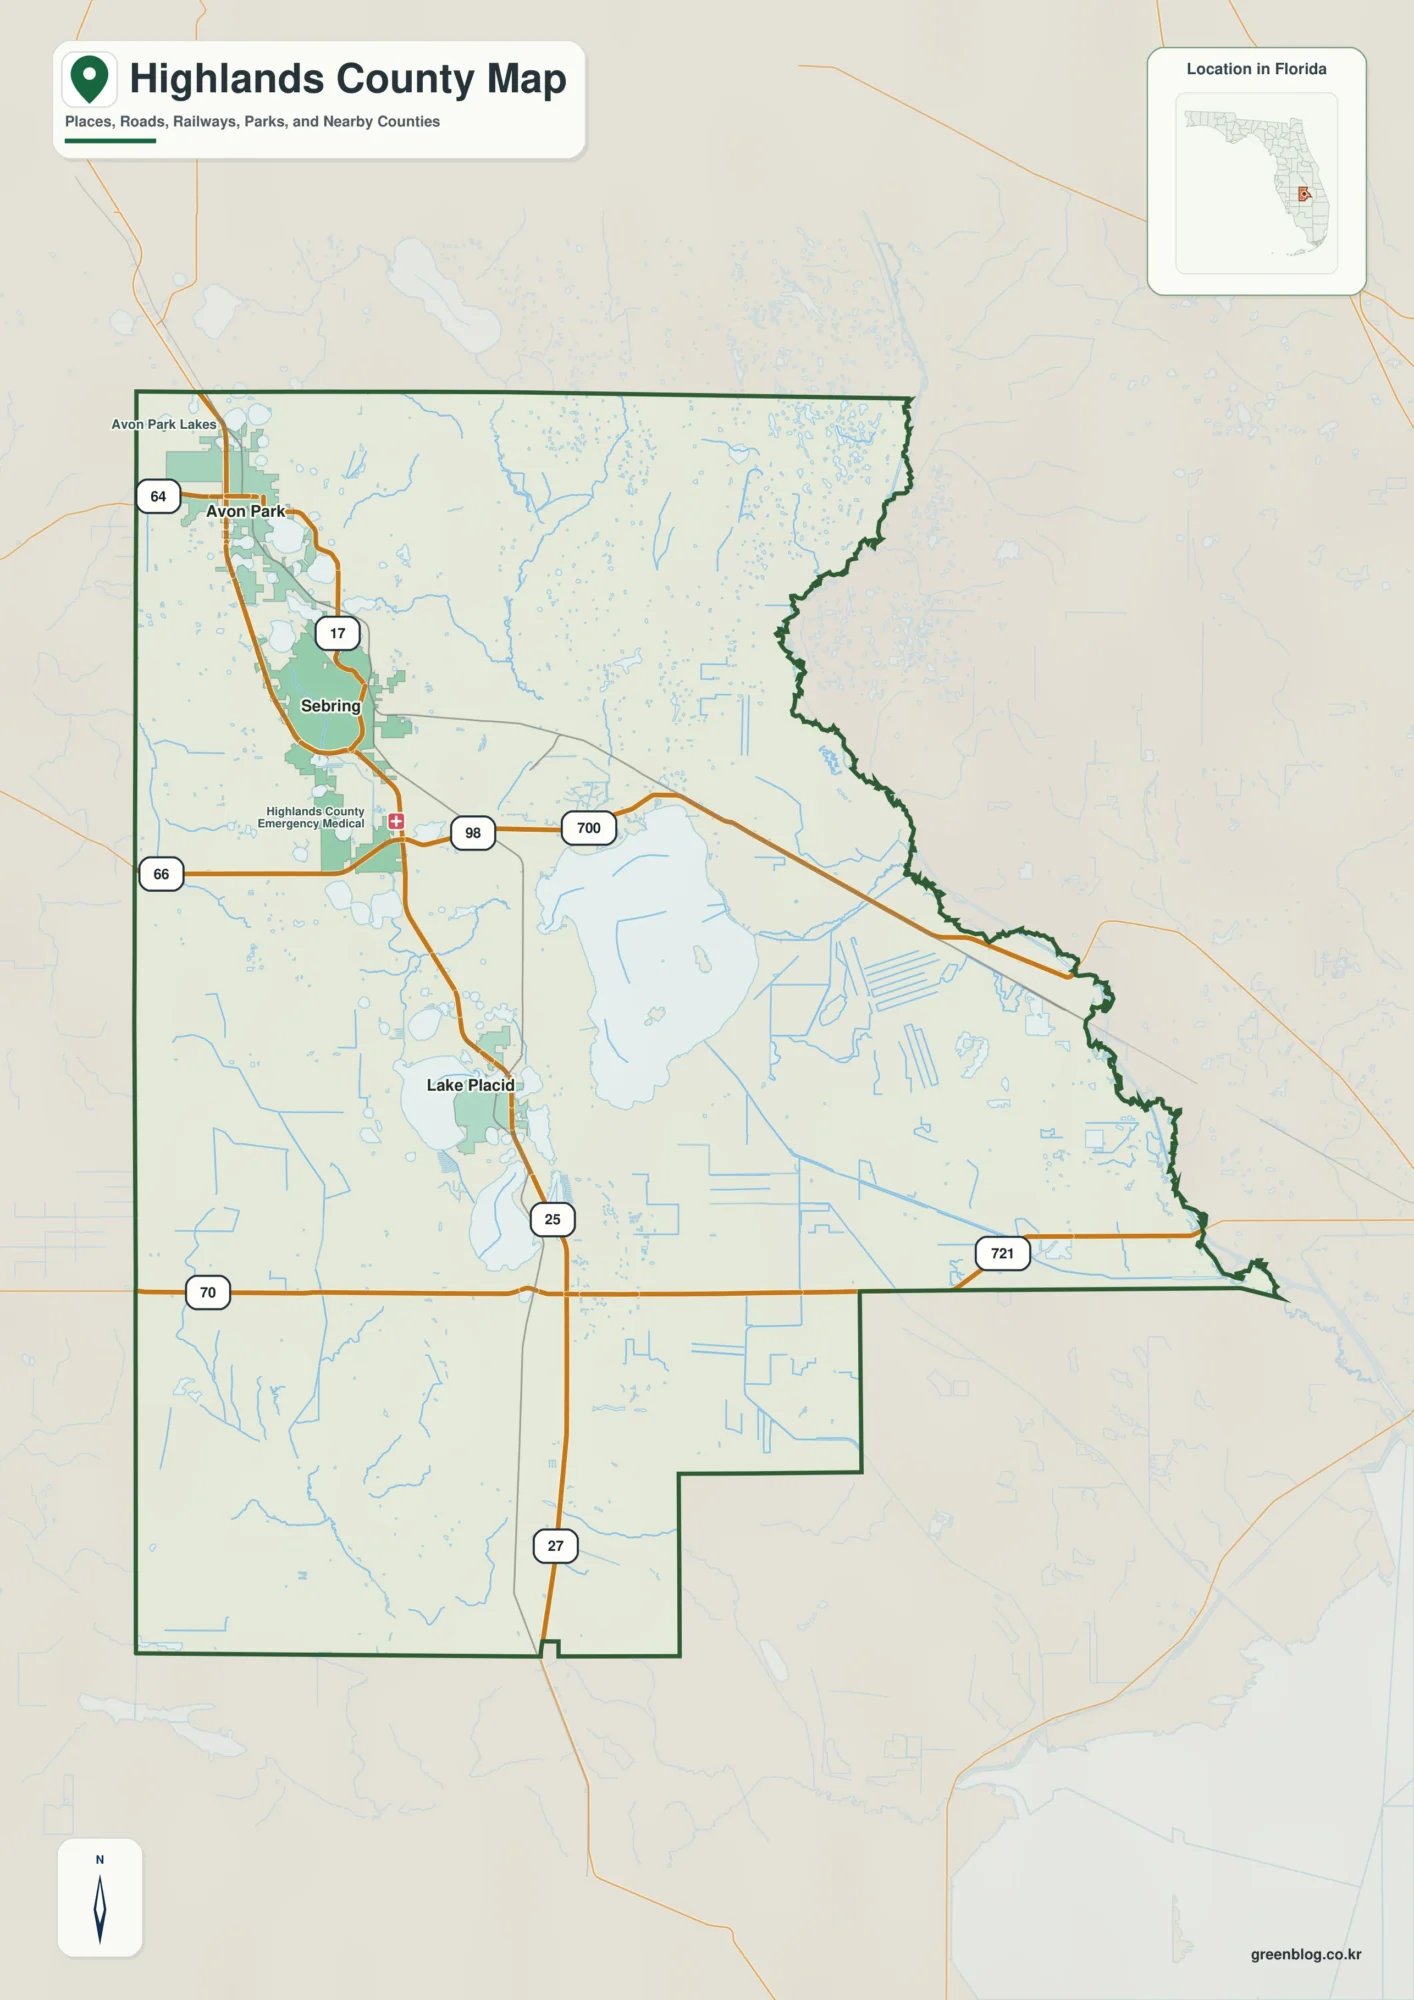
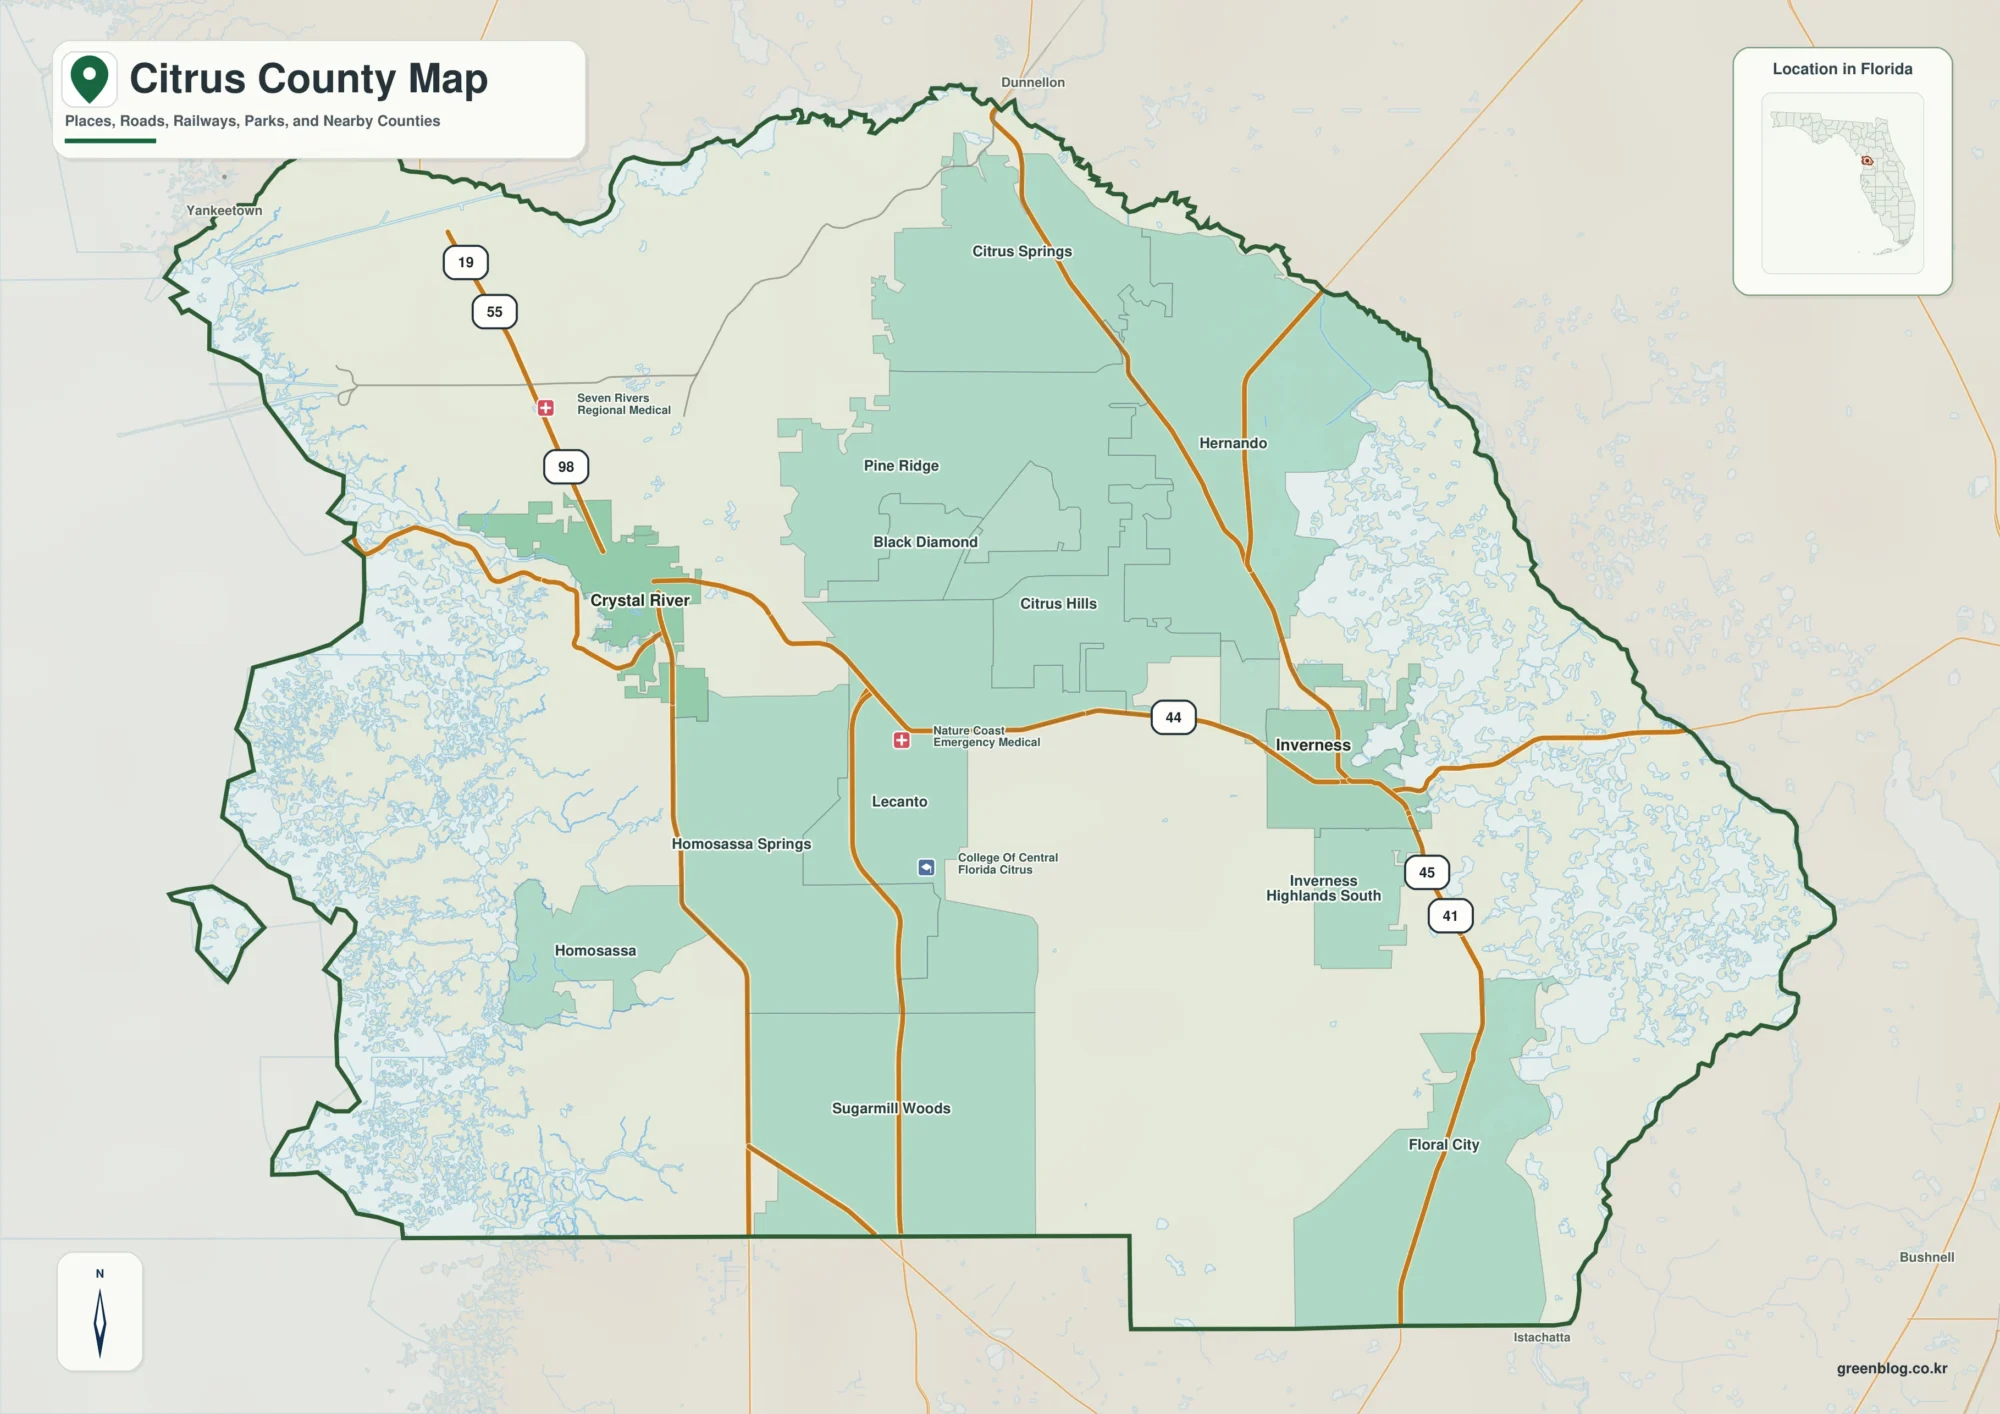
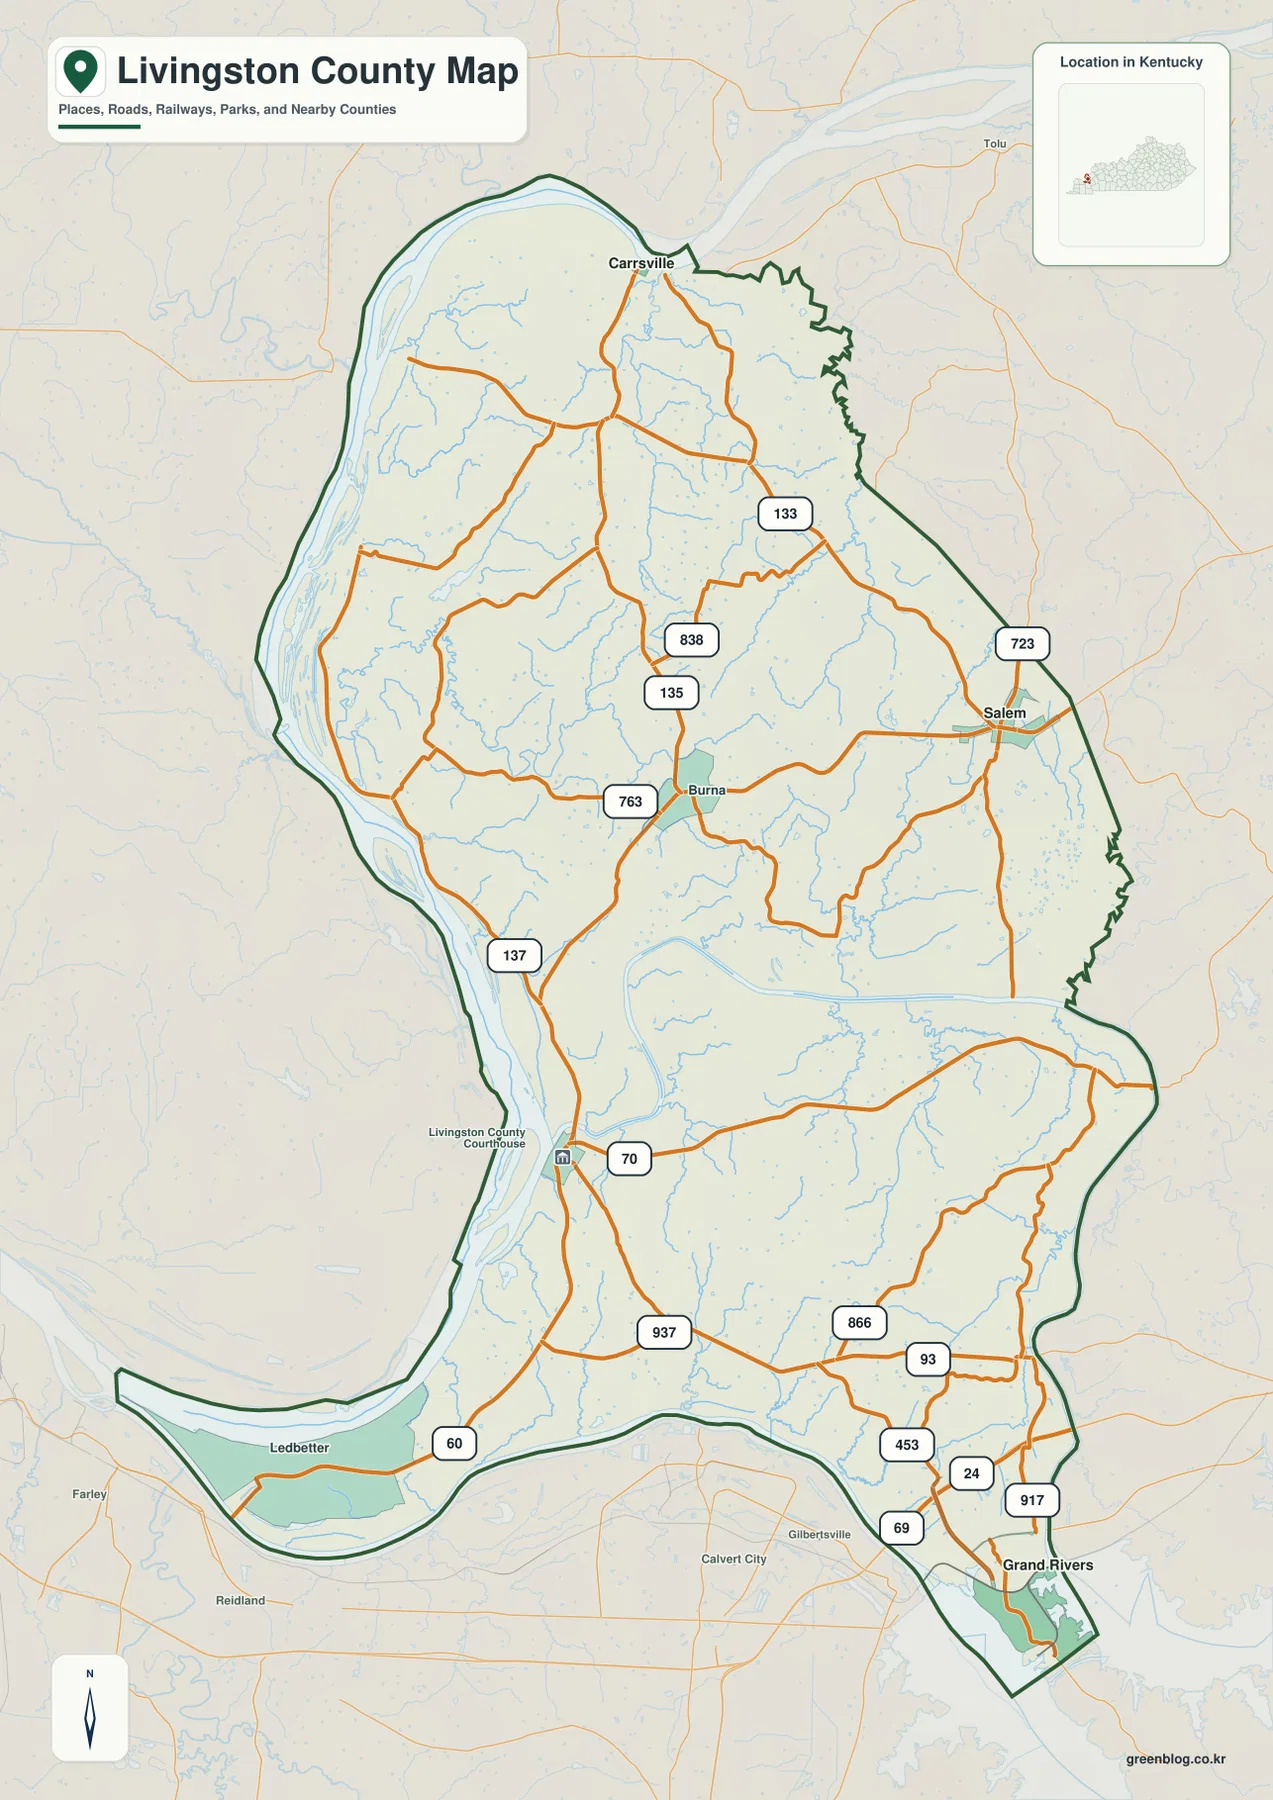
Ogle County is mostly farm country, but its land-cover pattern is not uniform. Broad agricultural blocks dominate the county while the Rock River carries a wooded corridor through the interior, and developed areas stand out around Rochelle in the southeast and along river towns such as Oregon and Byron. The 2025 summary reports 81.10% agriculture, 8.78% developed land, 8.09% forest, 0.78% wetlands, and 0.71% water.
The four maps on this page separate those patterns into different questions: overall land cover, forest versus farmland, fractional impervious surface, and mapped class differences between 1985 and 2025. The WebP images are page previews. Four original JPG maps at 2480×1754 pixels are available together in the download box farther down the page.
Table of Contents
A farm grid interrupted by the Rock River corridor
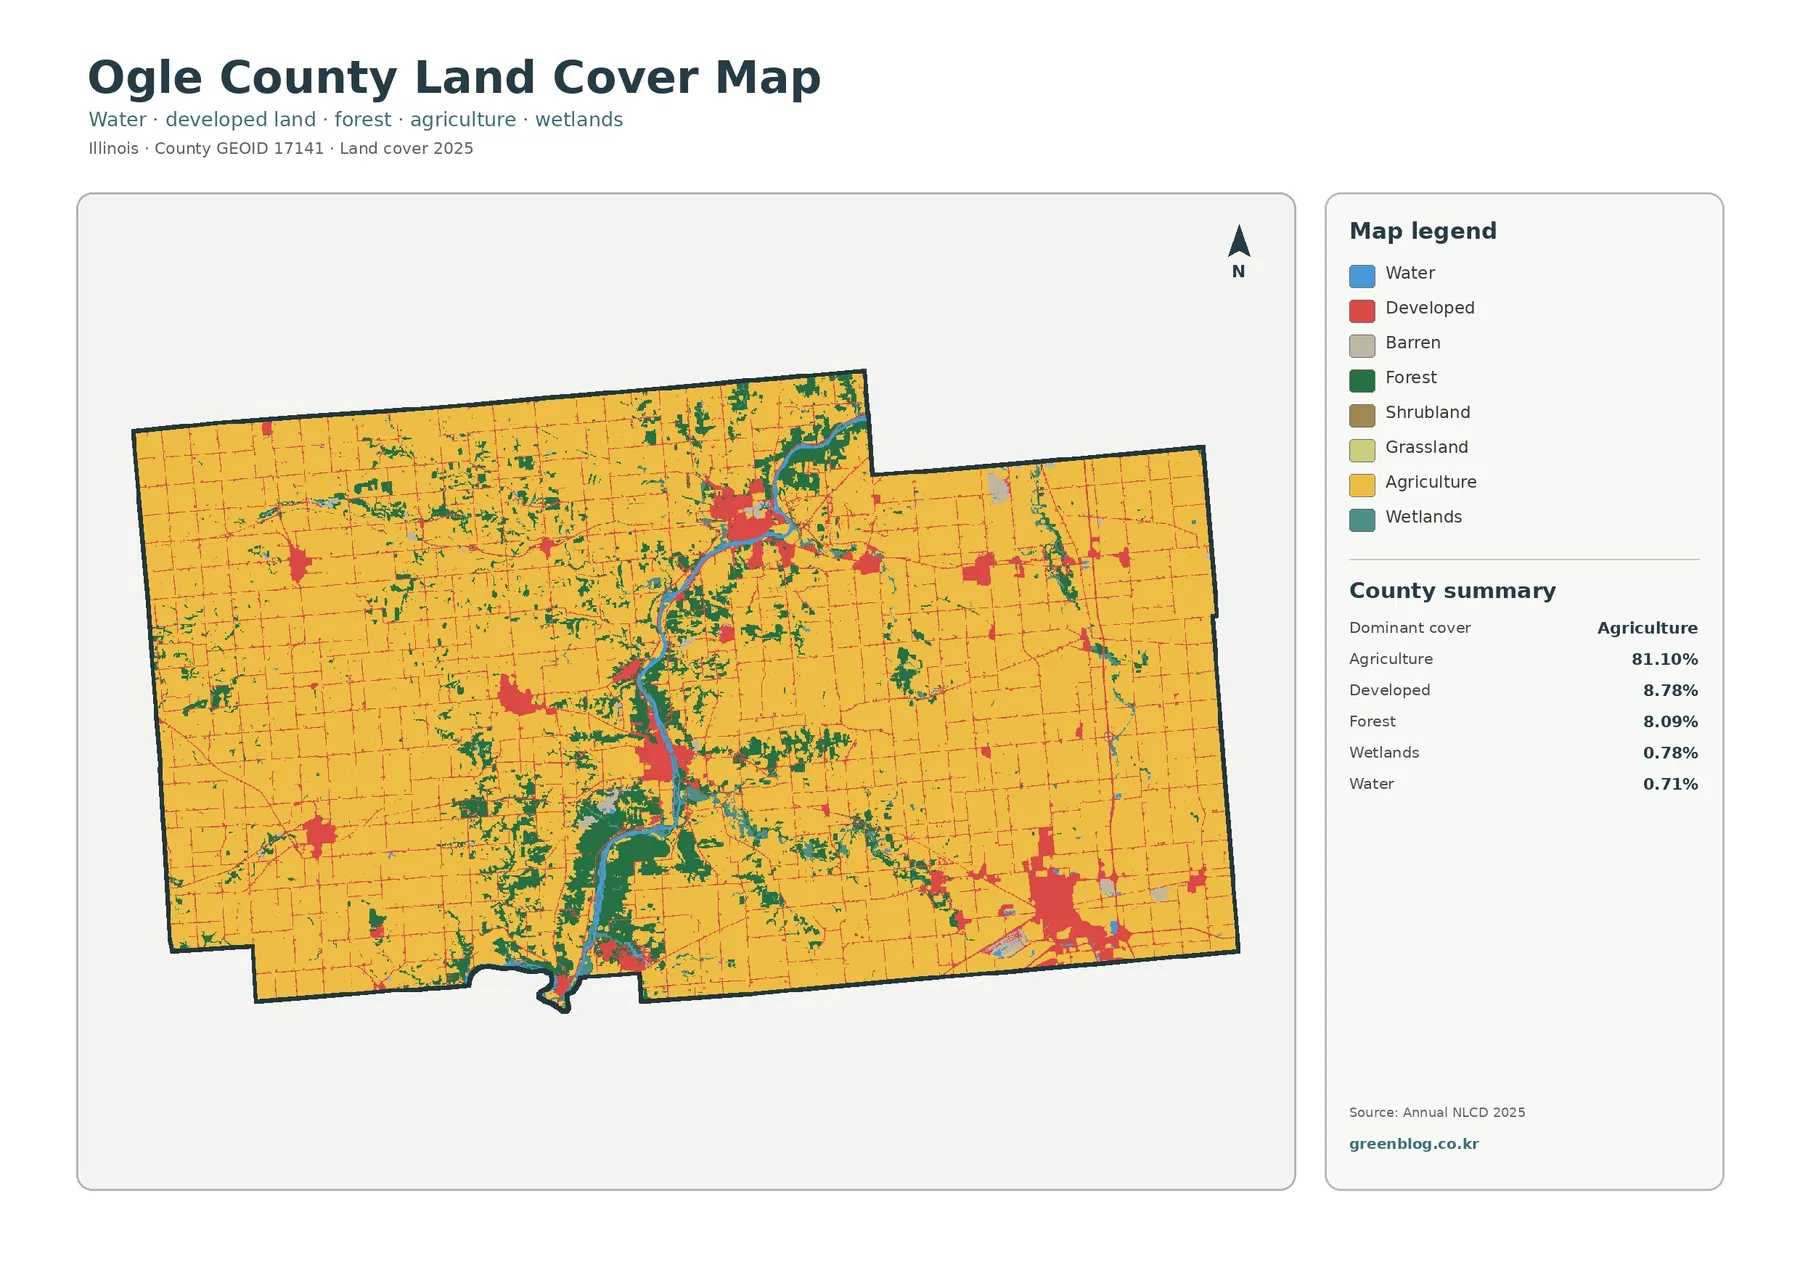
Yellow agriculture covers most of the map and forms especially large continuous areas in the east, northeast, northwest, and southeast. That visual dominance matches the 81.10% county summary. Fine developed lines cross the farm areas in a regular road pattern, but the center of the county looks very different. There, the Rock River and its associated forest break the field grid into a longer, more irregular north-to-south feature.
Forest accounts for 8.09% of Ogle County, close to the developed share but arranged in a very different way. Developed land appears as compact town clusters and thin road lines. Forest is more continuous around the river and its tributary-like branches, particularly in the central and south-central part of the county. Smaller woodland pieces occur elsewhere, yet they do not form the same broad connected band seen near the Rock River.
That pattern has a clear local context. Illinois DNR describes Castle Rock State Park, three miles south of Oregon, as a Rock River Hills landscape with rolling topography, ravines, sandstone features, and distinctive forest communities. Lowden-Miller State Forest, also south of Oregon, includes wooded river frontage and high bluffs along the Rock River Valley. These references help explain why the map shows a stronger forest presence through the county interior, although the land-cover colors should not be treated as park or preserve boundaries.
Developed land is scattered among several communities instead of forming one continuous urban belt. The largest southeastern cluster corresponds to Rochelle. A central cluster along the Rock River aligns with Oregon, while another strong cluster farther north follows the Byron area. Smaller developed centers appear toward the west around places such as Mount Morris and Polo. Between those towns, most of the county returns quickly to agricultural cover.
Forest becomes easier to follow when developed land is muted
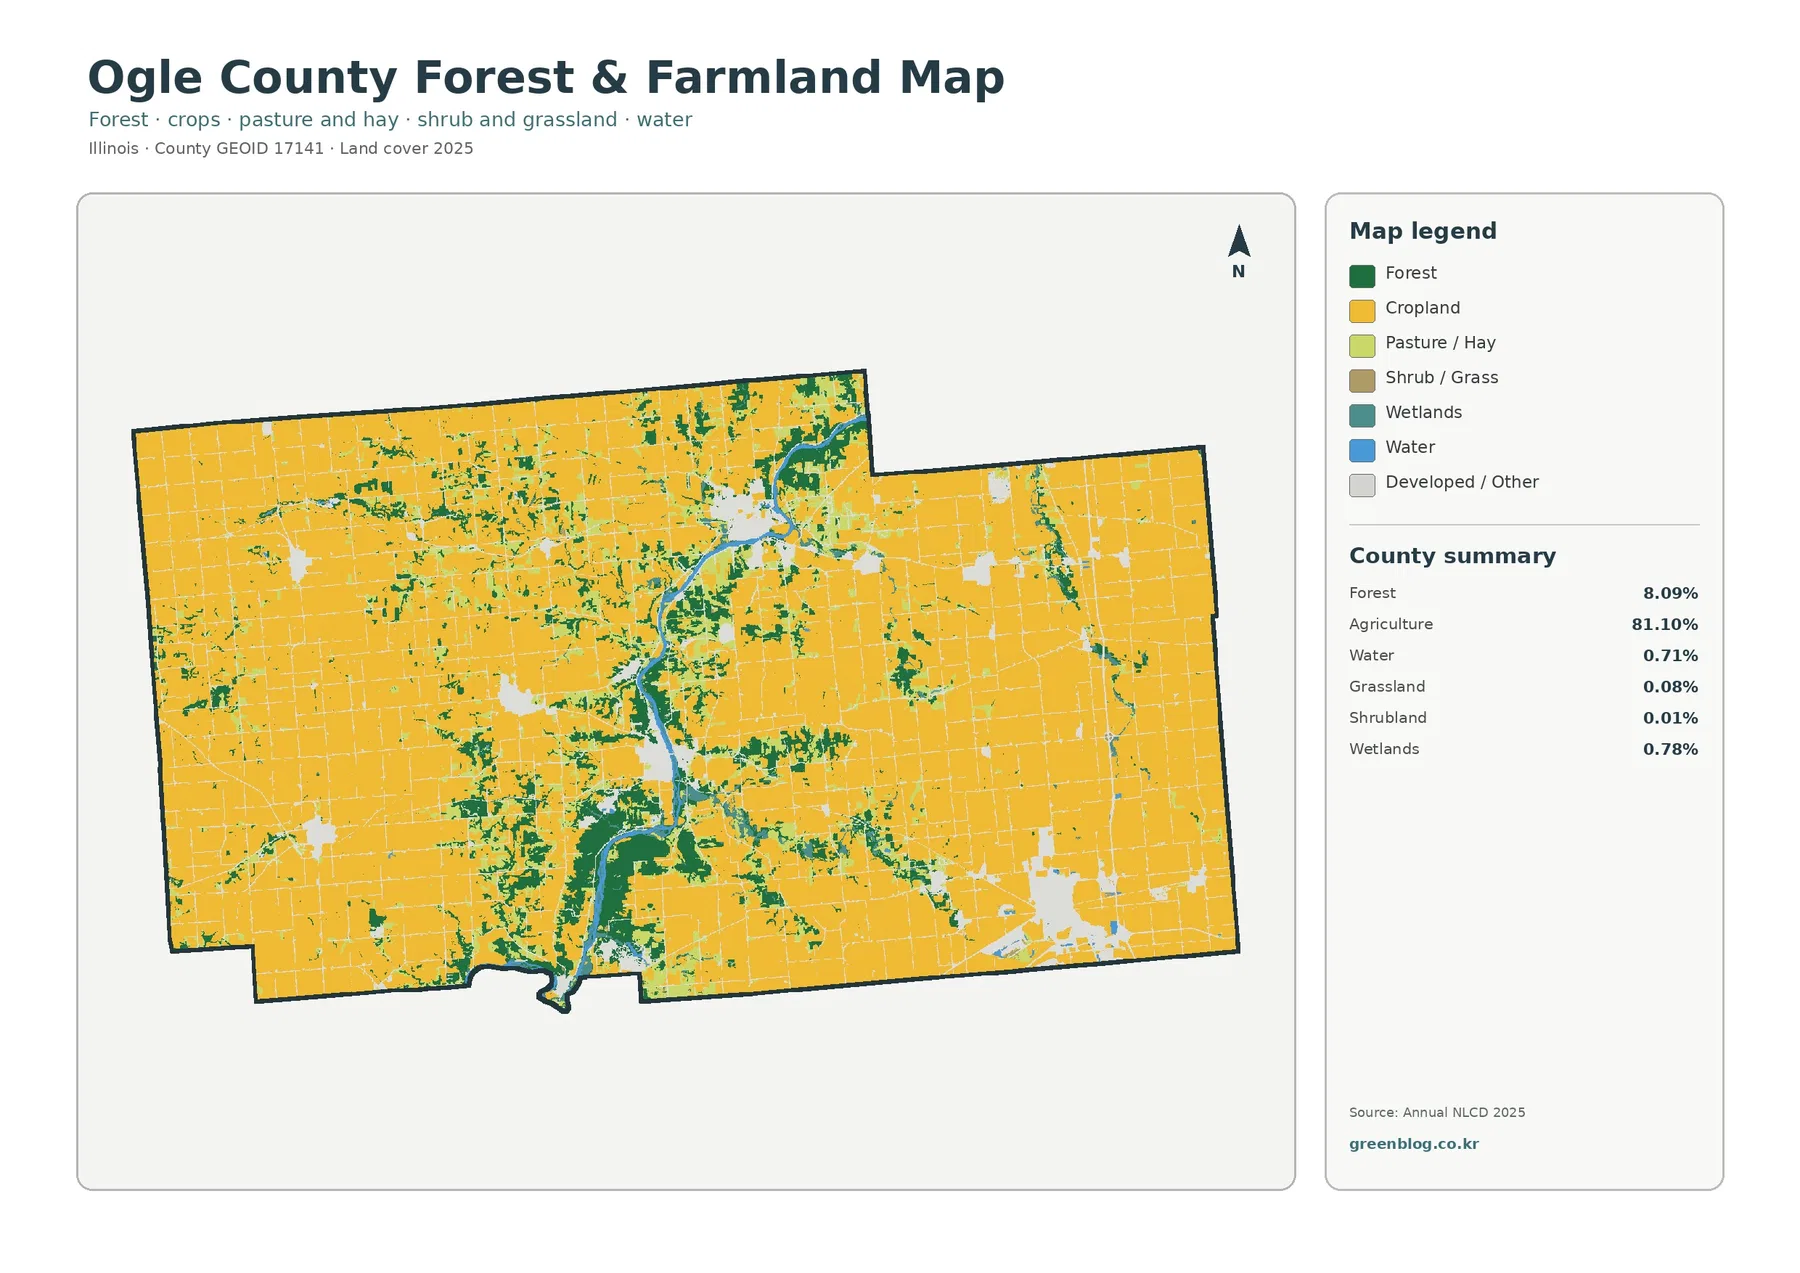
The forest-and-farmland view simplifies the developed areas so that the county’s agricultural and natural cover can be compared more directly. Agriculture still fills 81.10% of the county, but the green corridor through the middle becomes much more prominent because urban colors no longer compete for attention. From the north-central area toward Oregon and south of the city, woodland follows the river and nearby drainage features in a pattern that is much wider than the scattered forest patches in the outer farm areas.
The map also shows why a countywide percentage cannot tell the whole story. Water is only 0.71% and wetlands 0.78%, yet both are concentrated in recognizable places instead of being spread evenly. Blue and teal cells gather along the river and low-lying water features, often next to forest. In the eastern farm blocks, those classes are sparse, so the landscape appears much more uniform.
Agriculture is not just a map classification in Ogle County; it is also a major part of the county’s working landscape. The USDA 2022 Census of Agriculture reports 351,824 acres of land in farms, including 325,320 acres of cropland. Those figures are not equivalent to the NLCD agriculture percentage because the two datasets use different definitions and methods. They are useful as background, however, because both sources point to a county where cultivated land occupies a very large share of the landscape.
Small grassland and shrub categories appear in the legend but do not shape the countywide pattern the way agriculture and forest do. They are better treated as secondary classes along field edges or mixed areas rather than promoted into major themes. For a presentation, the stronger story is the contrast between broad farm blocks and the wooded river corridor, with water and wetlands adding detail where the two meet.
Rochelle stands out when the map measures hard surface
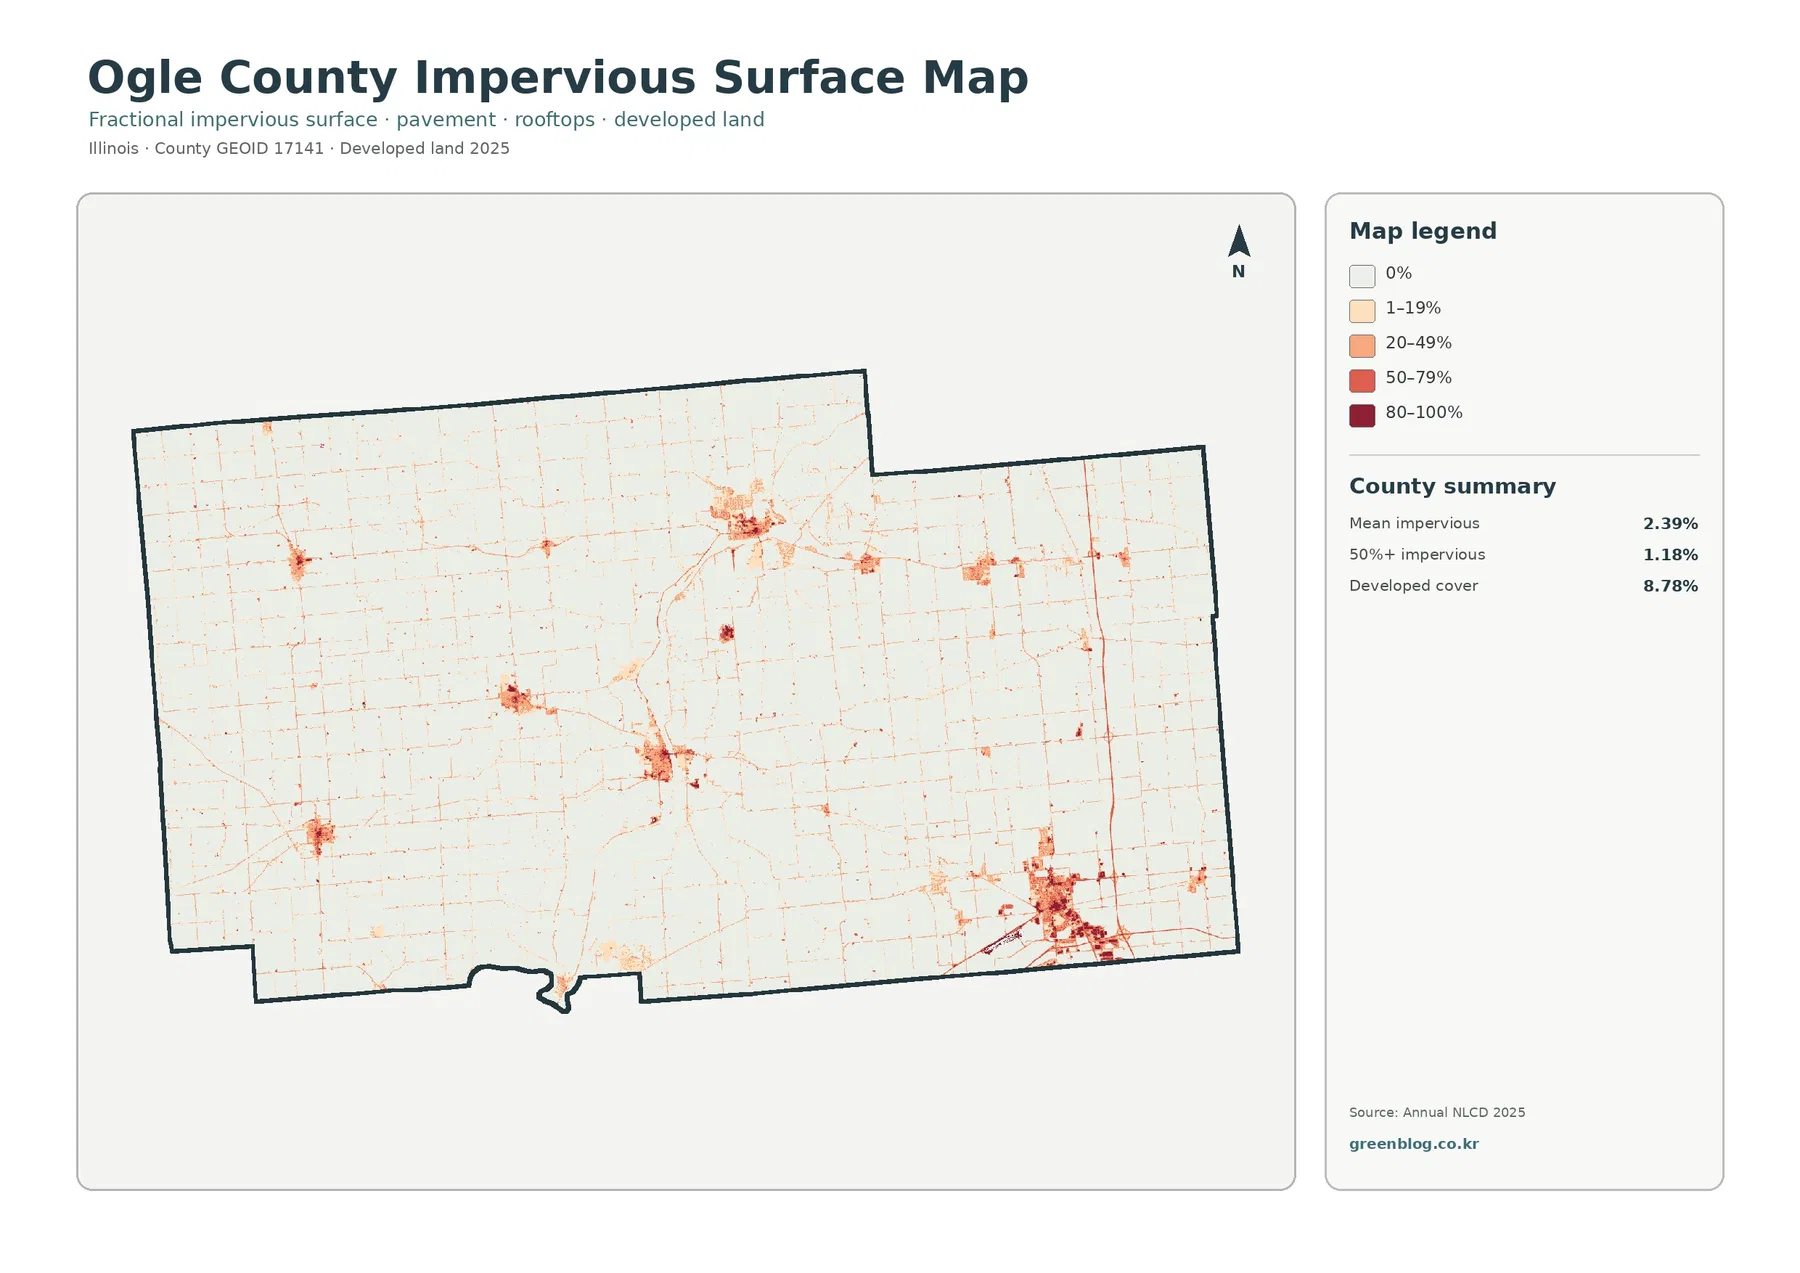
Impervious surface means pavement, rooftops, parking areas, and other hard cover that limits direct infiltration into the ground. Ogle County has a mean impervious value of 2.39%, while 1.18% of the county falls in cells with at least 50% impervious cover. Those numbers should not be substituted for the 8.78% developed-land share. A developed land-cover class can include lawns, trees, and other permeable surfaces, whereas the impervious layer estimates the fraction that is actually hard surface.
Rochelle is the strongest cluster in the southeast. The general land-cover map already identifies a large developed area there, but the impervious view separates its denser streets, buildings, and paved surfaces from the surrounding farm landscape. Rochelle is known for its location near the I-39 and I-88 junction, and the map shows several linear corridors reaching into the urban cluster. Because road names are not printed on the image, a transportation map is still needed for exact route identification.
Oregon and Byron create a different pattern along the Rock River. Both appear as concentrated impervious areas within a largely rural interior, and narrow road lines link them to surrounding communities. Smaller western centers can also be distinguished from the field grid. The result is a county where hard surface is locally intense but occupies only a small share of the total area.
The impervious map is useful for comparing built surface, but it is not a flood map, drainage model, or zoning map. High imperviousness can matter for runoff, yet actual water problems depend on rainfall, slope, soils, drainage infrastructure, and nearby streams. The layer also says nothing about parcel ownership or development rights. Those questions require county GIS, property, planning, and engineering information.
The 8.26% change figure contains several different kinds of difference
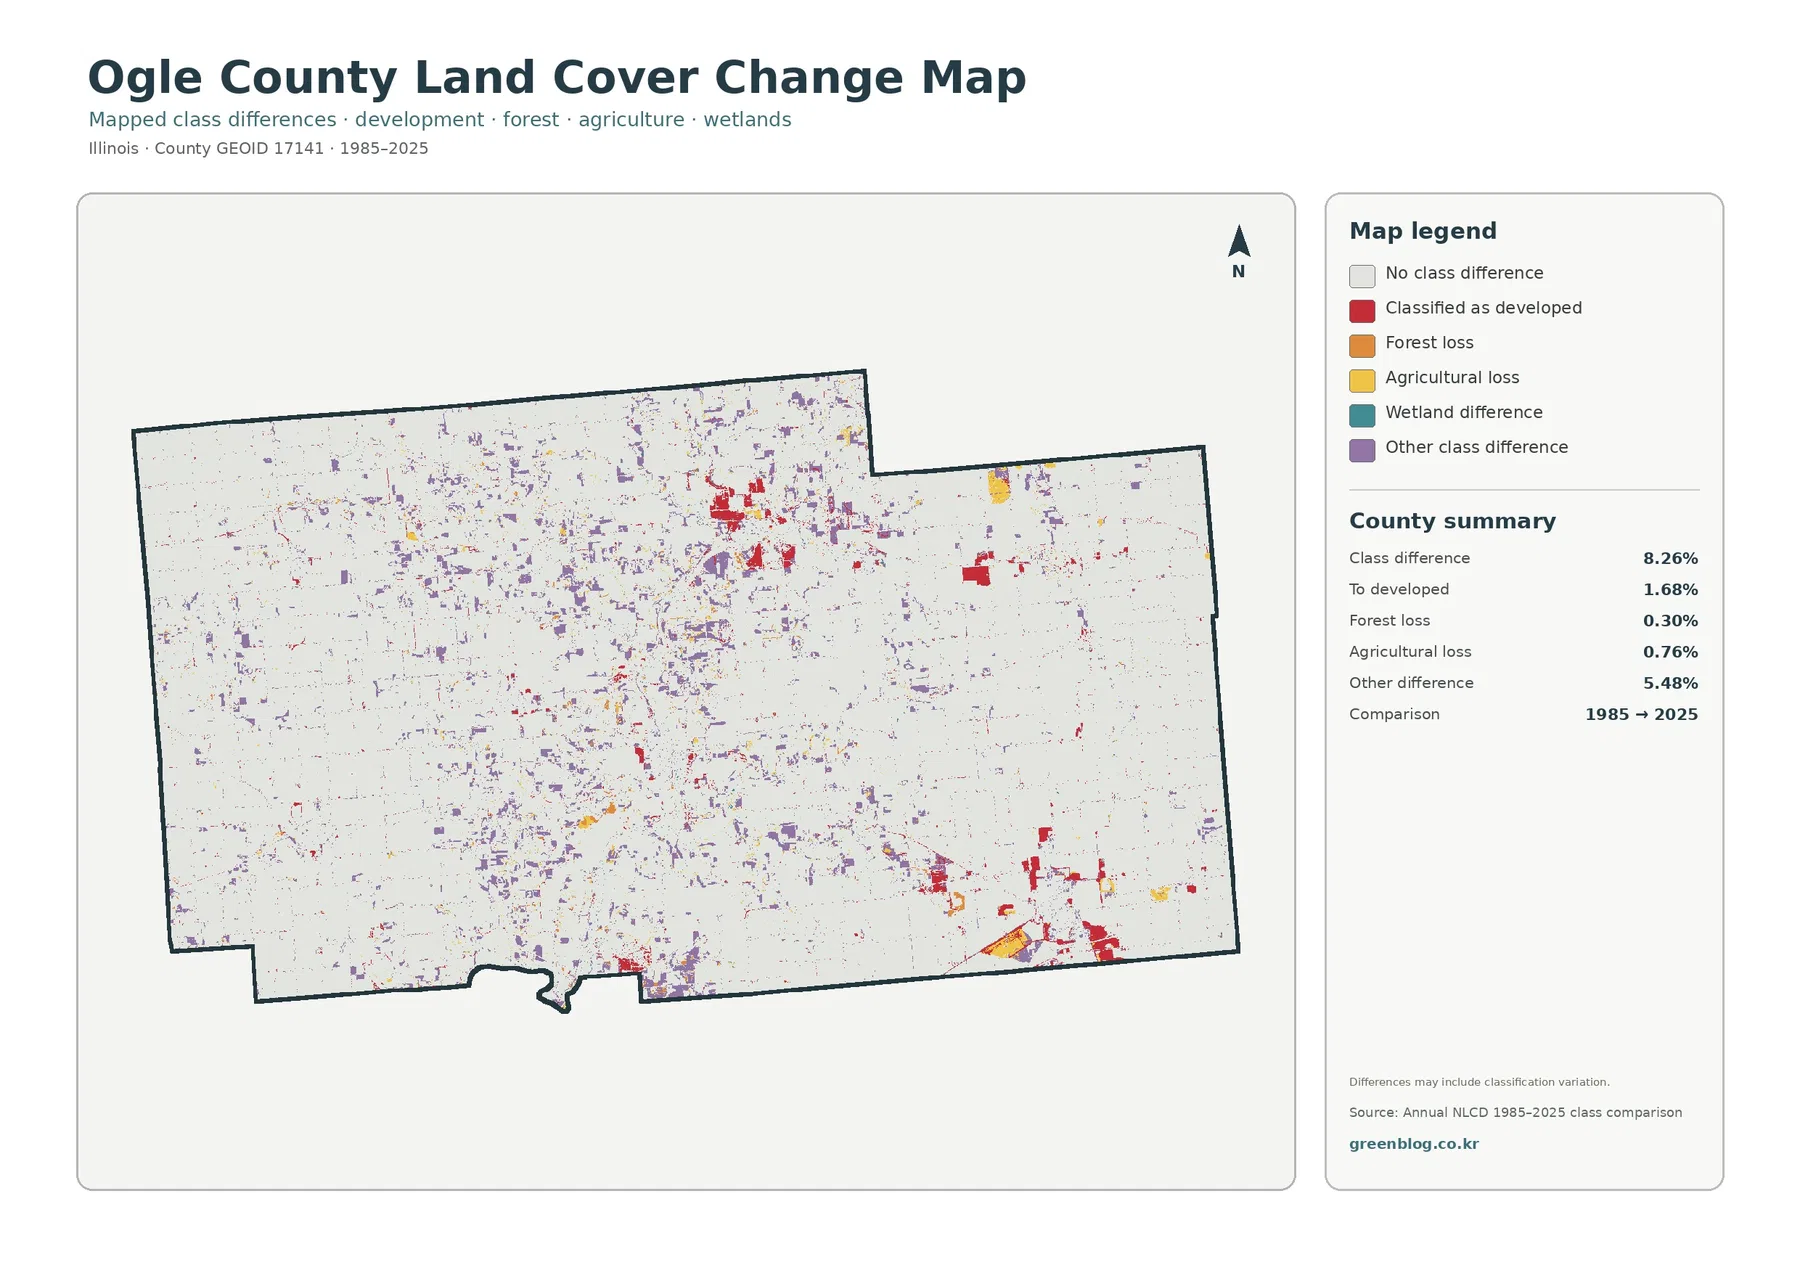
The change map compares the 1985 and 2025 classifications cell by cell. The county summary reports 8.26% with a different mapped class. Within that total, 1.68% is categorized as changing to developed, 0.30% as forest loss, 0.76% as agricultural loss, and 5.48% as other class difference. Those four listed values total 8.22%; the small remainder is represented by other mapped categories such as wetland difference rather than a value that should be guessed.
Red developed-change cells are most noticeable around existing town clusters, including Rochelle and the central and northern river communities. Some linear red features also appear along transportation corridors. Even so, development is not the largest component of the 8.26% total. Purple other-class difference is spread much more widely across farm and forest boundaries, which is why the overall figure cannot be described as an 8.26% increase in urban land.
The map itself cautions that class differences may include classification variation. A cell near a forest edge, wetland, riverbank, or mixed field boundary can be assigned differently when imagery, season, or classification methods differ. That issue is especially important along the Rock River, where water, woodland, wetlands, and agriculture can meet within a short distance.
This is also an endpoint comparison, not a year-by-year history. A location that changed in the 1990s, shifted again later, or returned to an earlier class can only be investigated with intermediate Annual NLCD layers, aerial photographs, or local records. The map is best used to identify places worth checking rather than to determine a precise date or cause on its own.
Using the four maps for county profiles and classroom comparisons
For a general county profile, start with the 2025 land-cover map because it shows the three most important patterns together: the 81.10% agricultural background, the wooded Rock River corridor, and the town clusters. A reader can understand the basic geography quickly before moving to a more specialized layer.
For natural-landscape discussion, the forest-and-farmland map is more effective. It makes the Rock River corridor easier to trace and gives useful context for the DNR descriptions of Castle Rock State Park and Lowden-Miller State Forest. The map should be used for the broader landscape pattern, while official park pages or preserve maps should be used when exact protected-area boundaries matter.
For urban or infrastructure discussion, the impervious map adds information that the general developed class cannot provide. Rochelle, Oregon, Byron, and smaller communities can be compared by the concentration and shape of hard-surface pixels. Thin rural road lines remain visible through the farm grid, making it easier to separate transportation surfaces from larger built-up centers.
For long-term comparison, place the 1985–2025 change map after the current-condition maps. Viewers then have a reference for what the county looks like today before they interpret colored difference cells. Keeping the legend visible is essential because red, orange, yellow, teal, and purple represent different kinds of mapped change or difference.
What these maps can and cannot tell you
Annual NLCD is a raster classification. The landscape is divided into grid cells and each cell is assigned a land-cover class or, in the impervious layer, a hard-surface fraction. Real boundaries are more detailed than those grid edges. Narrow streams, small buildings, thin tree lines, and mixed field margins may be simplified or absorbed into a neighboring class.
Land cover is also different from legal land use. A forest pixel does not establish that land is a public forest or protected preserve. A wetland pixel does not define regulatory jurisdiction. Agricultural color does not identify crop ownership, zoning, or a right to farm, and developed color does not establish a municipal boundary. Parcel-level decisions require the appropriate county or municipal records.
The four downloadable JPGs are 2480×1754 pixels each. They preserve the original supplied map size and are useful for local saving, slides, classroom handouts, and moderate printing. The asset manifest does not mark them as meeting a high-resolution A3 reference standard, so users preparing large-format output should test label and legend readability at the intended print size rather than assuming unlimited enlargement.
A practical approach is to choose one map for the main question and use a second only for comparison. The general map works for an overview, the forest-and-farmland view for the Rock River landscape, the impervious layer for towns and roads, and the change map for the 1985–2025 classification comparison. That keeps the legend readable and prevents four different visual systems from competing on the same small page.
Frequently Asked Questions
What is the dominant land cover in Ogle County?
Agriculture is the dominant 2025 class at 81.10%. Developed land accounts for 8.78%, forest 8.09%, wetlands 0.78%, and water 0.71%. The river corridor creates a strong local contrast because forest, water, and wetlands are concentrated there rather than spread evenly across the county.
Why does the Rock River corridor look more wooded than the rest of Ogle County?
The supplied maps show the most continuous forest along the Rock River and nearby drainage features. Illinois DNR also describes Castle Rock State Park and Lowden-Miller State Forest south of Oregon as wooded Rock River Valley landscapes with ravines, bluffs, and forest. Those references support the broader geographic pattern, but the land-cover map does not show official park boundaries.
Does 8.26% class difference mean that 8.26% of Ogle County became developed?
No. Only 1.68% is shown in the “to developed” category. The summary also lists 0.30% forest loss, 0.76% agricultural loss, and 5.48% other class difference, with a very small remainder represented by other mapped categories. Classification variation can also contribute to the total.
Map File Information
Download four original JPG maps for Ogle County covering 2025 land cover, forest and farmland, impervious/developed surface, and mapped class differences from 1985 to 2025.
- Included Files: Four original JPG land-cover maps
- File Type: JPG files in one ZIP archive
- Intended Use: Printing, education, presentations, and map-based projects
Related Maps
- Adams County Illinois Land Cover Map
- Alexander County Illinois Land Cover Map
- Bond County Illinois Land Cover Map
Sources and References
- MRLC Annual NLCD Data
- USGS Annual NLCD Land Cover Classification
- U.S. Census Bureau TIGER/Line Shapefiles
- USDA 2022 Census of Agriculture Ogle County Profile
- Illinois DNR Castle Rock State Park
- Illinois DNR Lowden-Miller State Forest
Green Map creates custom-edited map images using open geographic data sources such as geoBoundaries, Natural Earth, OpenStreetMap, and government open data. These maps are edited visual materials, not raw data files, and are provided for education, documents, presentations, and graphic reference.