Delaware is compact enough that a statewide map can look simple at first glance: three counties stacked from north to south. Population patterns are much less uniform. The 2024 ACS tract map shows a dense patchwork across northern New Castle County, while central and southern Delaware contain broad lower-density areas broken by smaller clusters around Dover, Milford, Georgetown, Seaford, and other places.
The county numbers add an important second layer. New Castle County has an estimated 577,961 residents in the supplied 2024 ACS data and an average density of about 1,356 people per square mile. Sussex has more residents than Kent—255,626 versus 187,604—but Kent is denser on average, about 320 people per square mile compared with 273 in Sussex. A county can therefore rank higher in total population and lower in population density at the same time.
Change over time tells a third story. All three counties gained population between the 2010 and 2020 decennial censuses, but they did not grow at the same rate. Sussex increased by about 20.4%, Kent by 12.0%, and New Castle by 6.0%. The most densely settled county in 2024 was not the fastest-growing county during the prior decade. Reading the five maps together keeps current concentration, absolute population, and historical change separate.
Table of Contents
Start with the tract map, not the county average
The detailed density map uses 2024 ACS 5-year estimates at the census-tract level and reports people per square mile. Its legend runs from 0–50 through 50–200, 200–500, 500–1,000, 1,000–2,500, 2,500–5,000, 5,000–10,000, and 10,000 or more. Darker tracts contain more residents per unit of land. County boundaries are drawn with heavier lines so the fine-grained pattern can be compared with Delaware’s three large administrative areas.
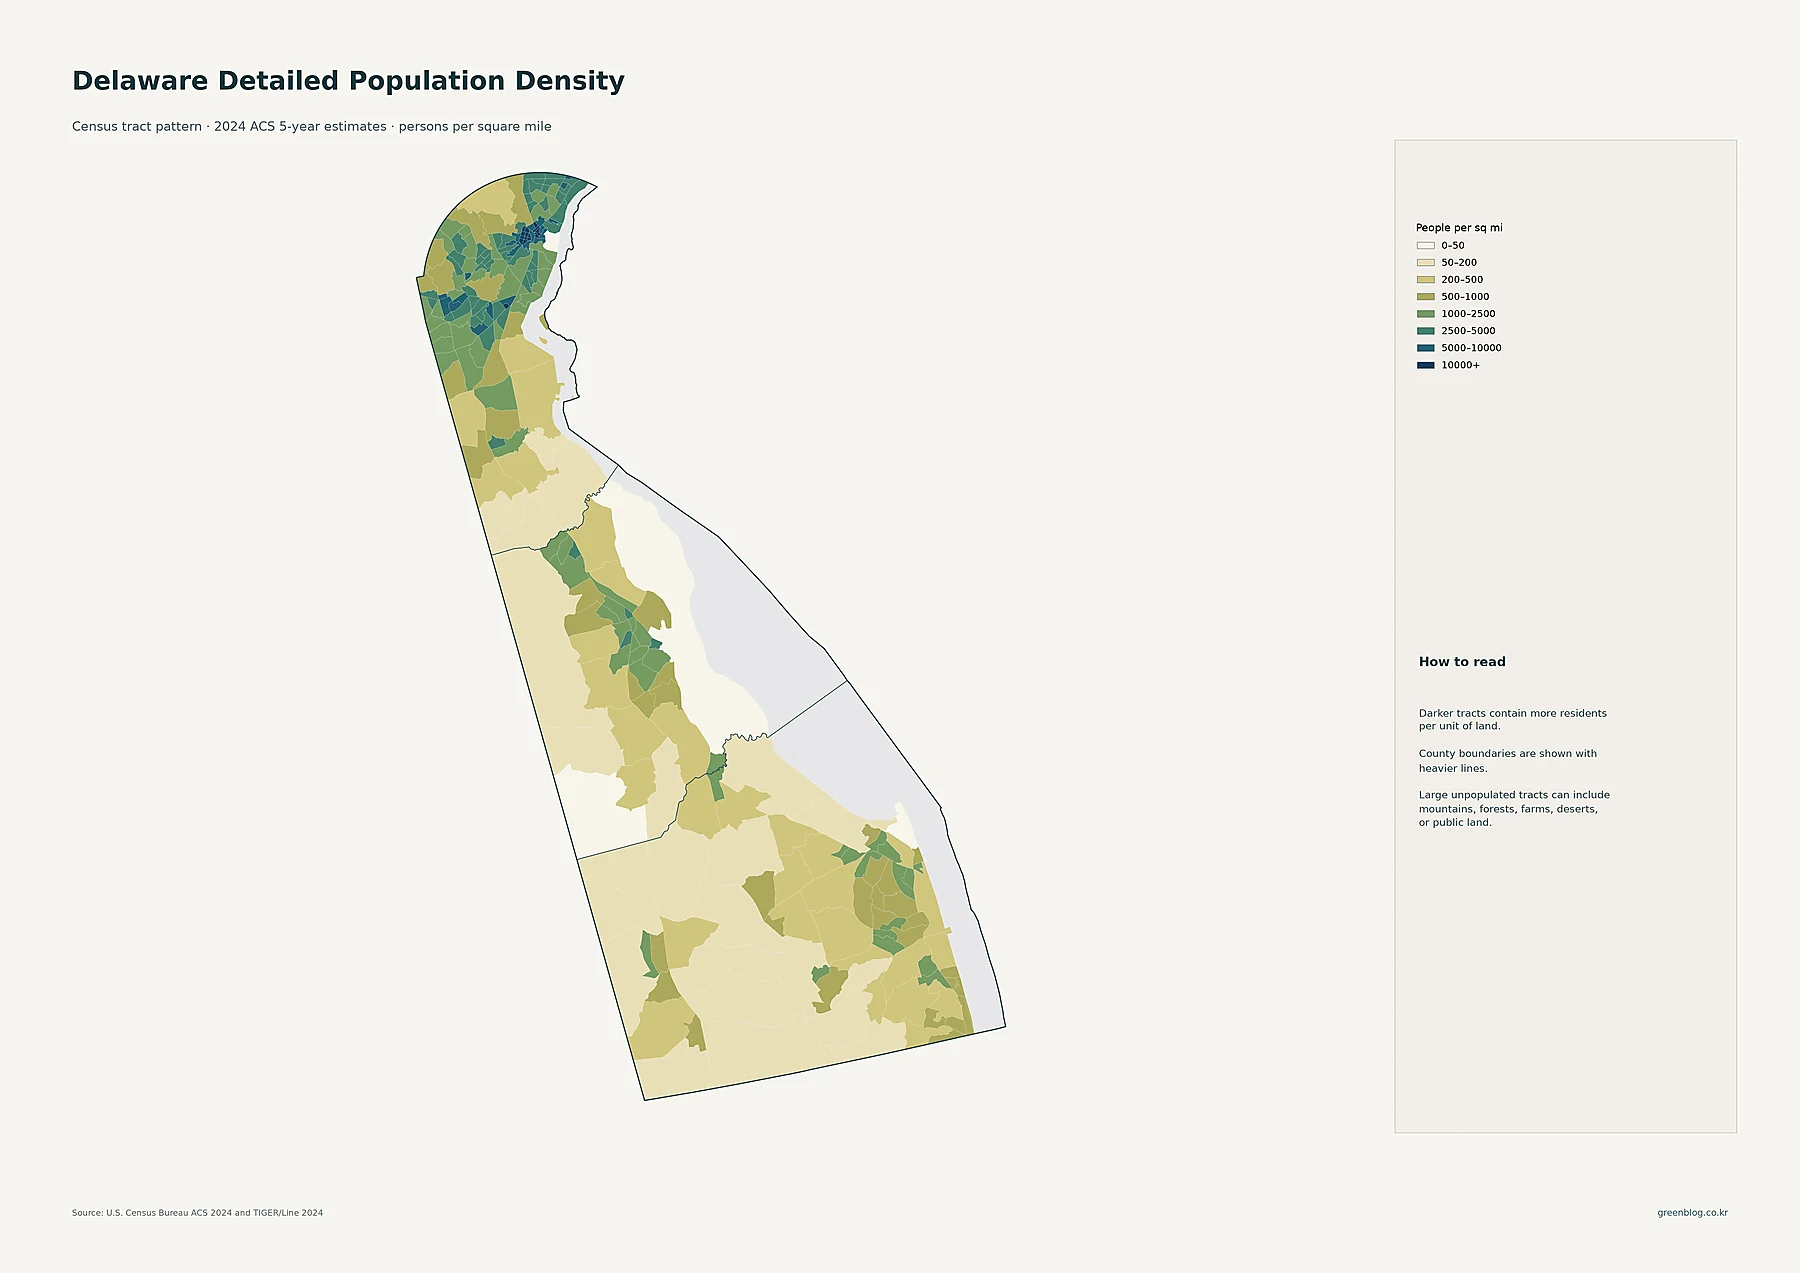
Northern New Castle contains the broadest concentration of medium- and high-density tracts. The darkest small tracts appear in the Wilmington area, and other relatively dense tracts extend around Newark, Brookside, Bear, and nearby northern communities. In Kent County, the Dover area stands out against lighter surrounding tracts. Farther south, Sussex County has a more dispersed pattern, with localized concentrations around places such as Georgetown, Seaford, and Millsboro rather than one continuous high-density zone.
This is why the tract map should be the first map used for neighborhood-scale interpretation. A county average compresses many different settlement patterns into one number. Sussex can have a countywide density below 300 people per square mile while still containing individual tracts that are much more concentrated. New Castle likewise includes both dense urban tracts and less dense areas, so its county average should not be treated as a uniform condition.
Place populations reveal the centers inside the pattern
The major cities and urban areas map changes the measurement. The circles represent total population for Census places, not population density. The pale urban-area shading shows the Census urban footprint where available, while the circle sizes provide a quick comparison of place population. That distinction matters because a large circle identifies a populous place even if the map does not calculate how tightly those residents are packed within the place boundary.
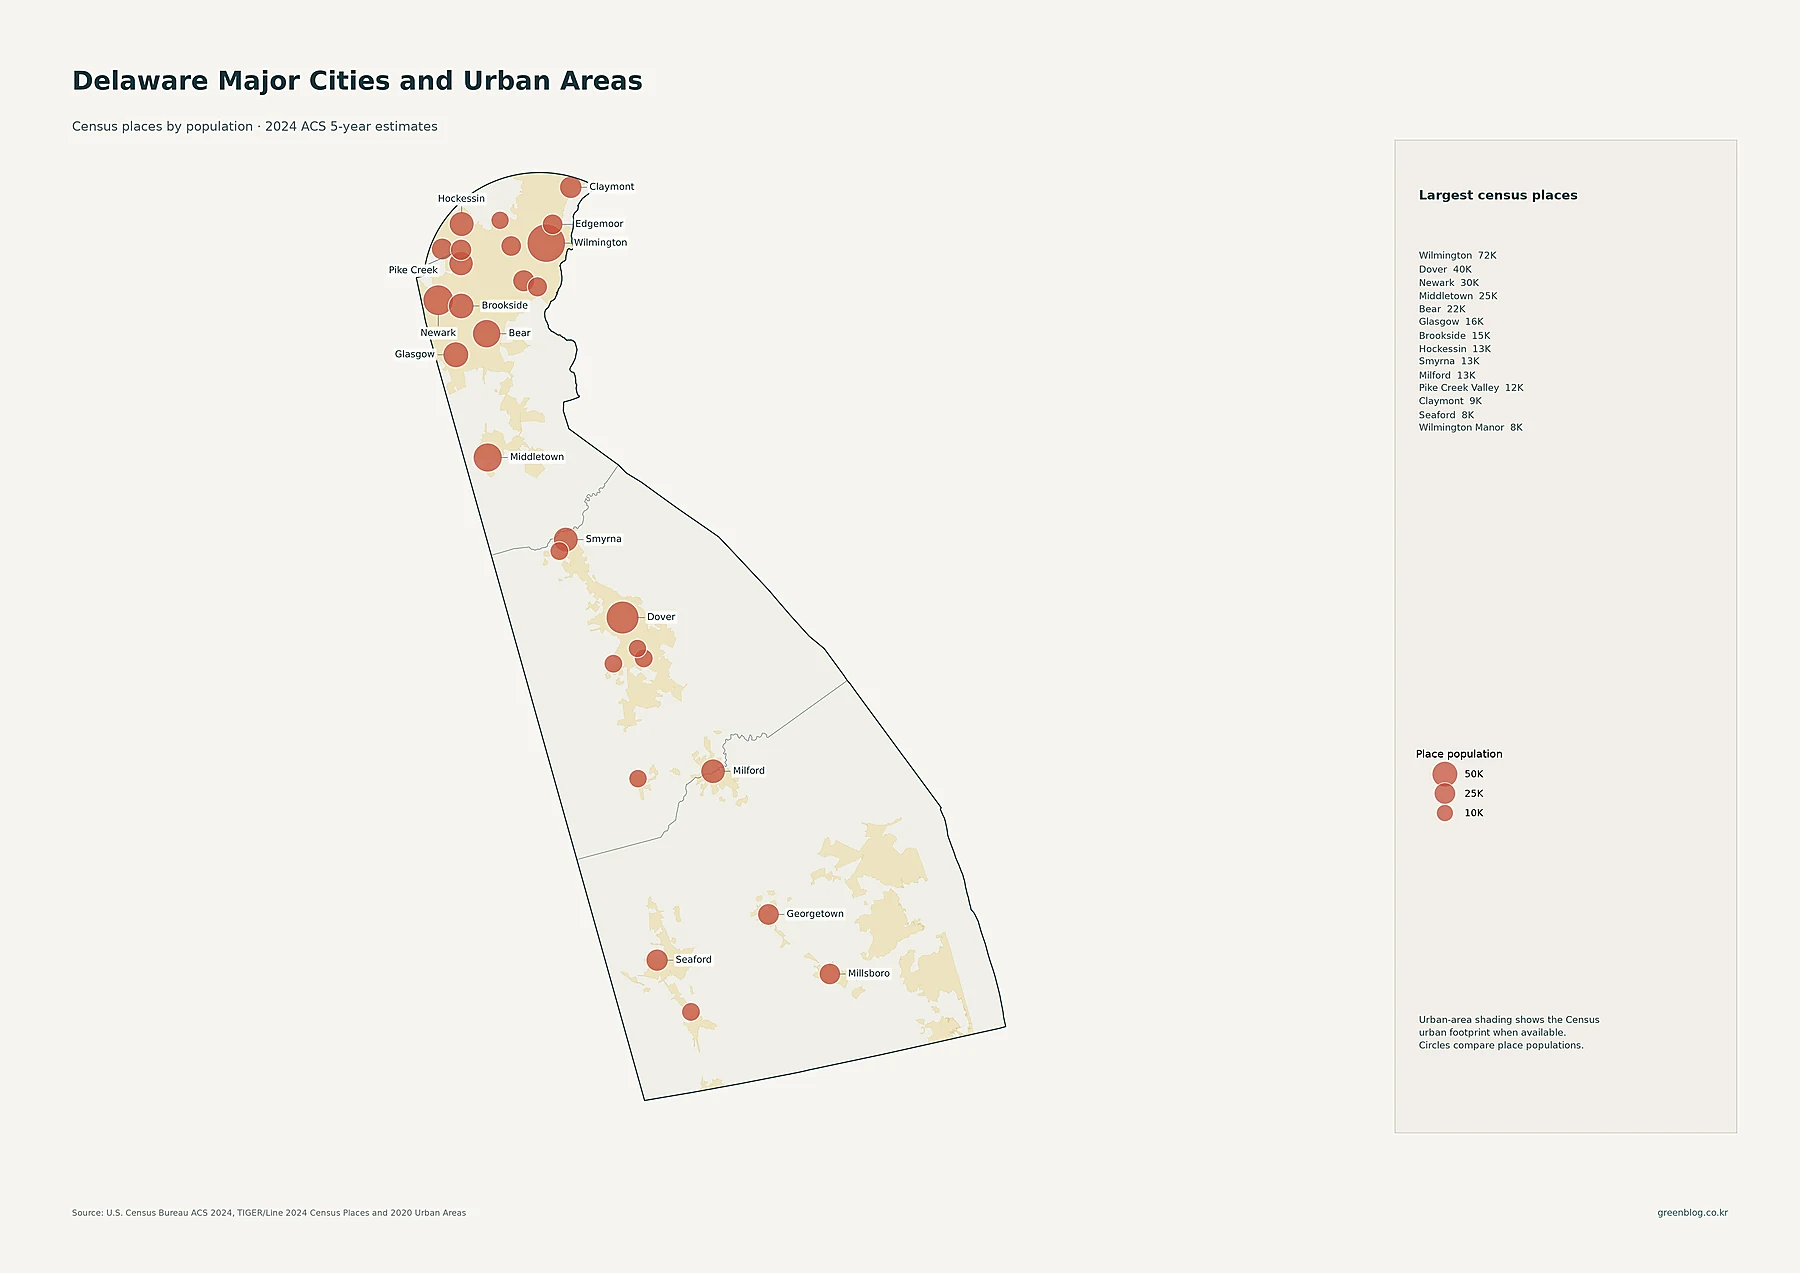
Wilmington is the largest place in the supplied dataset at 71,727 residents. Dover follows at 39,837 and Newark at 30,330. Middletown has 24,661 residents and Bear 22,370. Four of those five are in New Castle County, helping explain why the northern portion of the state contains so many closely spaced population clusters on the tract map. Dover forms the clearest large center in Kent County, while southern Delaware is represented by several smaller places rather than a single circle comparable to Wilmington.
| Census place | 2024 ACS population |
|---|---|
| Wilmington | 71,727 |
| Dover | 39,837 |
| Newark | 30,330 |
| Middletown | 24,661 |
| Bear | 22,370 |
| Glasgow | 15,546 |
| Brookside | 15,115 |
| Hockessin | 13,439 |
| Smyrna | 13,165 |
| Milford | 12,803 |
The map also helps separate “urban center” from “county.” New Castle County contains several of the state’s largest Census places within a relatively small northern area. Kent has Dover plus smaller centers such as Smyrna and Milford. Sussex shows smaller circles around Georgetown, Seaford, and Millsboro. That distribution matches the tract map’s contrast between a nearly continuous northern cluster and more separated central and southern clusters.
County population puts New Castle far ahead in absolute size
The county population map strips away the tract detail and uses proportional circles to compare only the total number of residents. New Castle is estimated at 577,961 residents, Sussex at 255,626, and Kent at 187,604. Added together, the three county estimates equal the statewide total shown in the project, 1,021,191.
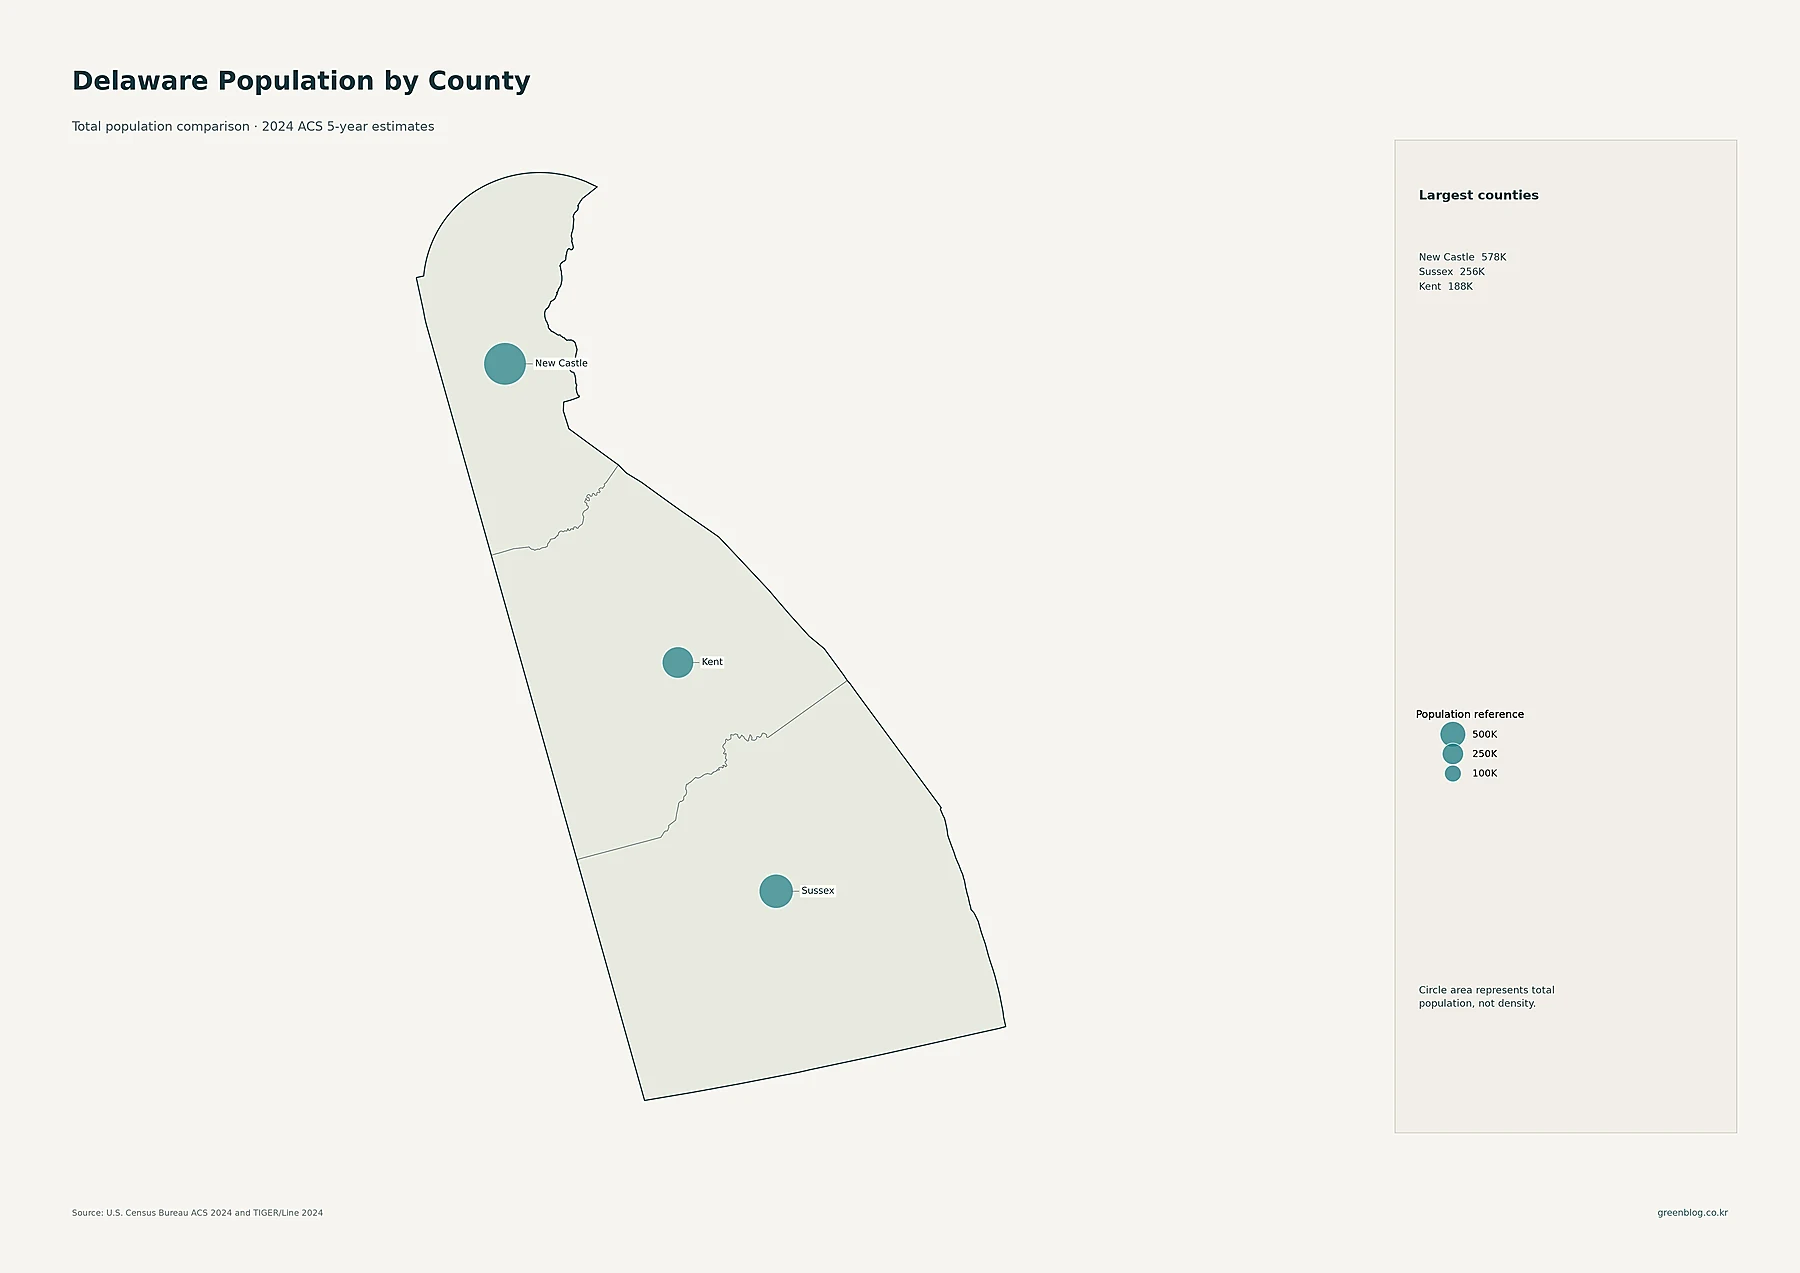
The large New Castle circle confirms that the north is not merely dense because it covers less land; it also contains the largest absolute share of Delaware’s population. Sussex has the second-largest circle and exceeds Kent by roughly 68,000 residents. Yet this ranking changes when land area is incorporated, which is why the next map should not be treated as a duplicate of this one.
Density changes the county ranking between Kent and Sussex
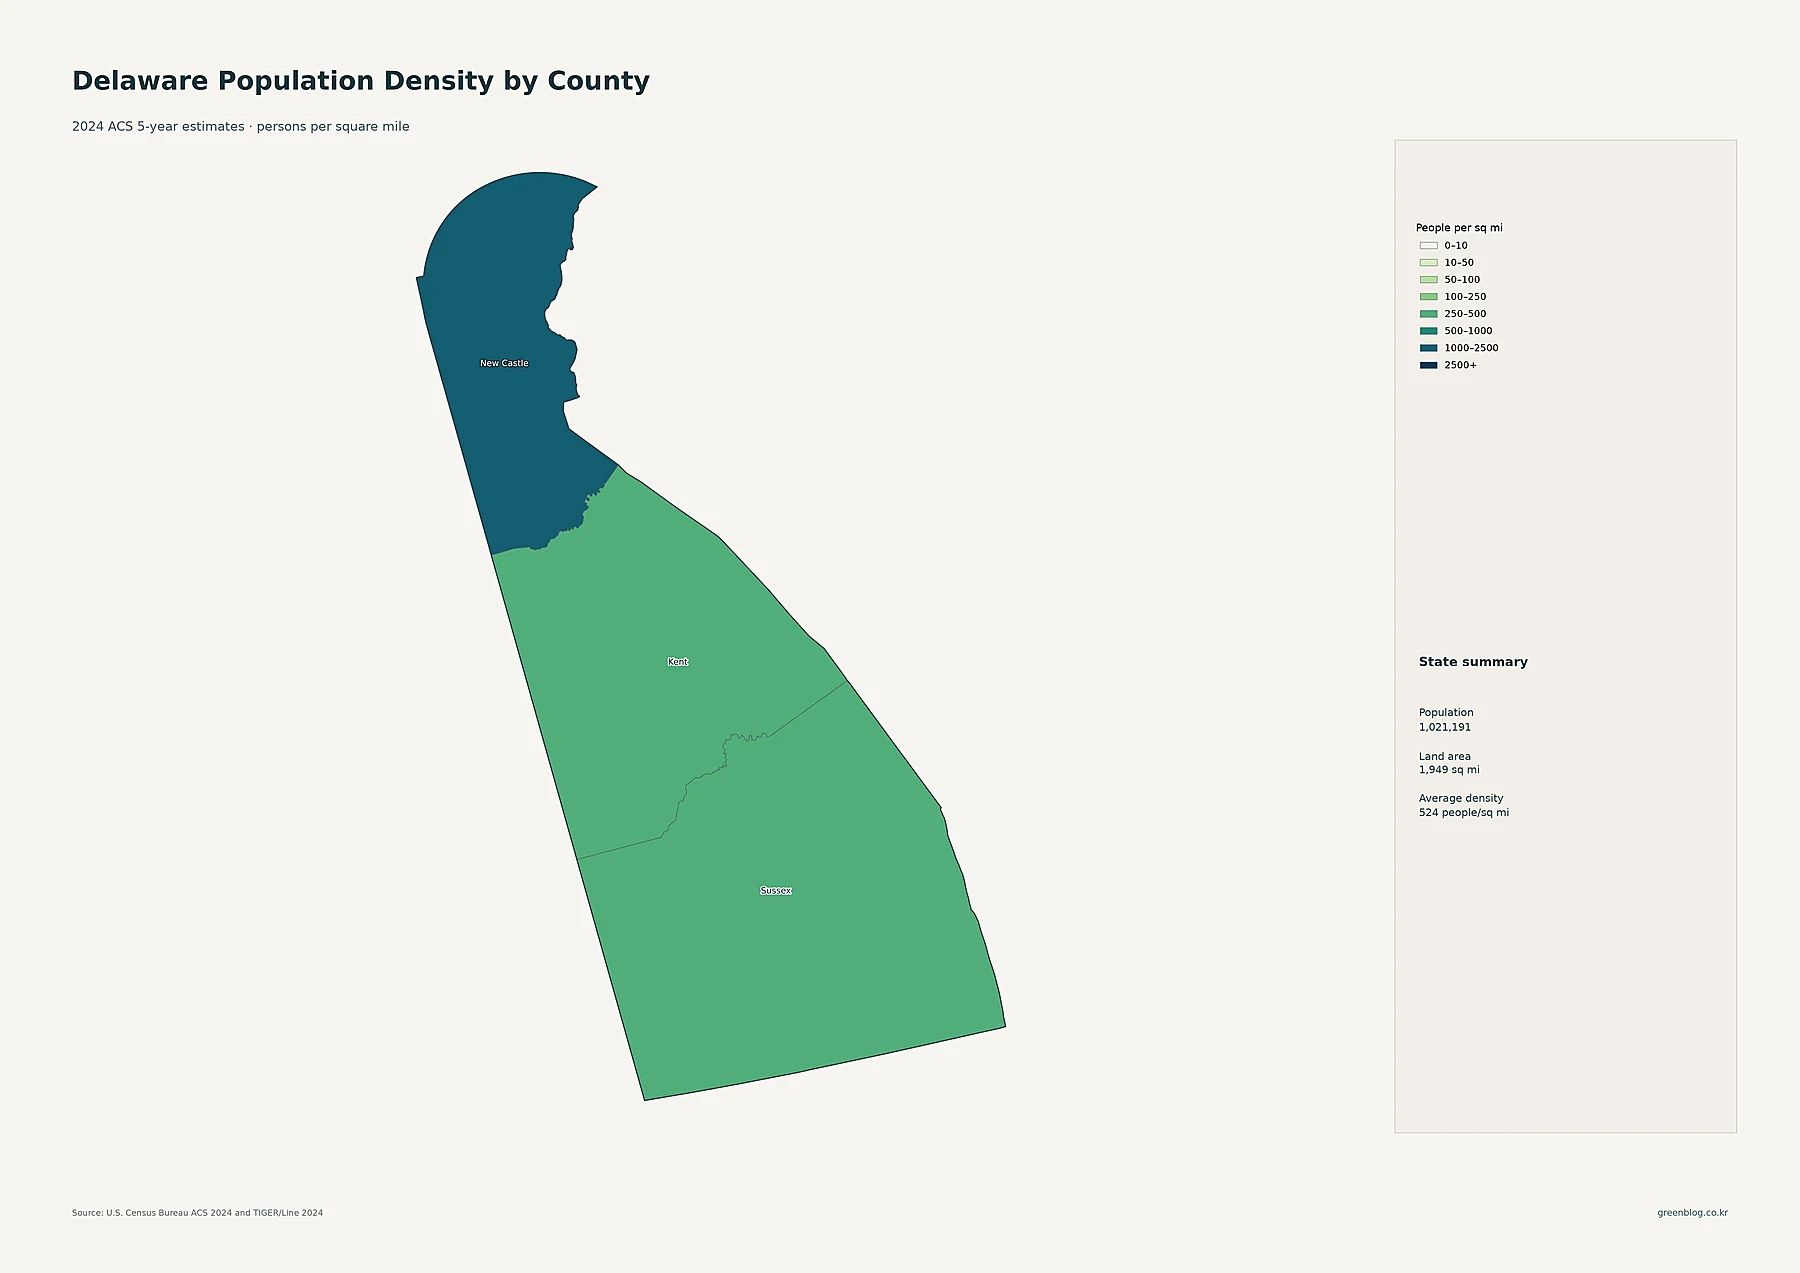
The county density map divides population by land area. New Castle remains the clear leader at about 1,355.6 people per square mile. Kent averages about 320.1, while Sussex averages about 273.1. The state summary printed on the map lists 1,021,191 residents, 1,949 square miles of land, and an average density of roughly 524 people per square mile.
| County | 2024 population | People per sq. mi. | 2010–2020 change |
|---|---|---|---|
| New Castle | 577,961 | 1,355.6 | +6.0% |
| Kent | 187,604 | 320.1 | +12.0% |
| Sussex | 255,626 | 273.1 | +20.4% |
Kent and Sussex are the useful comparison here. Sussex has the larger population but the lower density, indicating that its residents are spread across a larger land base. The county map is therefore useful for broad regional comparison, while the tract map is better for locating actual pockets of settlement. Using only the county shade would hide the sharper urban concentrations visible within each county.
Sussex grew fastest from 2010 to 2020
The population-change map uses a different period and a different source concept from the 2024 ACS snapshots. It compares the 2010 and 2020 decennial census counts. New Castle increased from 538,479 to 570,719 residents, a gain of about 6.0%. Kent increased from 162,310 to 181,851, or about 12.0%. Sussex rose from 197,145 to 237,378, about 20.4%. The source data therefore show growth in all three counties.
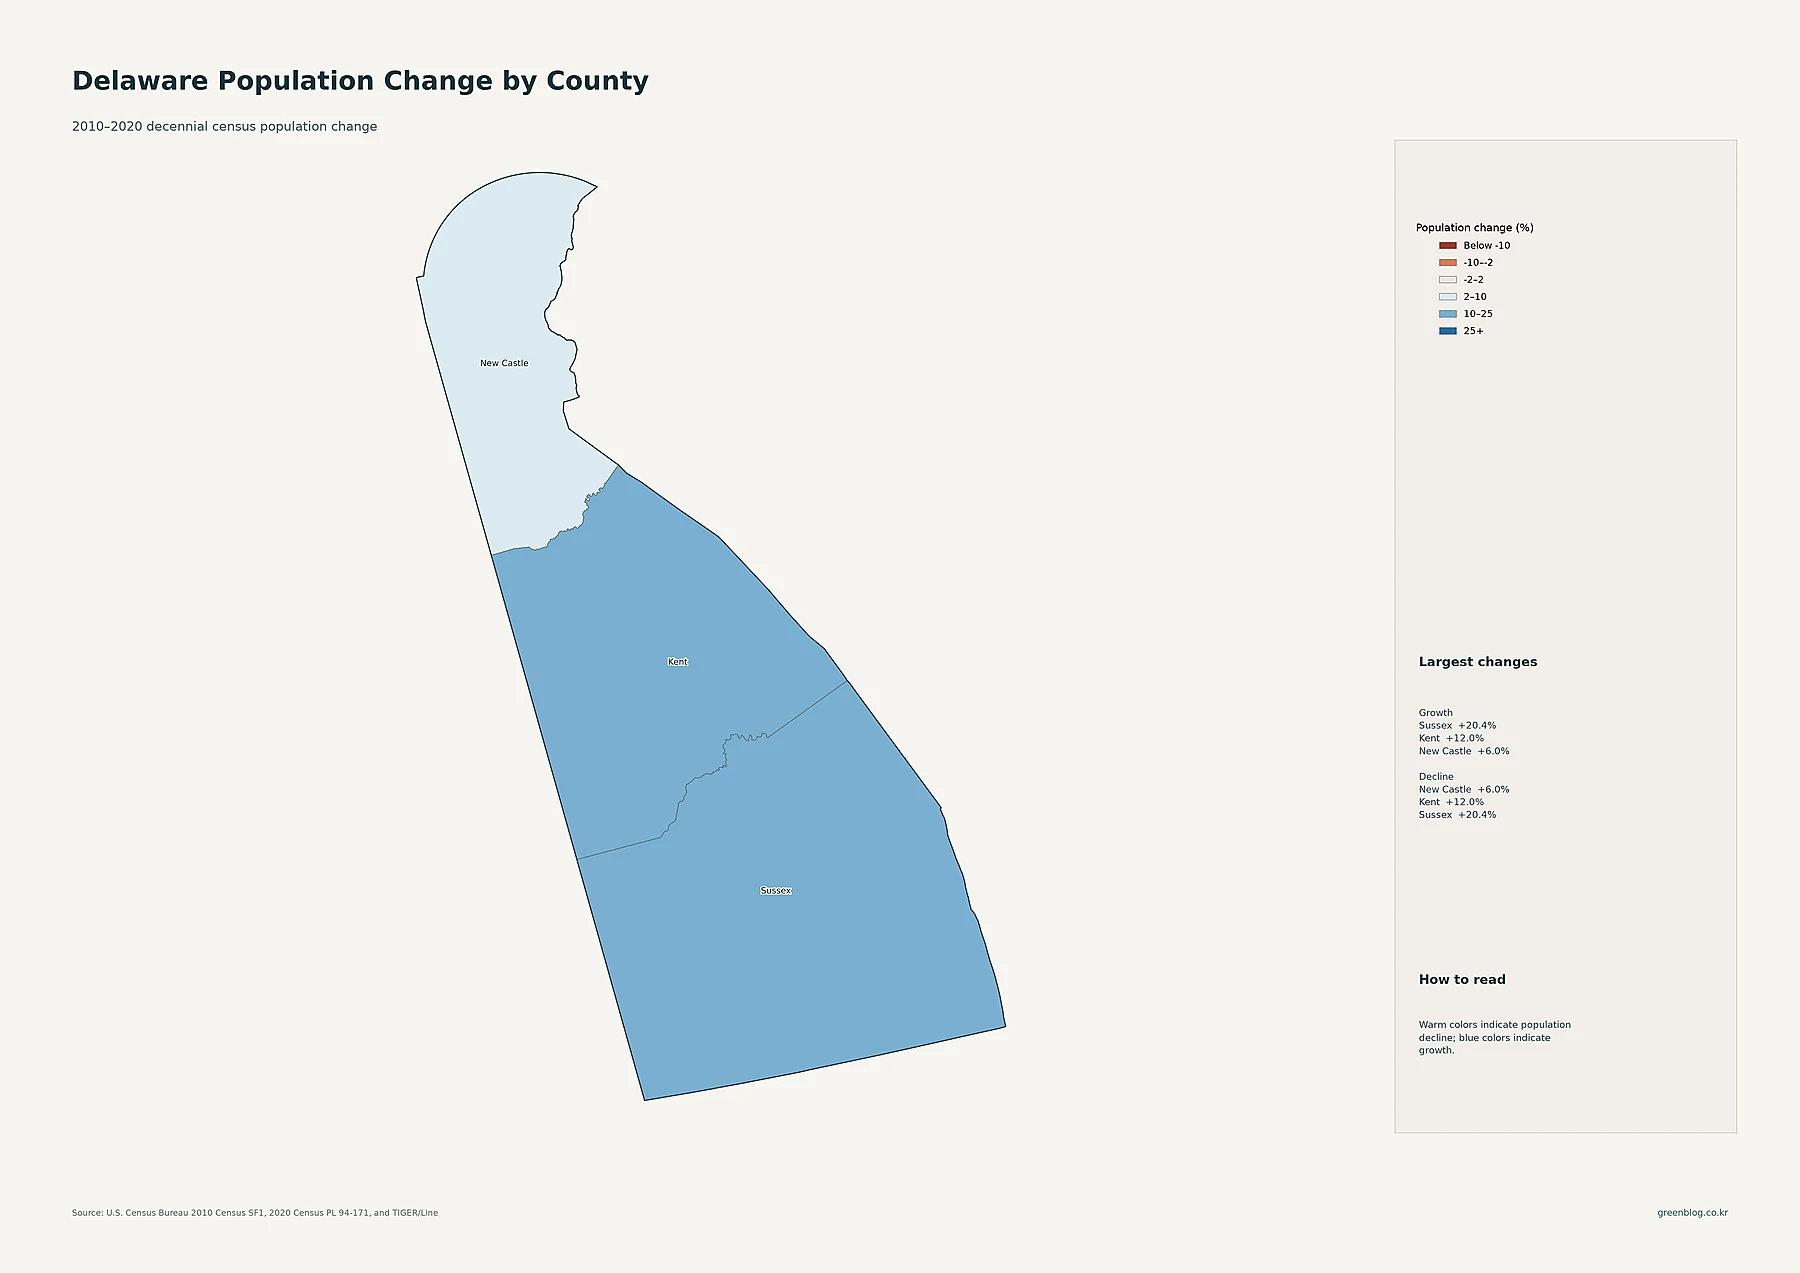
This map reverses the emphasis of the 2024 density map. New Castle is the densest county and has the largest current population, but it had the smallest percentage increase of the three during 2010–2020. Sussex is the least dense countywide in the 2024 data, yet it recorded the fastest growth during that decade. Kent sits between the two on both growth and density. Current concentration and growth rate are related demographic measures, but they answer different questions.
The maps do not establish why one county grew faster than another. They show the measured distribution and the size of the change. Explanations involving housing, employment, retirement migration, transportation, or local development would require additional evidence. Keeping those causal questions separate prevents the map from being asked to prove more than the underlying Census data support.
A practical way to use all five Delaware population maps
For a quick geographic reading, begin with the tract map to locate dense and sparse areas. Then use the place-population map to identify which named communities sit within those clusters. Switch to the county population map when the question is absolute size, and to the county density map when the question is residents per unit of land. Finish with the 2010–2020 change map when the goal is to compare growth rather than current concentration.
That sequence produces a clearer interpretation of Delaware. Wilmington and nearby northern places align with the densest tract pattern, and New Castle leads both county population and average density. Dover is the largest central city and a distinct Kent County cluster. Sussex is more dispersed on the 2024 maps, but its 2010–2020 growth rate is the highest. No single map contains all of those facts, which is why the set works best as a connected reference rather than five interchangeable images.
Download the Delaware population map collection
The collection includes the detailed tract-density map, major places and urban areas, county population, 2010–2020 county change, and countywide density. Each map can also be viewed individually above.
Frequently asked questions
Which Delaware county has the highest population density?
New Castle County. The supplied 2024 ACS data give it an average of about 1,355.6 people per square mile, compared with about 320.1 in Kent and 273.1 in Sussex. Census-tract density still varies substantially within each county, so the detailed map is the better source for local patterns.
Why is Sussex more populous than Kent but less dense?
Population density depends on both population and land area. Sussex has an estimated 255,626 residents versus 187,604 in Kent, but those residents are distributed across a larger area. As a result, Sussex has the higher total population while Kent has the higher average number of residents per square mile.
Did any Delaware county lose population between 2010 and 2020?
No. In the supplied decennial census comparison, New Castle grew by about 6.0%, Kent by 12.0%, and Sussex by 20.4%. Those percentages describe change from 2010 to 2020 and should not be confused with the 2024 ACS estimates used on the current density and population maps.
Related Maps
Sources
The current population, place, and density figures in this map set use the supplied U.S. Census Bureau 2024 ACS 5-year data, with 2024 TIGER/Line geography. The decade-change map compares county population from the 2010 and 2020 decennial censuses.
- U.S. Census Bureau — 2024 ACS 5-Year Data — official access information for the 2020–2024 ACS 5-year estimates
- U.S. Census Bureau — 2024 TIGER/Line Shapefiles — official geographic boundary files used with Census data
- U.S. Census Bureau — 2010 to 2020 County Population Change — county change reference based on 2010 and 2020 Census PL 94-171 files
Green Map creates custom-edited map images using open geographic data sources such as geoBoundaries, Natural Earth, OpenStreetMap, and government open data.
These maps are edited visual materials, not raw data files, and are provided for education, documents, presentations, and graphic reference.