Alaska’s enormous land area can make a statewide average feel almost meaningless unless it is paired with maps that show where people actually live. The 2024 ACS-based maps in this collection reveal a sharply uneven pattern: Anchorage dominates the population picture, the Fairbanks area forms a separate interior cluster, and several smaller centers line the southeast coast and other isolated parts of the state. Large stretches of northern and interior Alaska remain extremely sparsely populated. Reading the maps together makes it possible to separate four different questions: where density is locally high, which places contain the most residents, which boroughs or census areas have the largest totals, and how population changed between 2010 and 2020.
Table of Contents
Local density is concentrated in very small parts of a very large state
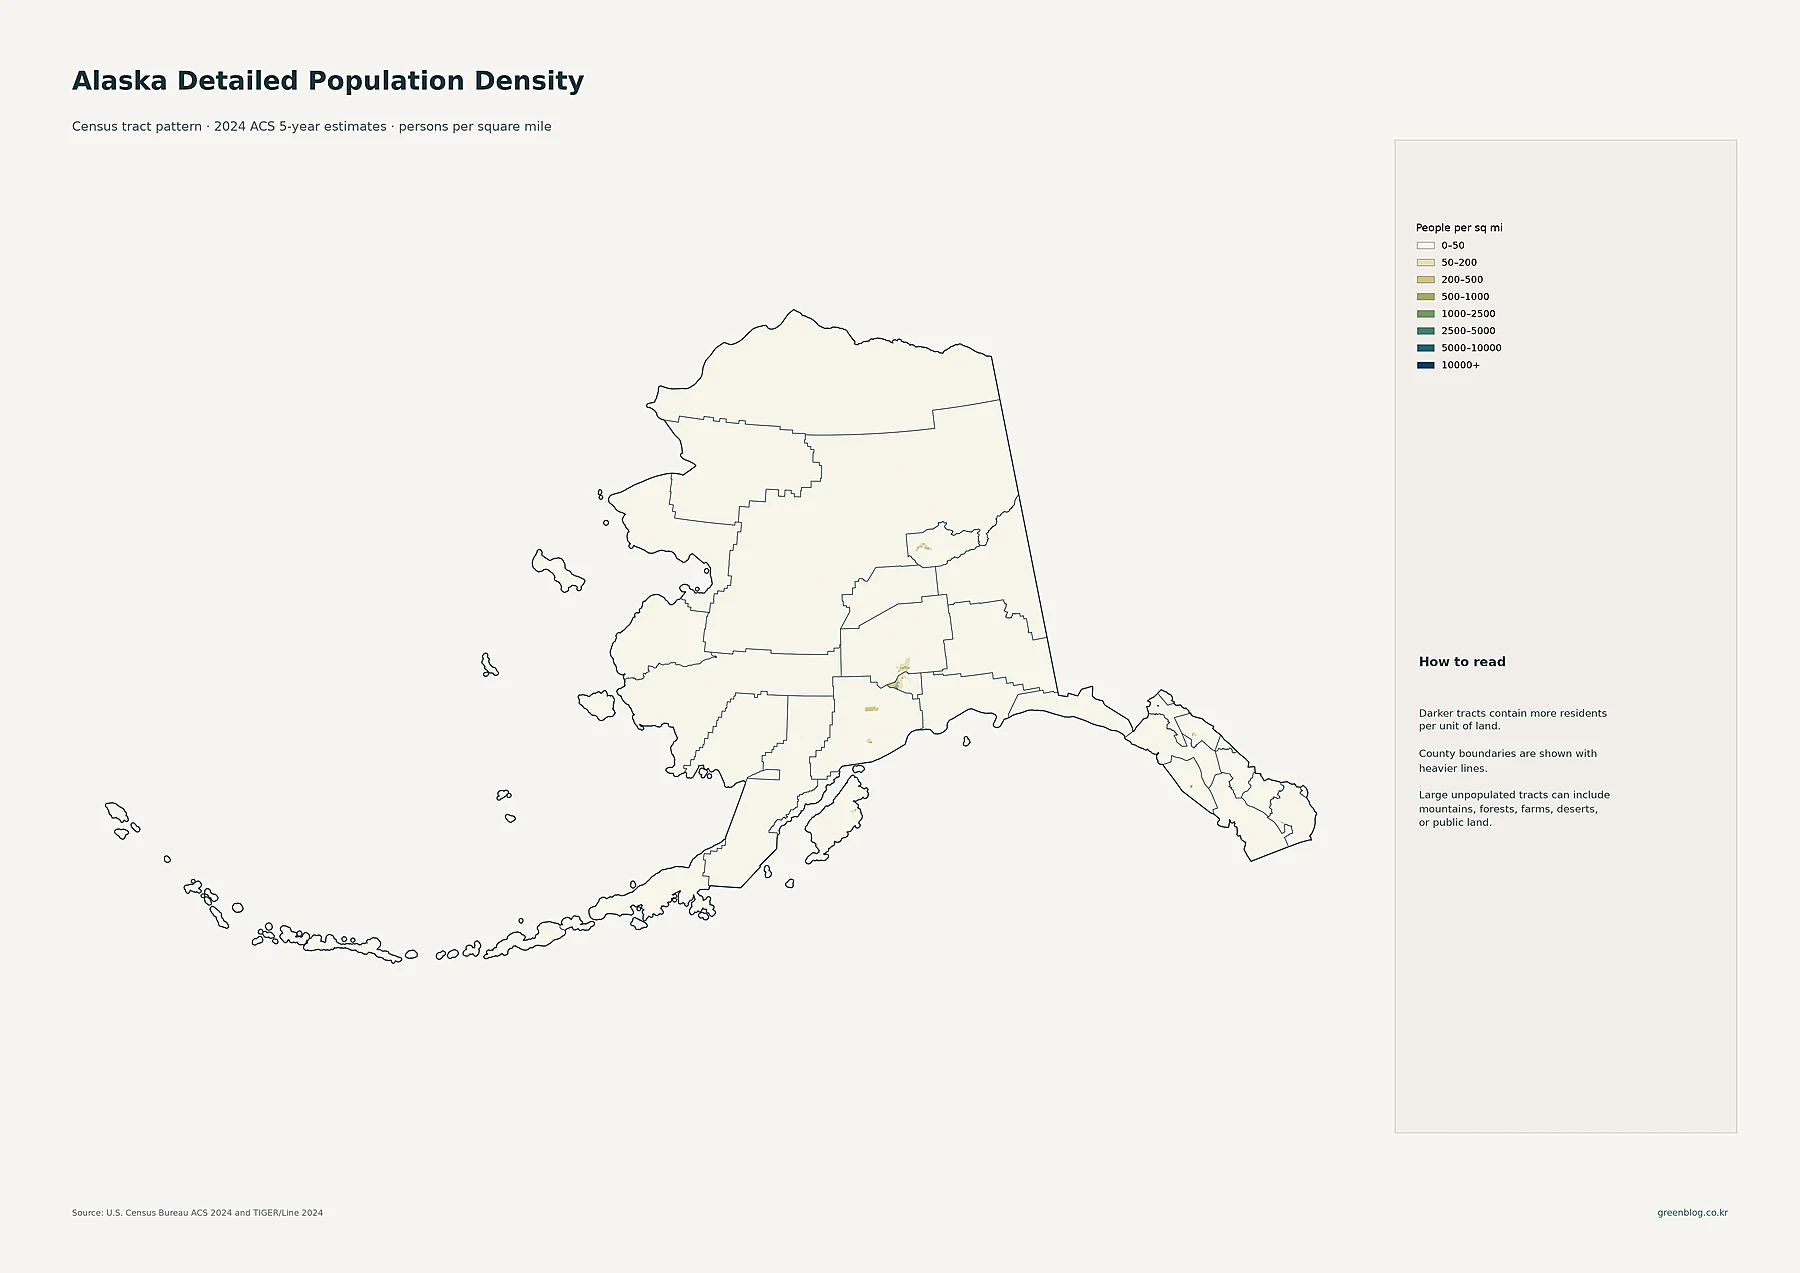
The detailed density map uses 2024 ACS 5-year estimates at the census-tract level and reports people per square mile. Its legend ranges from 0–50 people per square mile to 10,000 or more. Most of the state is shown in the lightest class, while much smaller, darker tracts appear around the main population centers. The Anchorage area is the clearest concentration. Smaller clusters are visible around Fairbanks and in parts of Southeast Alaska.
This tract view is especially useful in Alaska because an average for an entire borough or census area can hide the difference between a compact settlement and the vast low-population land around it. A tract map does not say that the whole Anchorage region is uniformly dense. Instead, it shows where the denser pieces are embedded inside much larger administrative units. That distinction is essential when comparing Alaska with states where counties are smaller and settlement is more continuous.
Anchorage stands apart on the major cities map
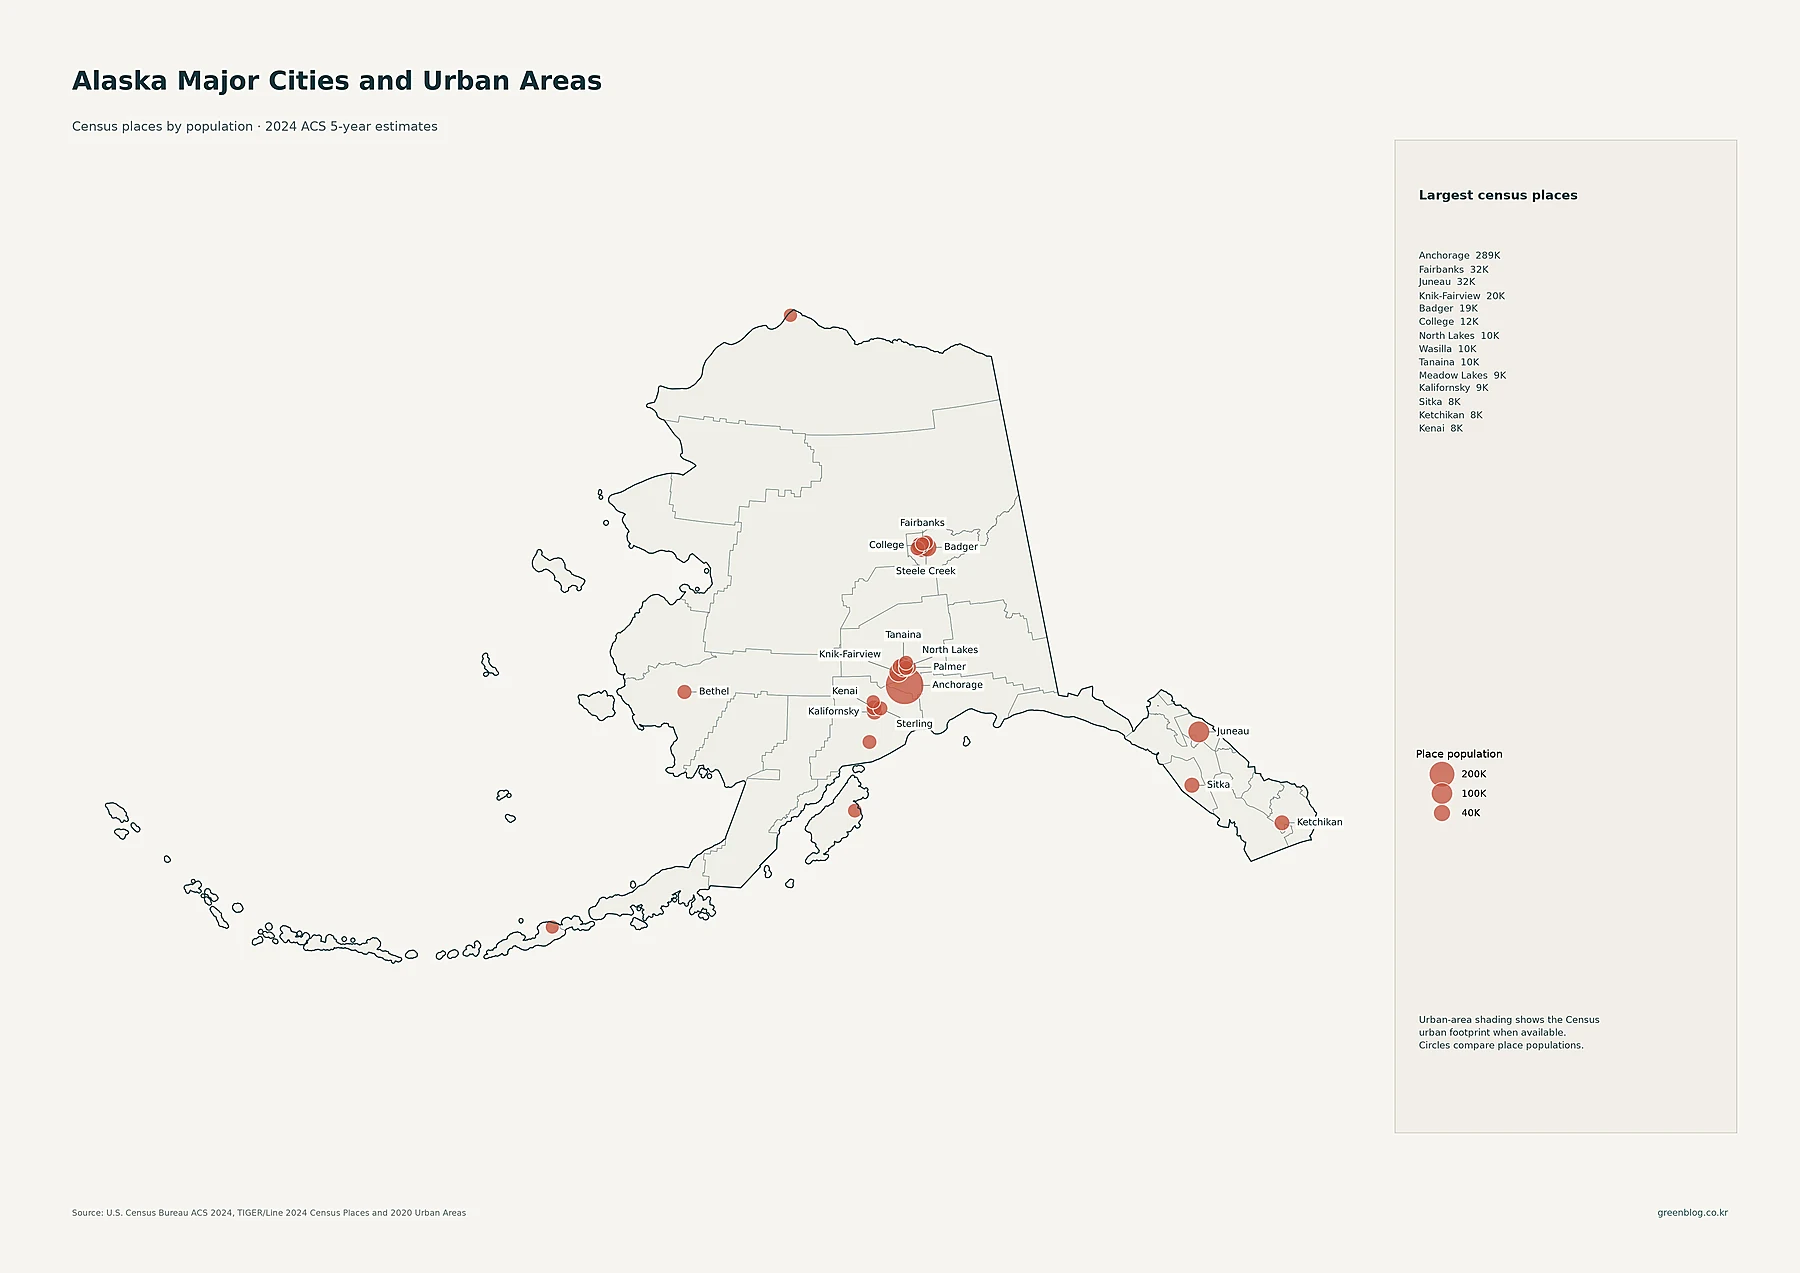
The major-cities map shifts the question from density to place population. Circle size represents the estimated population of each Census place, not people per unit of land. Anchorage is by far the largest at 288,976 in the supplied 2024 ACS dataset. Fairbanks has 32,083 and Juneau 31,794. Other prominent places include Knik-Fairview at 19,972, Badger at 18,677, College at 11,924, North Lakes at 10,223, Wasilla at 9,720, and Tanaina at 9,646.
The pattern is notable because several of the larger places are grouped in the Anchorage–Matanuska-Susitna and Fairbanks areas rather than spread evenly across the state. Southeast Alaska has its own smaller centers such as Juneau, Sitka, and Ketchikan. Bethel appears as a western hub, while Utqiaġvik provides a northern point of settlement far from the larger south-central cluster. The map credits 2024 ACS place estimates, 2024 TIGER/Line Census Places, and 2020 Urban Areas, so the population symbols and the urban footprint should be read as related but not identical time layers.
Borough totals tell a different story from land area
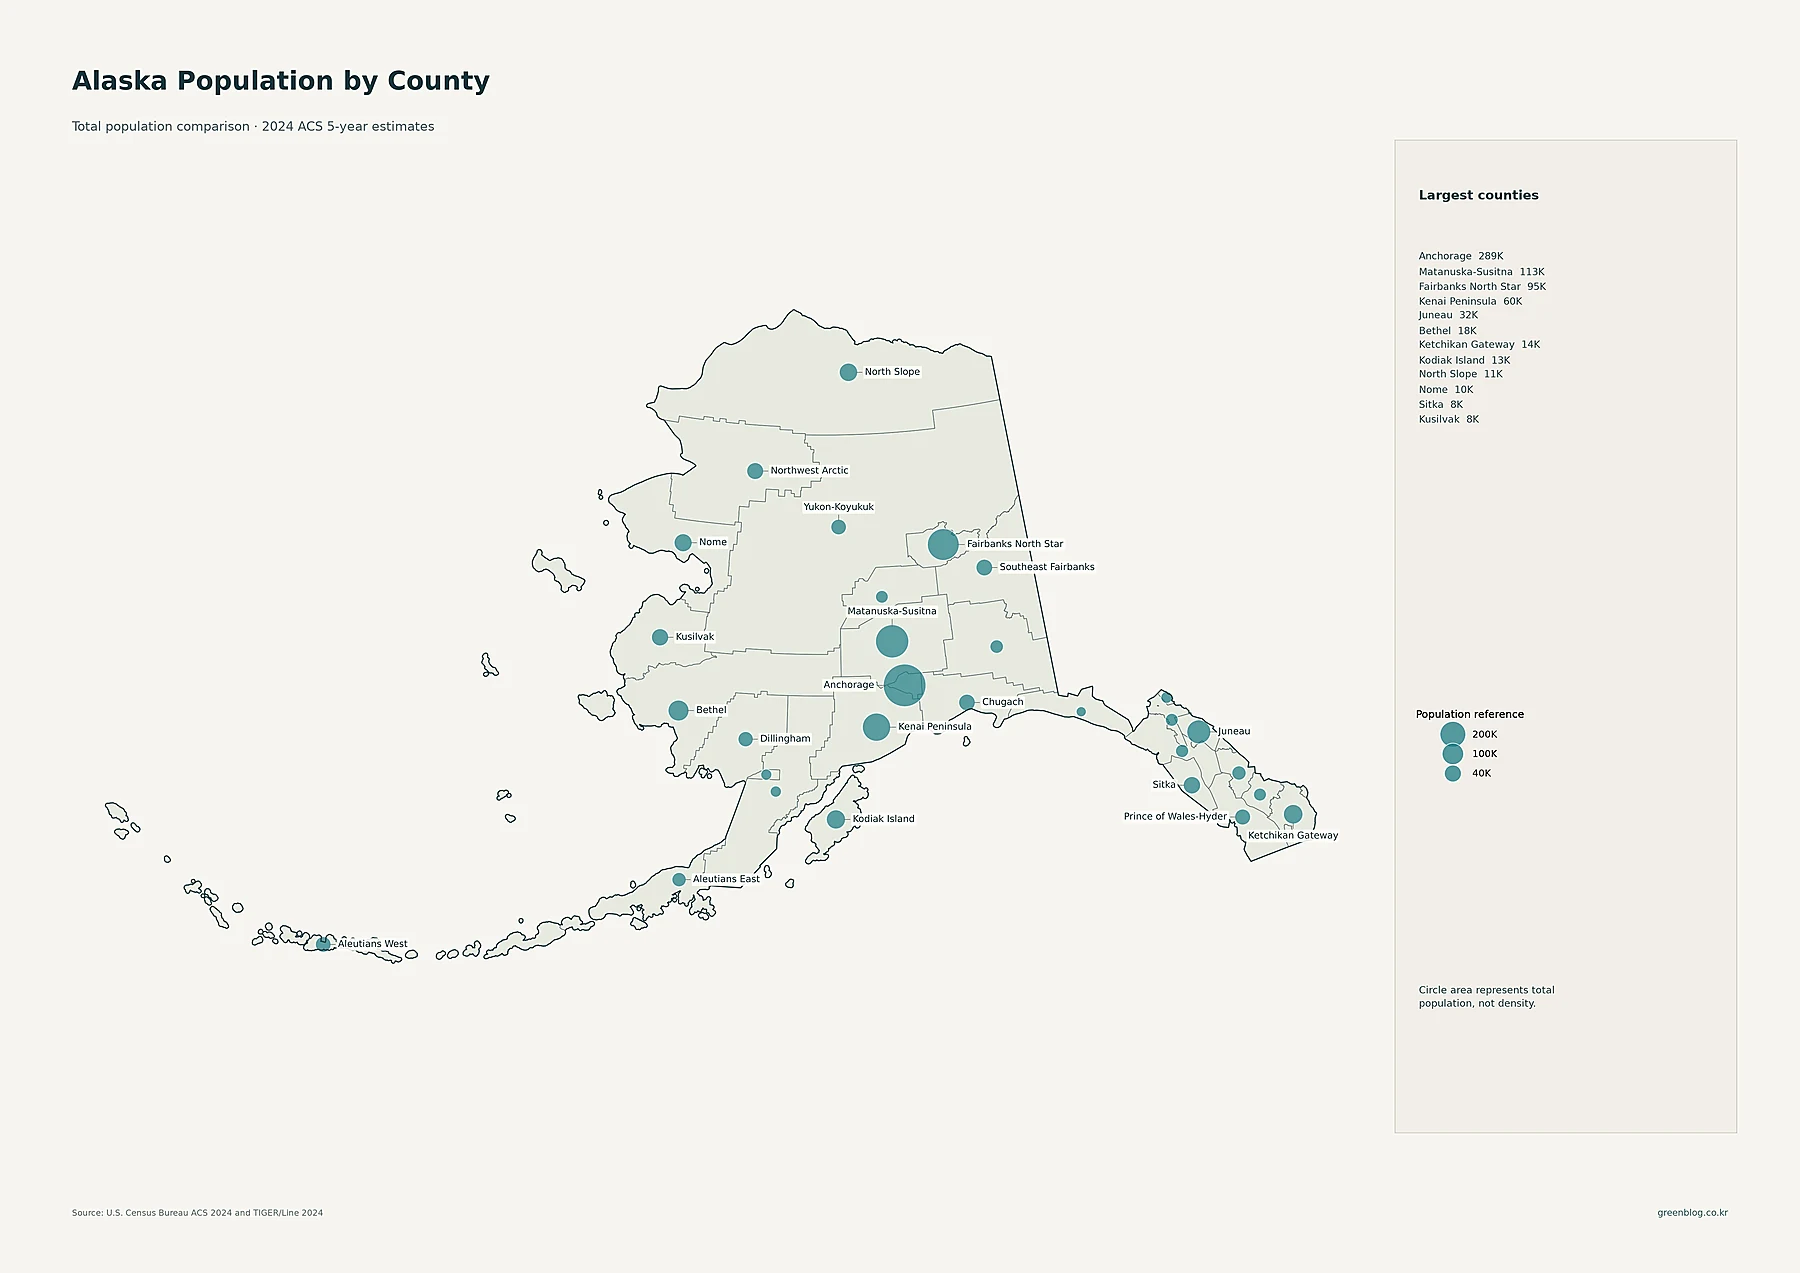
Alaska’s county-equivalent geography includes boroughs, unified municipalities, and census areas. The total-population map represents each unit with a proportional circle. Anchorage again ranks first with 288,976 residents in the supplied 2024 ACS data, followed by Matanuska-Susitna with 112,988, Fairbanks North Star with 95,460, Kenai Peninsula with 60,413, and Juneau with 31,794. The map also highlights several areas in the roughly 8,000–18,000 range, including Bethel, Ketchikan Gateway, Kodiak Island, North Slope, Nome, Sitka, and Kusilvak.
The contrast between physical size and population size is one of the most useful features of this map. North Slope occupies a huge part of northern Alaska yet has an estimated population of 10,810. Anchorage occupies far less land but contains more than a quarter million residents. The proportional circles make that mismatch immediately visible and help prevent a common mistake: assuming that the largest shape on the map must contain the most people.
| Area | 2024 estimated population | People per sq. mi. |
|---|---|---|
| Anchorage | 288,976 | 169.3 |
| Matanuska-Susitna | 112,988 | 4.6 |
| Fairbanks North Star | 95,460 | 13.0 |
| Kenai Peninsula | 60,413 | 3.8 |
| Juneau | 31,794 | 11.8 |
The 2010–2020 map separates growth from today’s population size
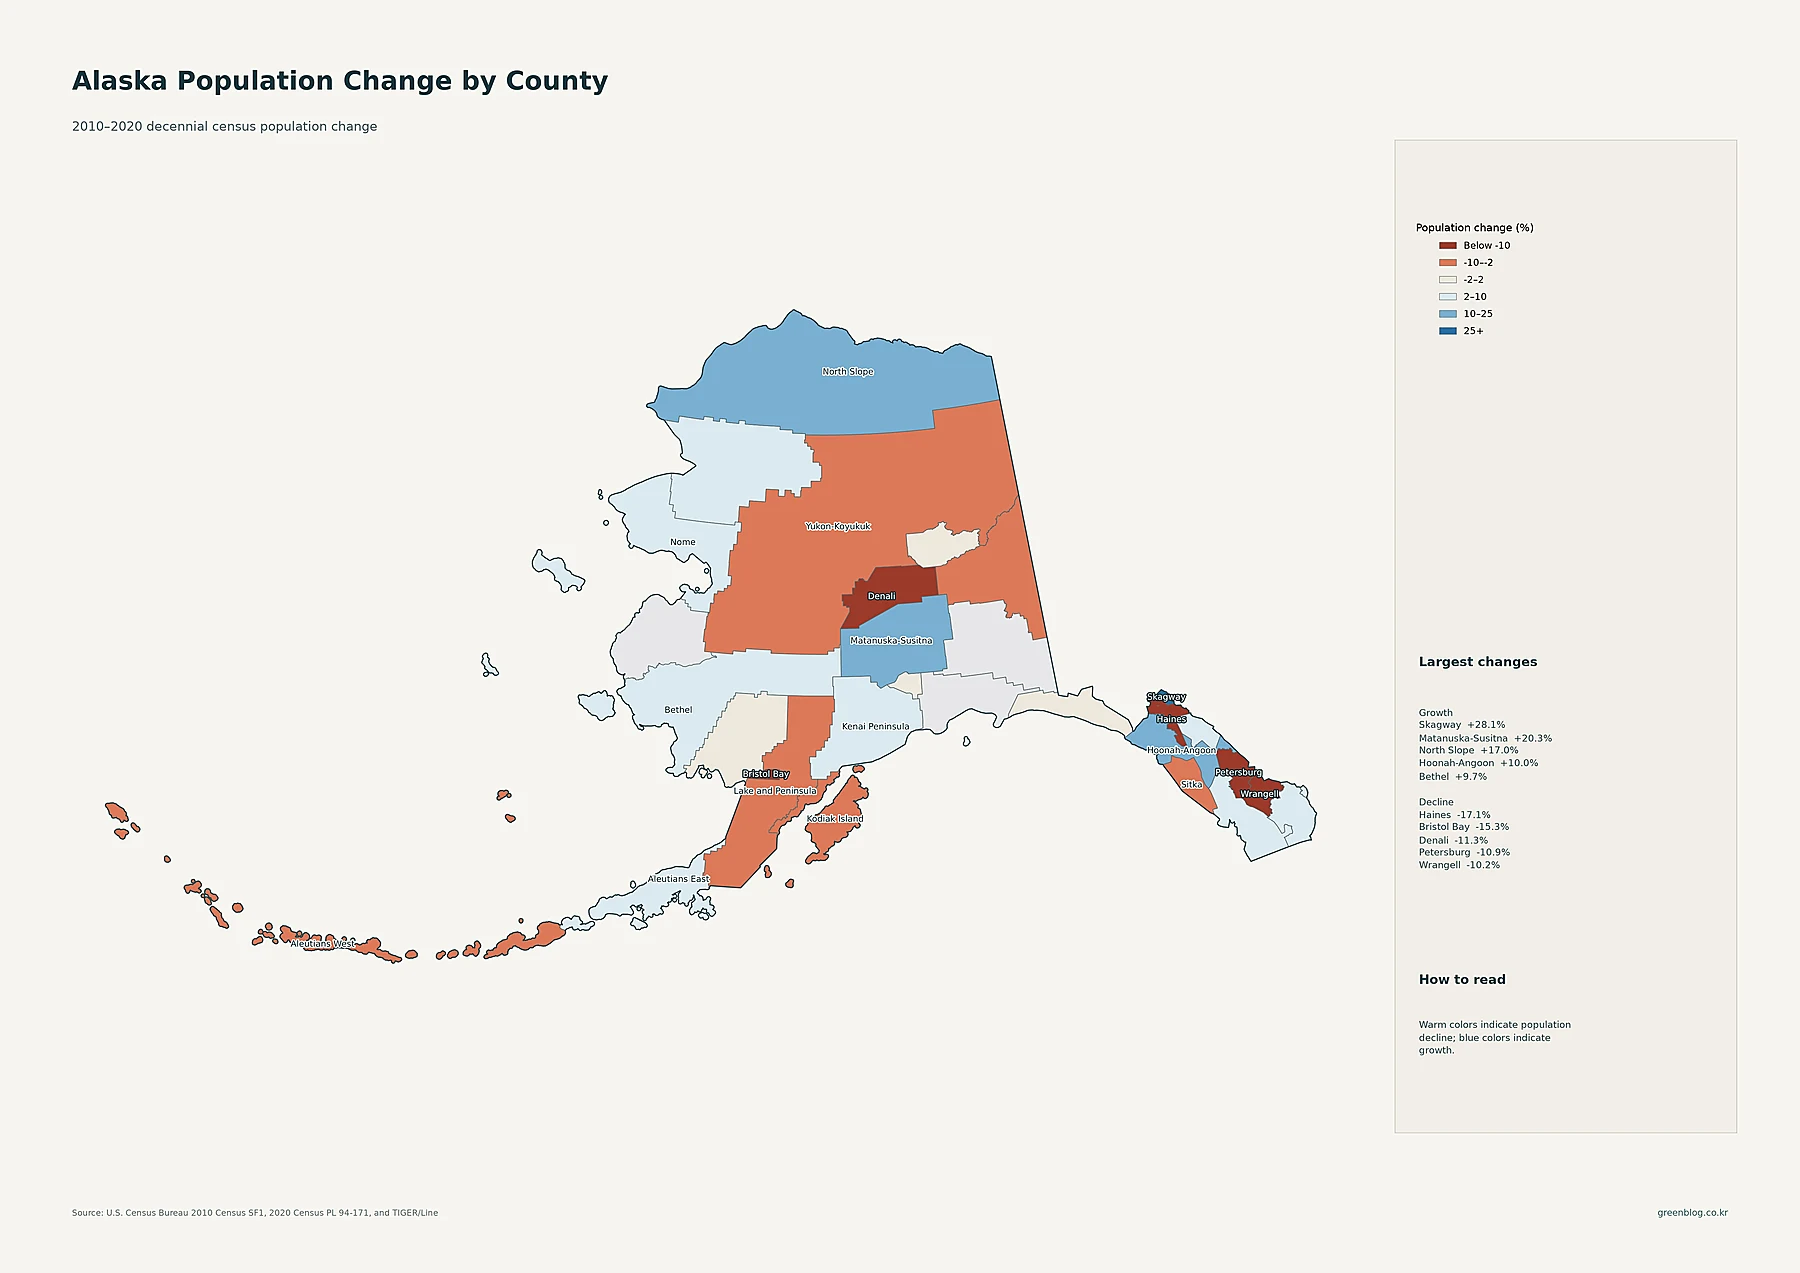
The population-change map uses decennial Census counts from 2010 and 2020 rather than the 2024 ACS estimates shown in the other maps. Blue classes indicate growth and warm colors indicate decline. Among the largest increases shown, Skagway grew by about 28.1%, Matanuska-Susitna by 20.3%, North Slope by 17.0%, Hoonah-Angoon by 10.0%, and Bethel by 9.7%. The supplied data show declines of about 17.1% in Haines, 15.3% in Bristol Bay, 11.3% in Denali, 10.9% in Petersburg, and 10.2% in Wrangell.
These percentages should not be read as a ranking of current population. A smaller area can post a large percentage change from a relatively small numerical shift, while a much larger population can change by many residents without producing the largest percentage. The safest use of this map is to identify the direction and relative scale of change between the two Census years. Explaining why a specific place grew or declined would require additional demographic or economic evidence beyond the map itself.
Average density makes the Anchorage contrast even clearer
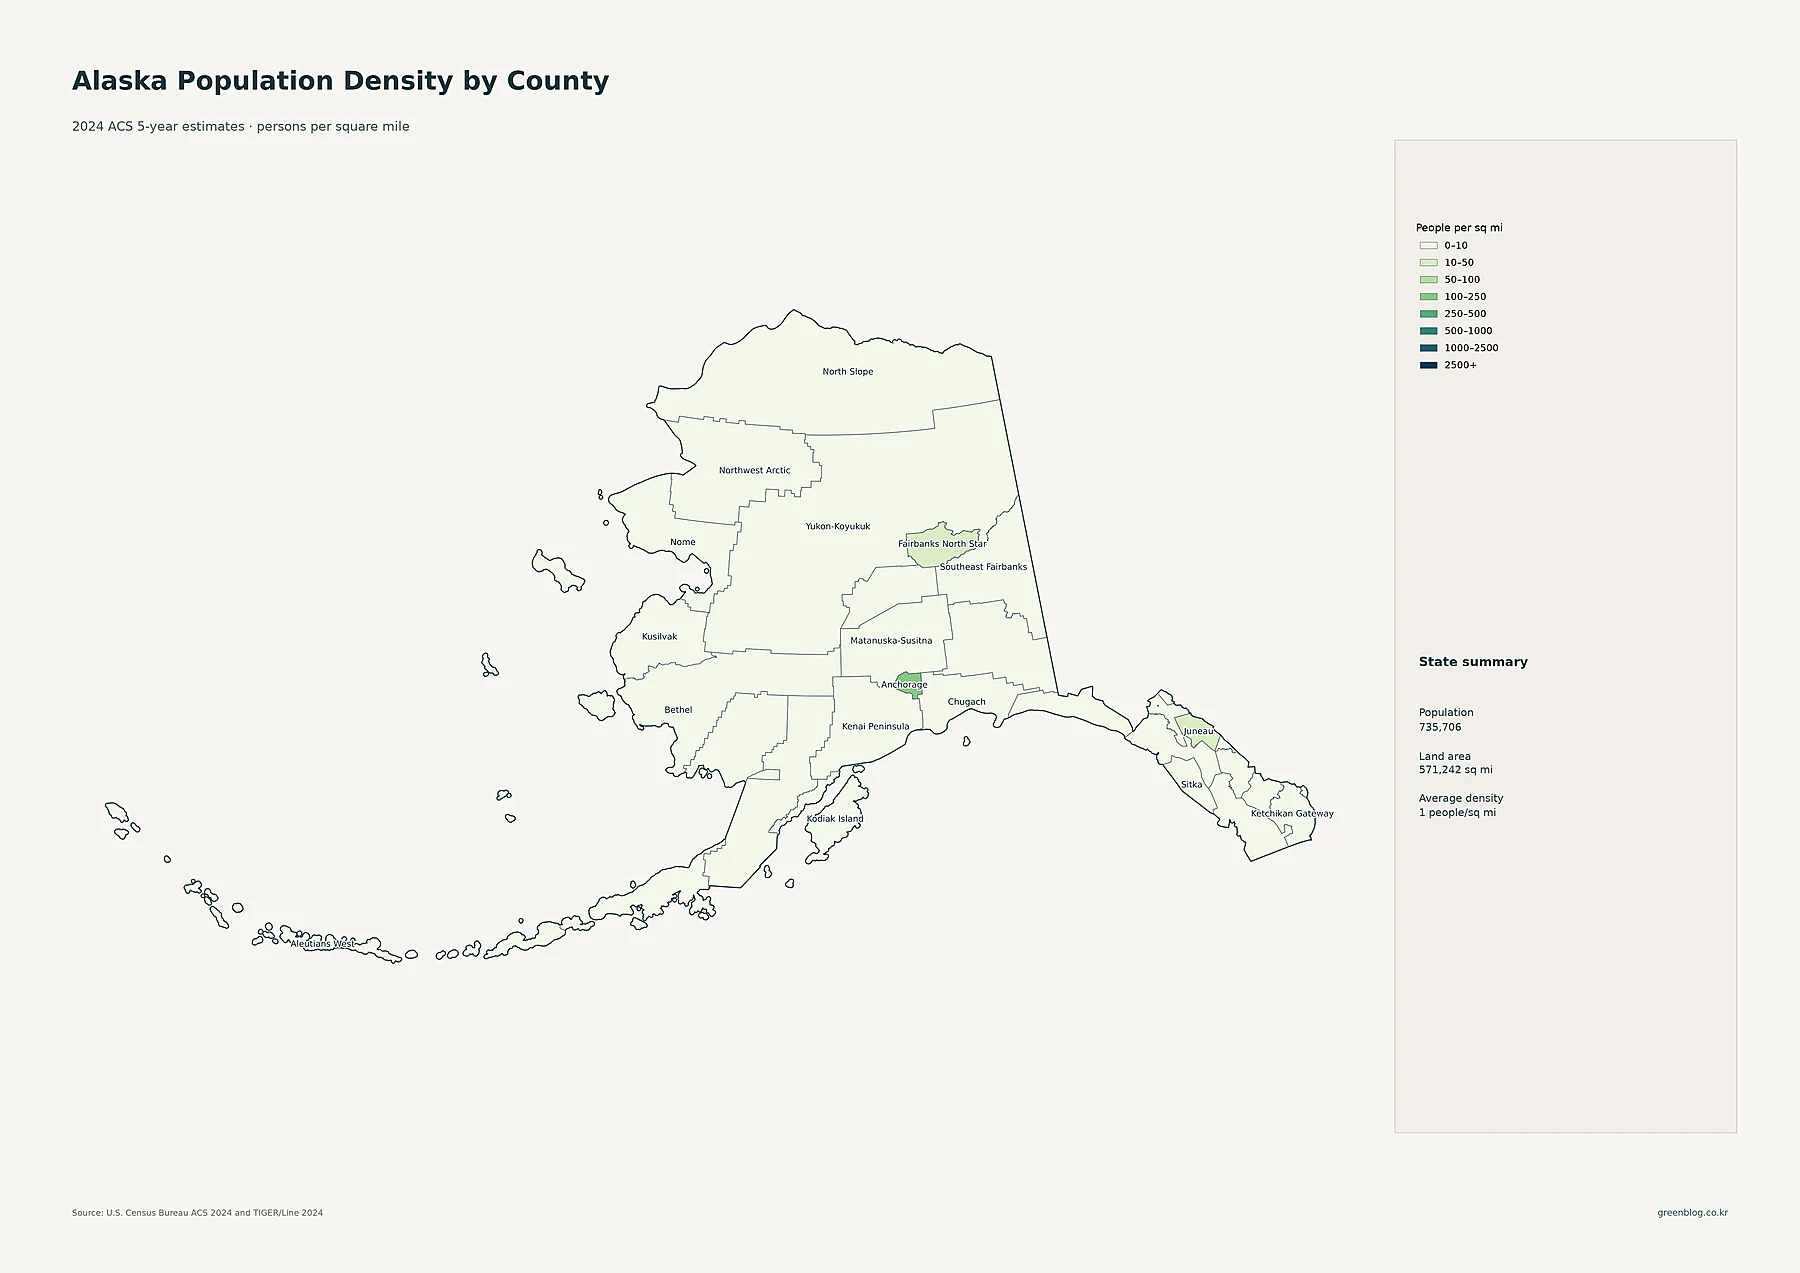
The county-equivalent density map returns to 2024 ACS 5-year estimates and measures people per square mile. Anchorage is the clear outlier in the supplied dataset at about 169.3 people per square mile. Fairbanks North Star is about 13.0, Juneau 11.8, Matanuska-Susitna 4.6, and Kenai Peninsula 3.8. At the other end, Yukon-Koyukuk is about 0.036 people per square mile, Lake and Peninsula about 0.043, and Yakutat about 0.069.
The state summary printed on the map lists 735,706 residents and 571,242 square miles of land, with average density rounded to about one person per square mile. That statewide number is accurate as a broad summary but it does not describe the lived geography of Alaska very well on its own. The tract map shows why: a large share of residents occupy a small number of compact settlement areas, while enormous sections of the state contain very few people.
How to use the five maps together
No single map answers every population question. The census-tract density map is best for finding compact concentrations inside large administrative areas. The cities map identifies the size and location of individual population centers. The total-population map compares boroughs and census areas without dividing by land area. The density map does divide by land area, revealing how dramatically Anchorage differs from huge, sparsely settled regions. Finally, the 2010–2020 map adds a time dimension and shows that growth and decline were not uniform across the state.
Taken together, the maps support a more precise description of Alaska than simply calling it sparsely populated. Anchorage is both the largest population center and the strongest density concentration. Fairbanks North Star forms a significant interior cluster, while Matanuska-Susitna has a large total population but a much lower average density because it covers far more land. Southeast communities create a string of smaller coastal centers. Beyond those clusters, the state’s vast interior, western, and northern areas generally show very low average density.
Download the Alaska population map collection
Alaska population map collection
The ZIP includes the detailed density map, major cities and urban areas, total population by county-equivalent area, 2010–2020 population change, and 2024 population density by county-equivalent area.
Frequently asked questions
Where is Alaska’s largest population concentration?
Anchorage is the largest population center in the supplied 2024 ACS data at 288,976 residents, and the detailed density map also shows the strongest cluster of high-density census tracts around Anchorage.
Why is a borough with a large population not always very dense?
Density divides population by land area. Matanuska-Susitna, for example, has a large total population but covers enough land that its average density is far below Anchorage. Total population and population density therefore answer different questions.
Does the change map use 2024 estimates?
No. The change map compares the 2010 and 2020 decennial Census counts. The other population and density maps use 2024 ACS 5-year estimates, so the periods should not be treated as interchangeable.
Related Maps
Sources
- U.S. Census Bureau — American Community Survey: 2024 ACS 5-year population and density estimates.
- U.S. Census Bureau — TIGER/Line Shapefiles: boundaries for census tracts, Census places, and county-equivalent areas.
- U.S. Census Bureau — 2020 Census: decennial Census context for the 2010–2020 population-change map.
Green Map creates custom-edited map images using open geographic data sources such as geoBoundaries, Natural Earth, OpenStreetMap, and government open data.
These maps are edited visual materials, not raw data files, and are provided for education, documents, presentations, and graphic reference.