The Miami-Dade County Florida Land Cover Map is defined by one of the strongest east-west contrasts in the supplied Florida set. Wetlands occupy 68.23% of the county, while developed land accounts for 22.11%. Water covers 4.57%, agriculture 3.96%, barren land 0.47%, forest 0.42%, shrubland 0.17%, and grassland 0.07%. On the 2025 map, the enormous wetland area in the west meets a dense developed zone across the east and northeast, with a distinct agricultural concentration farther south.
This page includes four views of that same county: 2025 land cover, forest and farmland, impervious surface and developed land, and a 1985–2025 class-difference map. The four original JPG maps are available together in one ZIP download below. They work best as county-scale reference graphics for teaching, presentations, environmental context, and comparisons among wetlands, urban surfaces, agriculture, and mapped change. Land cover describes what is covering the ground; it does not by itself establish zoning, ownership, legal land use, or property boundaries.
Table of Contents
The 2025 map puts the urban Atlantic side beside a vast wetland west
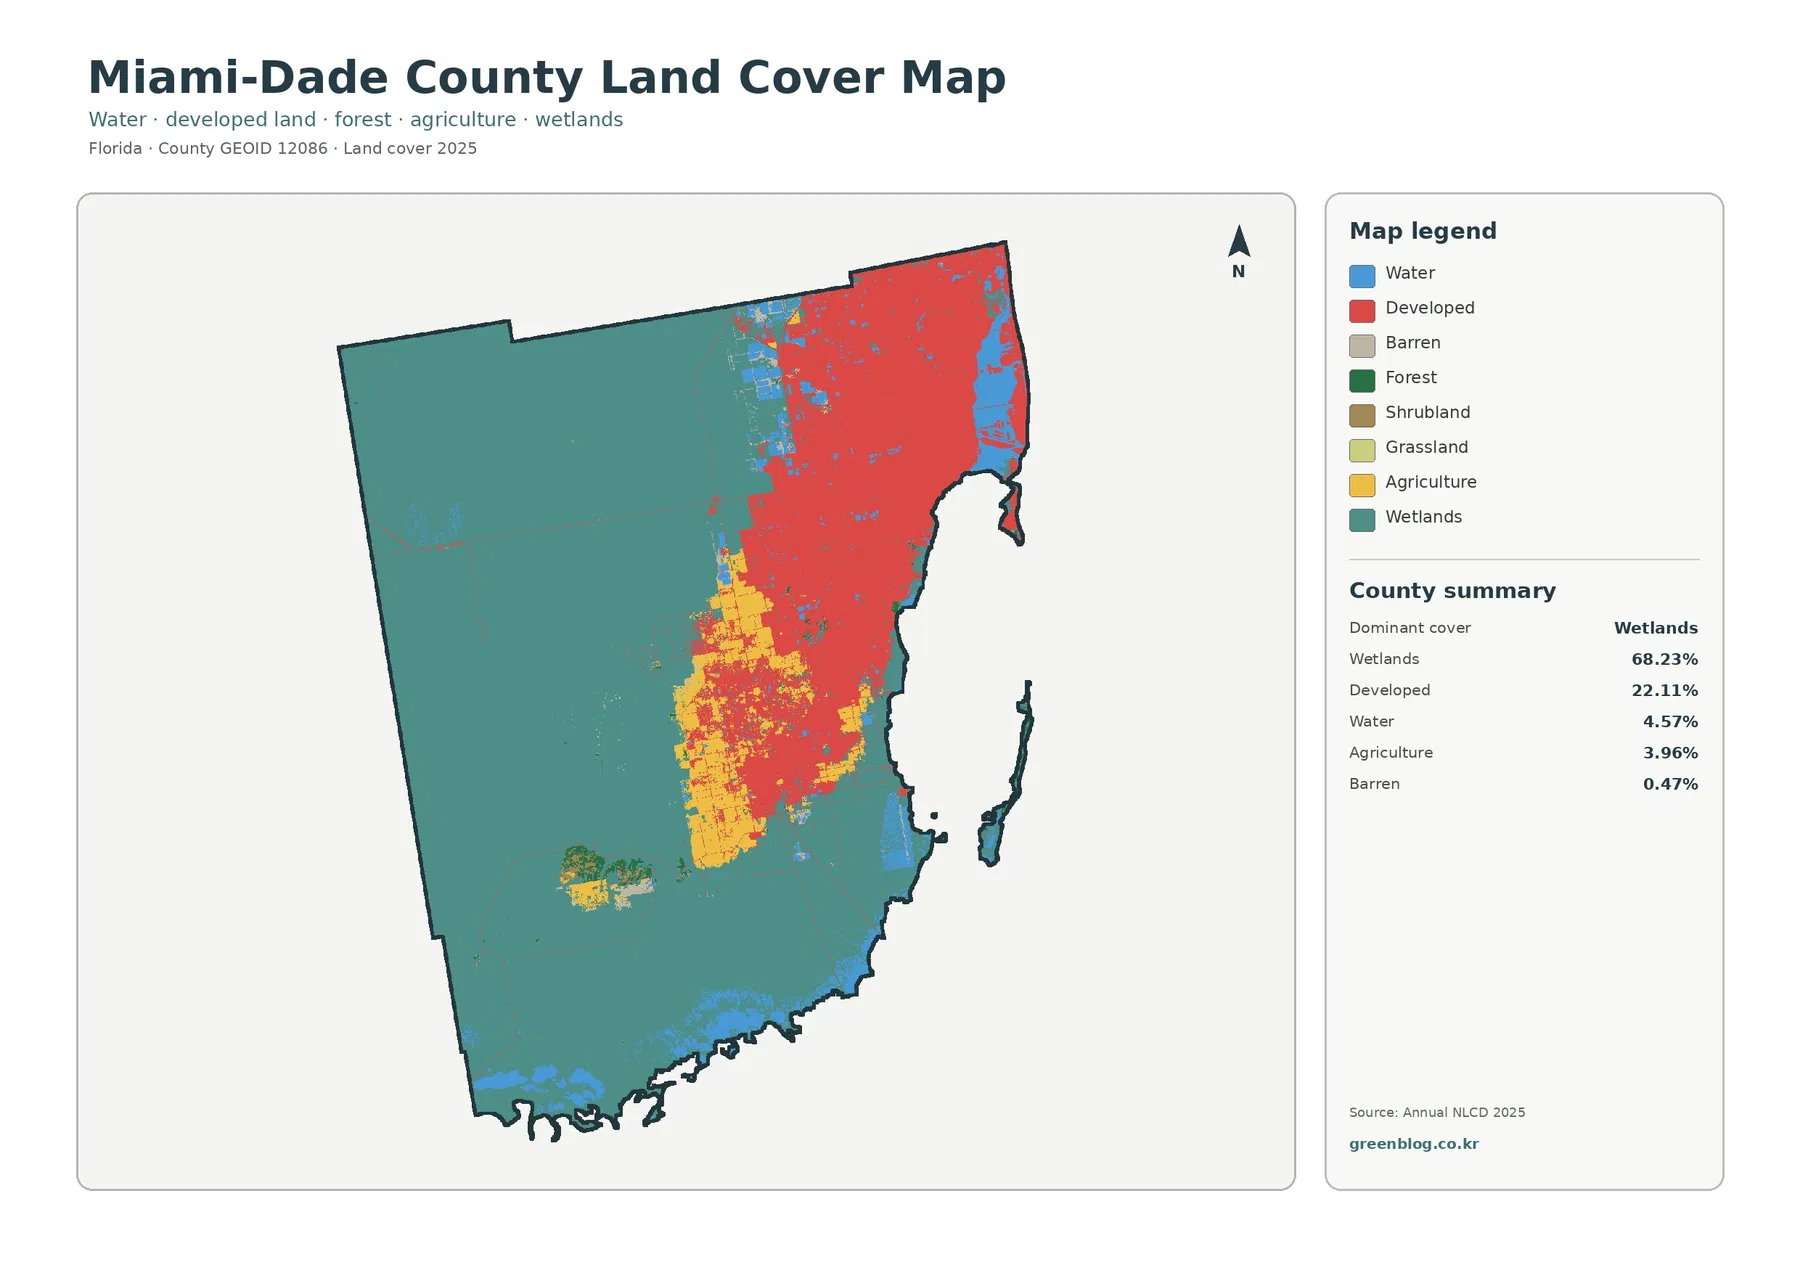
Wetlands immediately control the western half of the image and continue across much of the south. The 68.23% county summary is therefore not the result of scattered small wet patches. It reflects a very large, nearly continuous wetland surface extending from the western boundary toward the developed part of the county. Smaller wetland areas also appear along the southern and coastal margins, so the wetland class remains important even outside the broad western block.
Developed land creates the opposite pattern. Although 22.11% is far below the wetland share, its red color is concentrated across the northeast and the eastern side, where it forms a large connected area. Development continues southward in a narrower belt and mixes with agricultural cover in South Dade. This concentration makes developed land look visually dominant in the urban portion of the map even though it occupies less than one quarter of the county as a whole.
The water class, at 4.57%, is easiest to see along the eastern coast, Biscayne Bay, and parts of the southern shoreline. Water should not be combined with the 68.23% wetland figure. Open water is mapped as a separate class, while wetlands can include saturated or seasonally wet ground with vegetation. The distinction matters in Miami-Dade because a reader who counts only blue areas would miss most of the county’s mapped wet environment.
Agriculture represents 3.96% of the county and forms a conspicuous yellow concentration in the south-central portion of the map. The percentage is modest, but the land is clustered enough to remain easy to recognize. It lies between extensive wetlands to the west and south and developed or other surfaces to the east and north. That position becomes clearer on the forest-and-farmland view, where urban colors are reduced and the working-land pattern receives more attention.
South Dade farming becomes easier to trace when urban colors recede
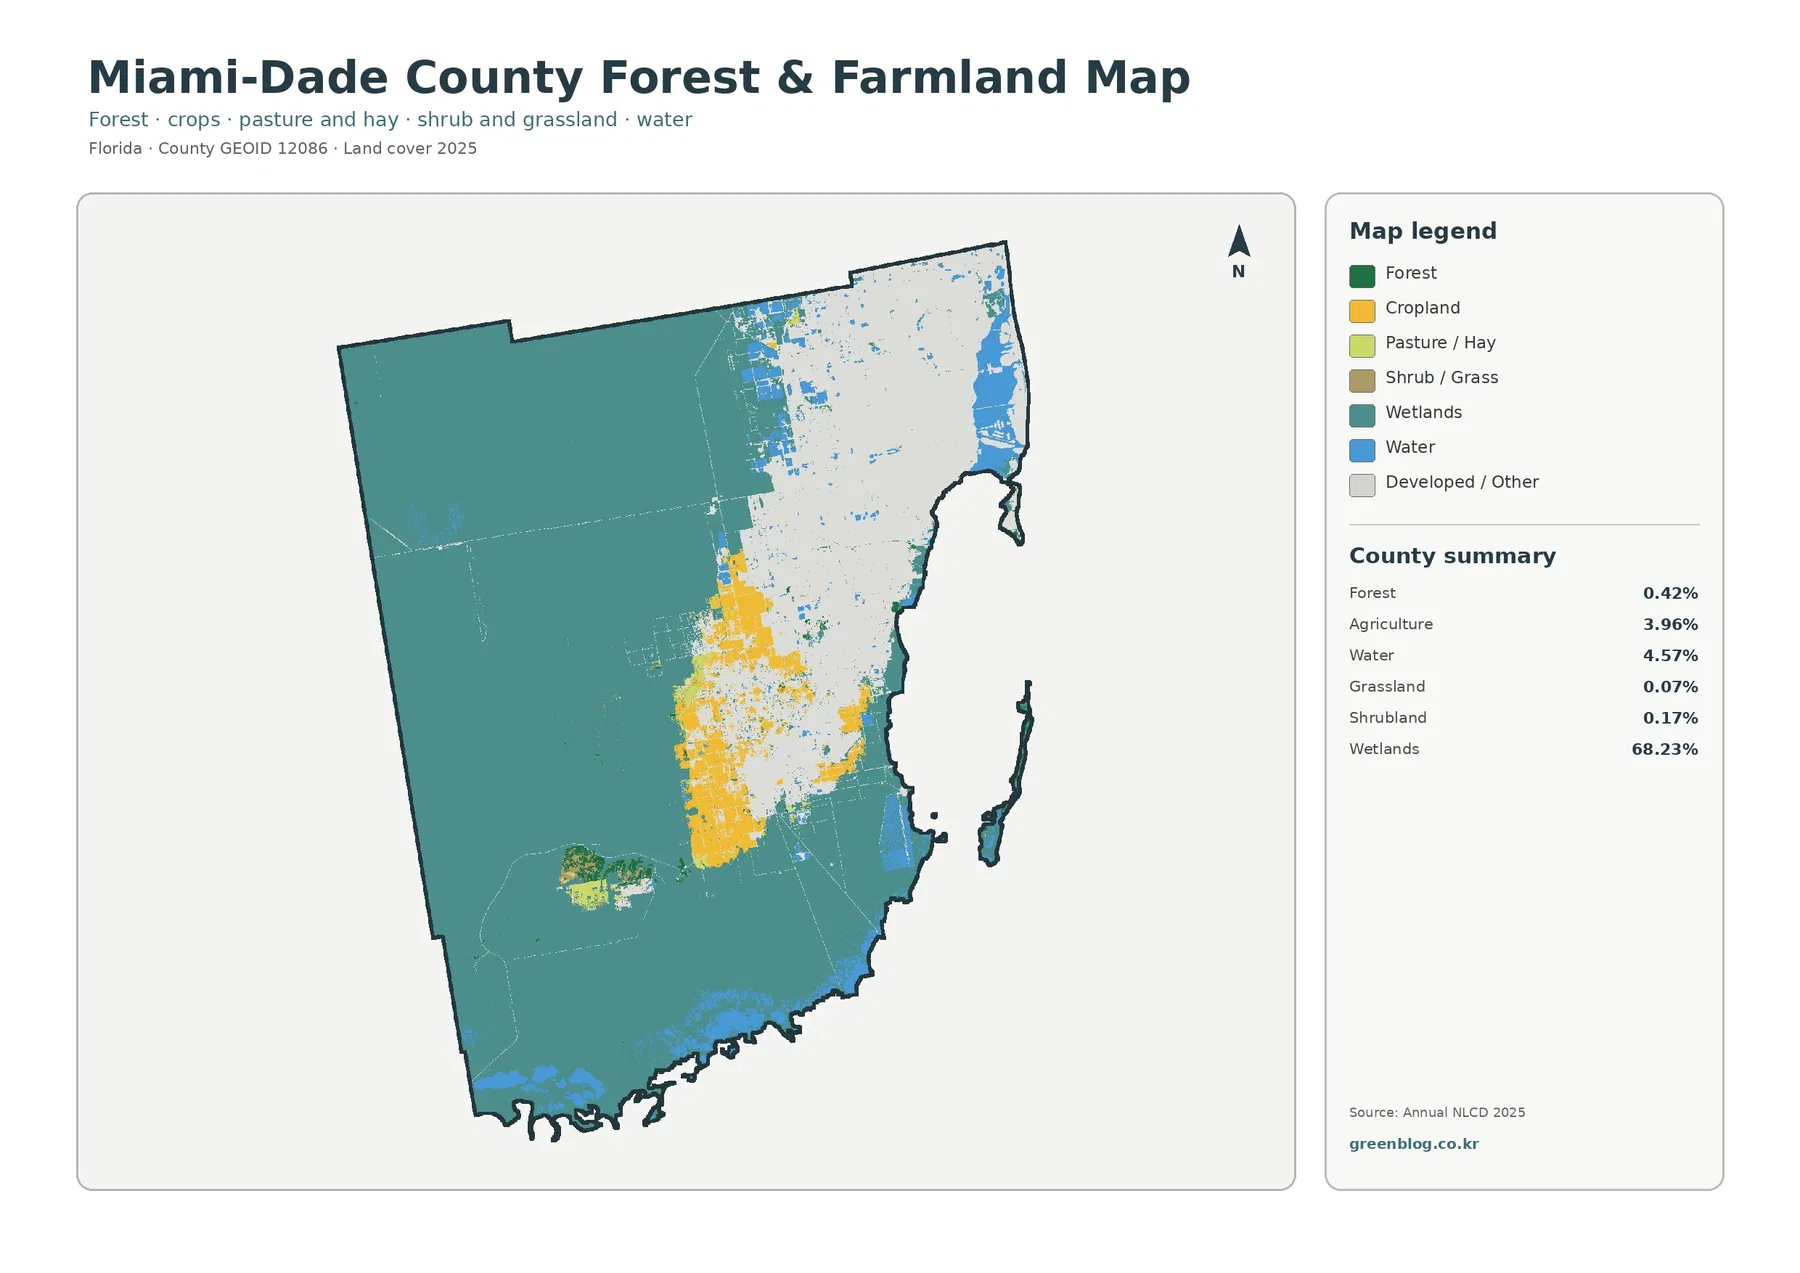
The focused vegetation map changes what draws the eye. Cropland and other agricultural colors in the south-central county are much easier to follow because the broad developed category is pushed into a neutral background. The 3.96% agricultural share remains the verified county-level figure supplied with the map, so the different crop and pasture colors should not be converted into separate percentages by visual estimation.
Miami-Dade County’s official agriculture page describes a diverse agricultural industry supported by a tropical climate and a year-round growing season. That county context is useful here because the agricultural colors are not randomly scattered across the entire map. They are concentrated in South Dade, where larger yellow blocks and smaller adjoining patches form a recognizable working-land area between the metropolitan east and the vast wetland landscape to the west.
The map also shows why agriculture should not be read as a set of surveyed farm parcels. Annual NLCD is a raster product: the landscape is divided into grid cells, and each cell receives a dominant classification. One real-world cell can include a field edge, a road, a canal, a building, and vegetation at the same time. Straight-looking edges in the image therefore describe classified cells, not necessarily legal property lines.
Impervious cover separates urban intensity from the broader developed class
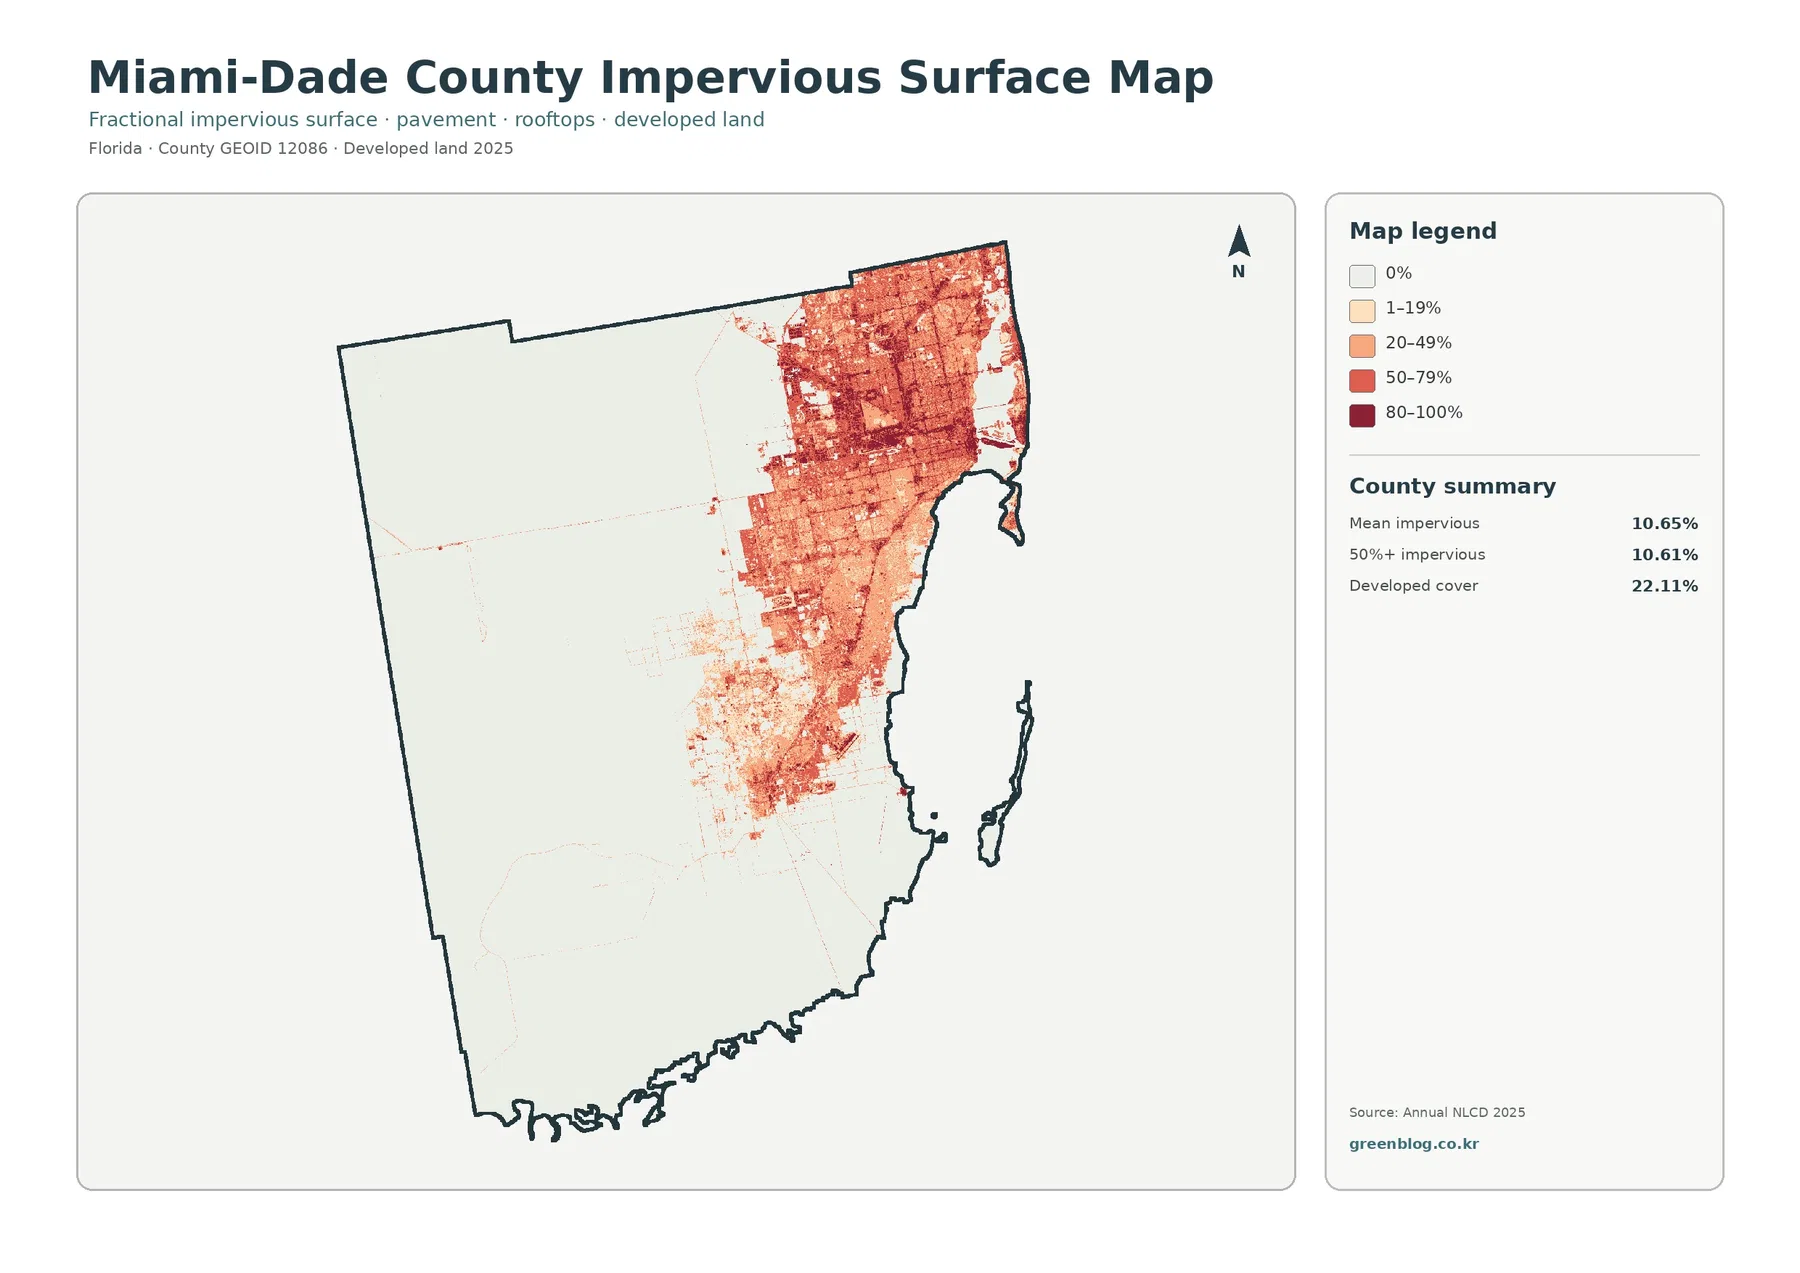
The general map tells us that 22.11% of Miami-Dade is classified as developed, but it does not tell us how much of each developed cell is actually hard surface. The impervious map addresses that question. Mean impervious cover is 10.65%, and 10.61% of the county is mapped at 50% or greater impervious surface. The two statistics are close in number but describe different measures: one is a countywide average, while the other is the share of area above a high impervious threshold.
High values cluster strongly in the northeast and across the eastern metropolitan belt. Darker orange and red areas form a dense texture there, while additional hard-surface concentrations extend southward. Fine linear marks and block-like patterns are visible, but this is not a road map. The image does not identify route names, lane counts, traffic volumes, or pavement conditions; it only records the fraction of surface classified as impervious.
Developed cover and impervious cover should not be treated as interchangeable. A developed land-cover cell may include lawns, trees, yards, drainage areas, and other permeable surfaces along with roofs and pavement. Impervious cover isolates the hard fraction. That is why the 22.11% developed share can be much larger than the 10.65% countywide mean impervious value without any contradiction.
The change view highlights a 4.24% shift into the developed category
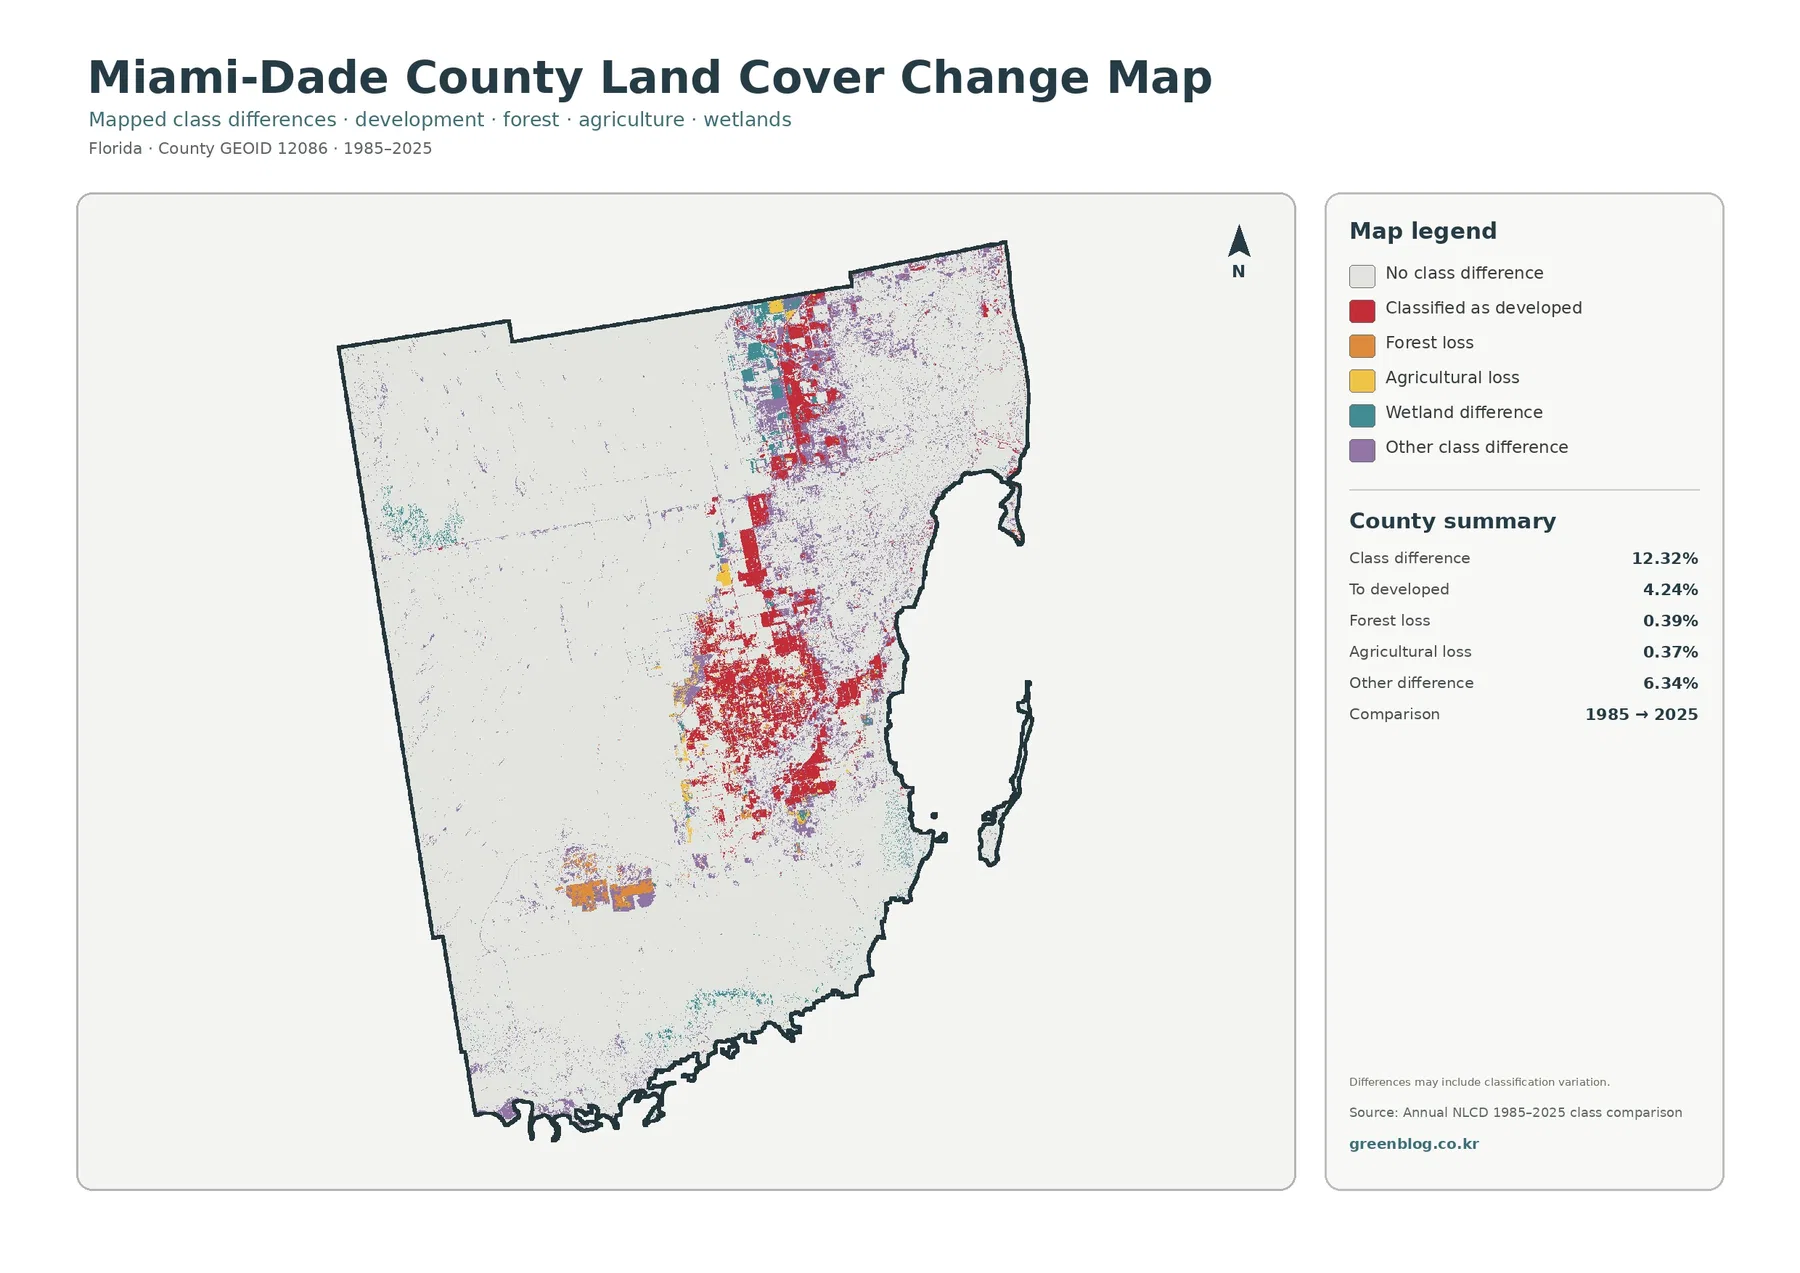
The two-date comparison reports a total class difference of 12.32%. That number should be read literally: 12.32% of the mapped cells fall into a different comparison category between 1985 and 2025 under the method used for this graphic. It should not be rewritten as ‘12.32% of Miami-Dade was destroyed’ or even as a precise measure of all physical land transformation. The map notes that classification variation can be included in the differences.
Cells highlighted as changing to developed account for 4.24% of the county. Red marks are concentrated along the eastern and south-central portions of the map, with some of the densest groups beside or within the present developed belt. The change value is not the same as the current 22.11% developed share. The 2025 percentage describes the latest surface classification, while 4.24% identifies cells assigned to a highlighted change category in the two-date comparison.
Other class difference accounts for 6.34%, the largest separately quantified change category in the summary. Wetland difference is also included in the legend, but the supplied county summary does not give it a standalone percentage. The correct approach is to describe its visible distribution without inventing a number from the pixels. Teal wetland-difference marks appear in several places, including parts of the west and south, but their exact area requires source-data calculation.
Biscayne Bay explains the eastern water edge, but the map is not a habitat boundary map
Miami-Dade County describes Biscayne Bay as a shallow subtropical estuary along southeastern Florida, with mangrove shorelines, developed and undeveloped islands, and other marine habitats. The land-cover map reflects the broad geographic setting by showing open water along the eastern edge and wetland cover in coastal and southern areas. It does not, however, map seagrass beds, coral habitat, aquatic preserves, or every management boundary identified by county environmental programs.
The county’s environmental and planning materials also place major emphasis on the Everglades, wetlands, Biscayne Bay, and natural-resource protection. The supplied map’s huge western wetland block is consistent with that regional setting. Still, it would be inaccurate to draw Everglades National Park boundaries from the wetland color alone. The map classifies surface cover across the county; it does not label park ownership or jurisdiction.
Frequently Asked Questions
What is the dominant land-cover class in Miami-Dade County?
Wetlands are the dominant class in the supplied 2025 summary at 68.23%. Developed land follows at 22.11%, with water at 4.57% and agriculture at 3.96%. Barren land is 0.47%, forest 0.42%, shrubland 0.17%, and grassland 0.07%. The map also makes the dominance visible: wetlands occupy most of the western county and extend into southern and coastal areas.
Why is developed cover 22.11% while mean impervious cover is 10.65%?
Developed land is a broader land-cover category that can include lawns, trees, yards, drainage areas, and other permeable surfaces in the same classified cell as buildings and pavement. Impervious cover isolates hard surfaces such as rooftops, roads, and parking areas. Because the measures describe different parts of the landscape, the countywide mean impervious value can be much lower than the developed share.
Does the 12.32% class difference mean that 12.32% of Miami-Dade was physically transformed?
No. It is the share of cells placed in a different comparison category between the 1985 and 2025 classifications used for this map. The graphic notes that classification variation may be included. The highlighted change-to-developed category is 4.24%, forest loss 0.39%, agricultural loss 0.37%, and other difference 6.34%. Determining the cause of change at a specific site requires additional imagery or records.
Scale and classification rules set the limits of what the JPGs can prove
Annual NLCD represents the ground as raster cells rather than surveyed parcels. Each cell receives a dominant class even though real places can contain several surfaces at once. Mixed pixels are especially likely along wetland edges, canal margins, farm boundaries, road corridors, and the transition between urban development and open land. A sharp color edge on the map should therefore not be assumed to match a property line on the ground.
The 2025 view represents the supplied observation year. Development, restoration, construction, crop rotation, vegetation change, or flooding after that date may not be reflected. Likewise, the 1985–2025 map compares two endpoints rather than providing a continuous history. A site could change several times between those dates and still end in a class similar to its starting point.
Download the four original JPG land-cover maps
The ZIP package contains the same four Miami-Dade County maps used in this article: 2025 land cover, forest and farmland, impervious surface and developed land, and the 1985–2025 class-difference view. The files can be saved separately for printing, presentations, classroom handouts, or side-by-side comparison without relying on the smaller WebP previews shown in the page body.
Map File Information
The ZIP contains the four original JPG land-cover maps used for this Miami-Dade County article.
- Included Files: Use only the versions confirmed in the article and supplied images
- File Type: Use the confirmed download contents
- Intended Use: Printing, education, presentations, and map-based projects
Related Maps
- Alachua County Florida Land Cover Map
- Baker County Florida Land Cover Map
- Bay County Florida Land Cover Map
Sources and Reference Data
- MRLC Annual NLCD Data – source portal for the Annual NLCD land-cover and comparison data used for the supplied map set.
- USGS Annual NLCD Land Cover Classification – definitions and background for developed, wetland, agriculture, forest, water, and other classes.
- U.S. Census Bureau TIGER/Line Shapefiles – official geographic boundary reference for Miami-Dade County.
- Miami-Dade County – About Biscayne Bay – county description of the bay’s shallow subtropical estuary and coastal environmental setting.
- Miami-Dade County Agriculture – official county background on the region’s diverse agricultural industry and growing conditions.
- Miami-Dade County Comprehensive Development Master Plan – official long-range framework for development, conservation, and natural-resource planning.
Green Map creates custom-edited map images using open geographic data sources such as geoBoundaries, Natural Earth, OpenStreetMap, and government open data.
These maps are edited visual materials, not raw data files, and are provided for education, documents, presentations, and graphic reference.