Lafayette County is a small rural county in Florida’s Big Bend, and its 2025 land-cover map is dominated by wetlands rather than developed land. Wetlands account for 45.61% of the county, forest for 25.49%, agriculture for 13.93%, and developed land for 6.19%. The strongest wetland presence appears through much of the south and west, while agriculture is more visible across the north and parts of the central and eastern county. Forest is distributed between those areas instead of being confined to one corner.
This page combines four map views: 2025 land cover, forest and farmland, impervious surface, and a 1985–2025 land-cover class comparison. WebP versions are shown on the page, and the four original JPG files are available together in one ZIP download below. The maps are useful for county reference, classroom work, presentations, and broad comparisons of wetlands, forest, working land, and developed surfaces. They are land-cover products, not parcel, zoning, ownership, or development-right maps.
Table of Contents
Wetlands cover 45.61% of Lafayette County in the 2025 summary
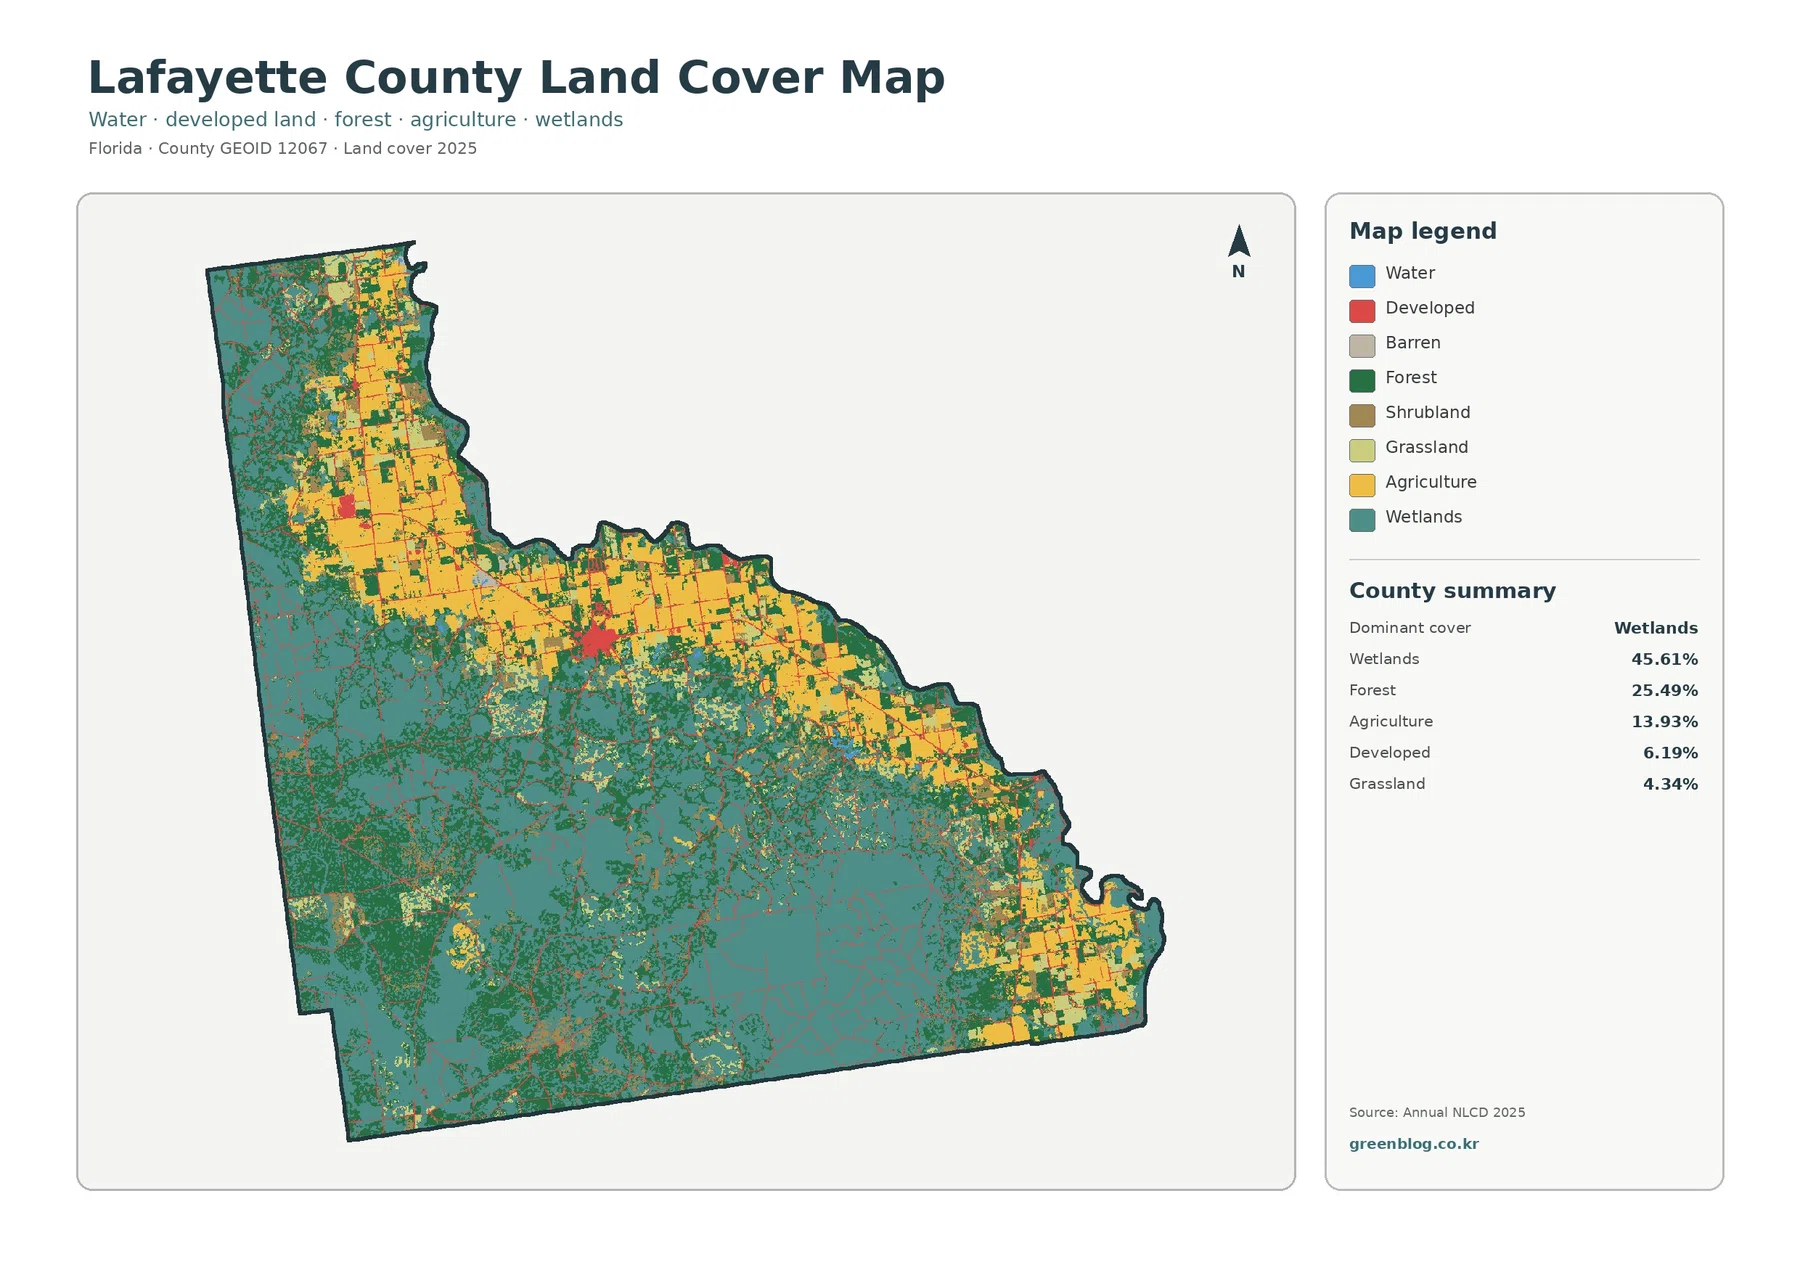
Teal wetland cover is the most extensive color on the general land-cover map. It fills broad areas of the south and west and remains common through the center, matching the 45.61% county summary. A land-cover wetland class is a satellite-based description of surface conditions and should not be treated as a legal wetland boundary. Some mapped wetlands may be wooded, grassy, or seasonally wet, and regulatory determinations require different data.
Forest is the second-largest class at 25.49%. Dark green appears across western and southwestern areas, through parts of the center, and in smaller tracts among the northern agricultural blocks. This pattern makes the county look less like a simple split between farms and wetlands. Forest repeatedly separates and connects the other major cover types, especially where wooded land borders wet areas.
Agriculture accounts for 13.93%. Yellow agricultural areas are most noticeable in the north, with additional blocks through the central-to-eastern portion and in the southeast. The pattern is patchy rather than continuous, and many farm areas are bordered by forest or wetlands. UF/IFAS Extension Lafayette County provides agriculture and natural-resources education, offering useful local context for the importance of working lands in this rural county.
Developed land is 6.19%, grassland 4.34%, shrubland 3.89%, and water 0.42%. Developed areas are small compared with the county’s wetland and forest cover. Water is a very small mapped share, so blue areas are limited even though the county has important river geography. Reading the percentages together with the actual map positions gives a more useful picture than ranking the categories alone.
The forest-and-farmland view highlights a farm-rich north and a wetter south
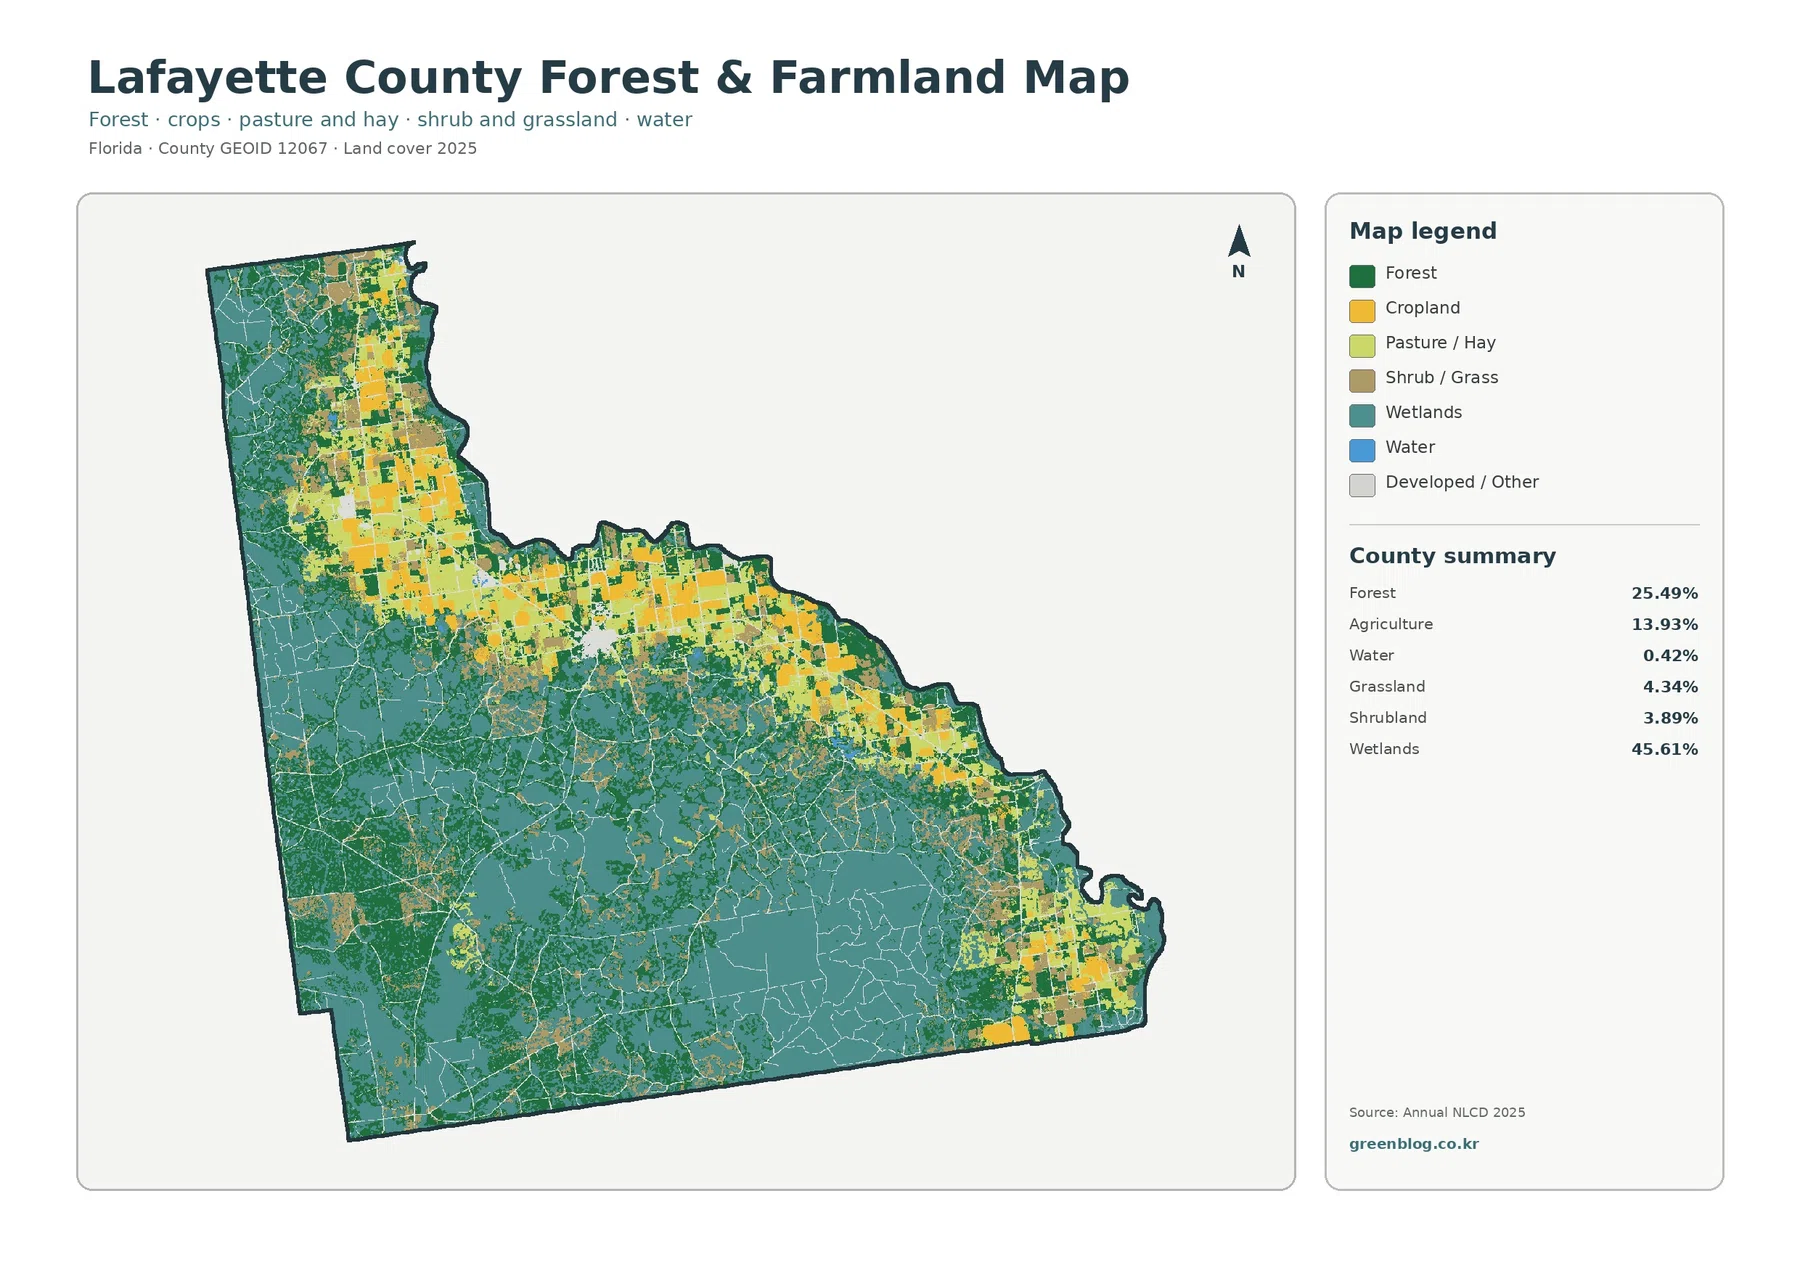
The forest-and-farmland map reduces some of the general land-cover detail so agriculture and forest are easier to compare. Yellow working-land areas stand out most strongly in the north and northeast, while the south and west are dominated by wetlands and forest. The center is more mixed, with agriculture, woodland, and wet ground repeatedly meeting within short distances.
Lafayette County’s official history page states that the Suwannee River forms the county’s entire eastern boundary. That fact is useful geographic context when reading the map, but the land-cover colors do not trace a legal river corridor. Wetland and natural cover near the eastern boundary may be associated with riverine settings, yet individual teal areas should not automatically be labeled as part of a specific river wetland without additional hydrologic data.
Mayo is the county seat and, according to the official county page, the county’s only incorporated town. On the forest-and-farmland and impervious maps, the central settlement area is more apparent than it is on the general land-cover view. Outside that small center, agriculture and natural cover quickly become dominant. This is a useful contrast for readers who might otherwise assume that a developed class represents a broad urban footprint.
Agricultural pixels do not identify crop type, farm ownership, or zoning. They represent places assigned to an agricultural land-cover class in the source data. For a report or classroom exercise, the 13.93% agriculture figure is most useful when paired with its spatial pattern: stronger in the north, mixed through the center, and less dominant across the large wetland areas in the south.
Mean impervious cover is only 1.04%, with hard surfaces concentrated in small areas
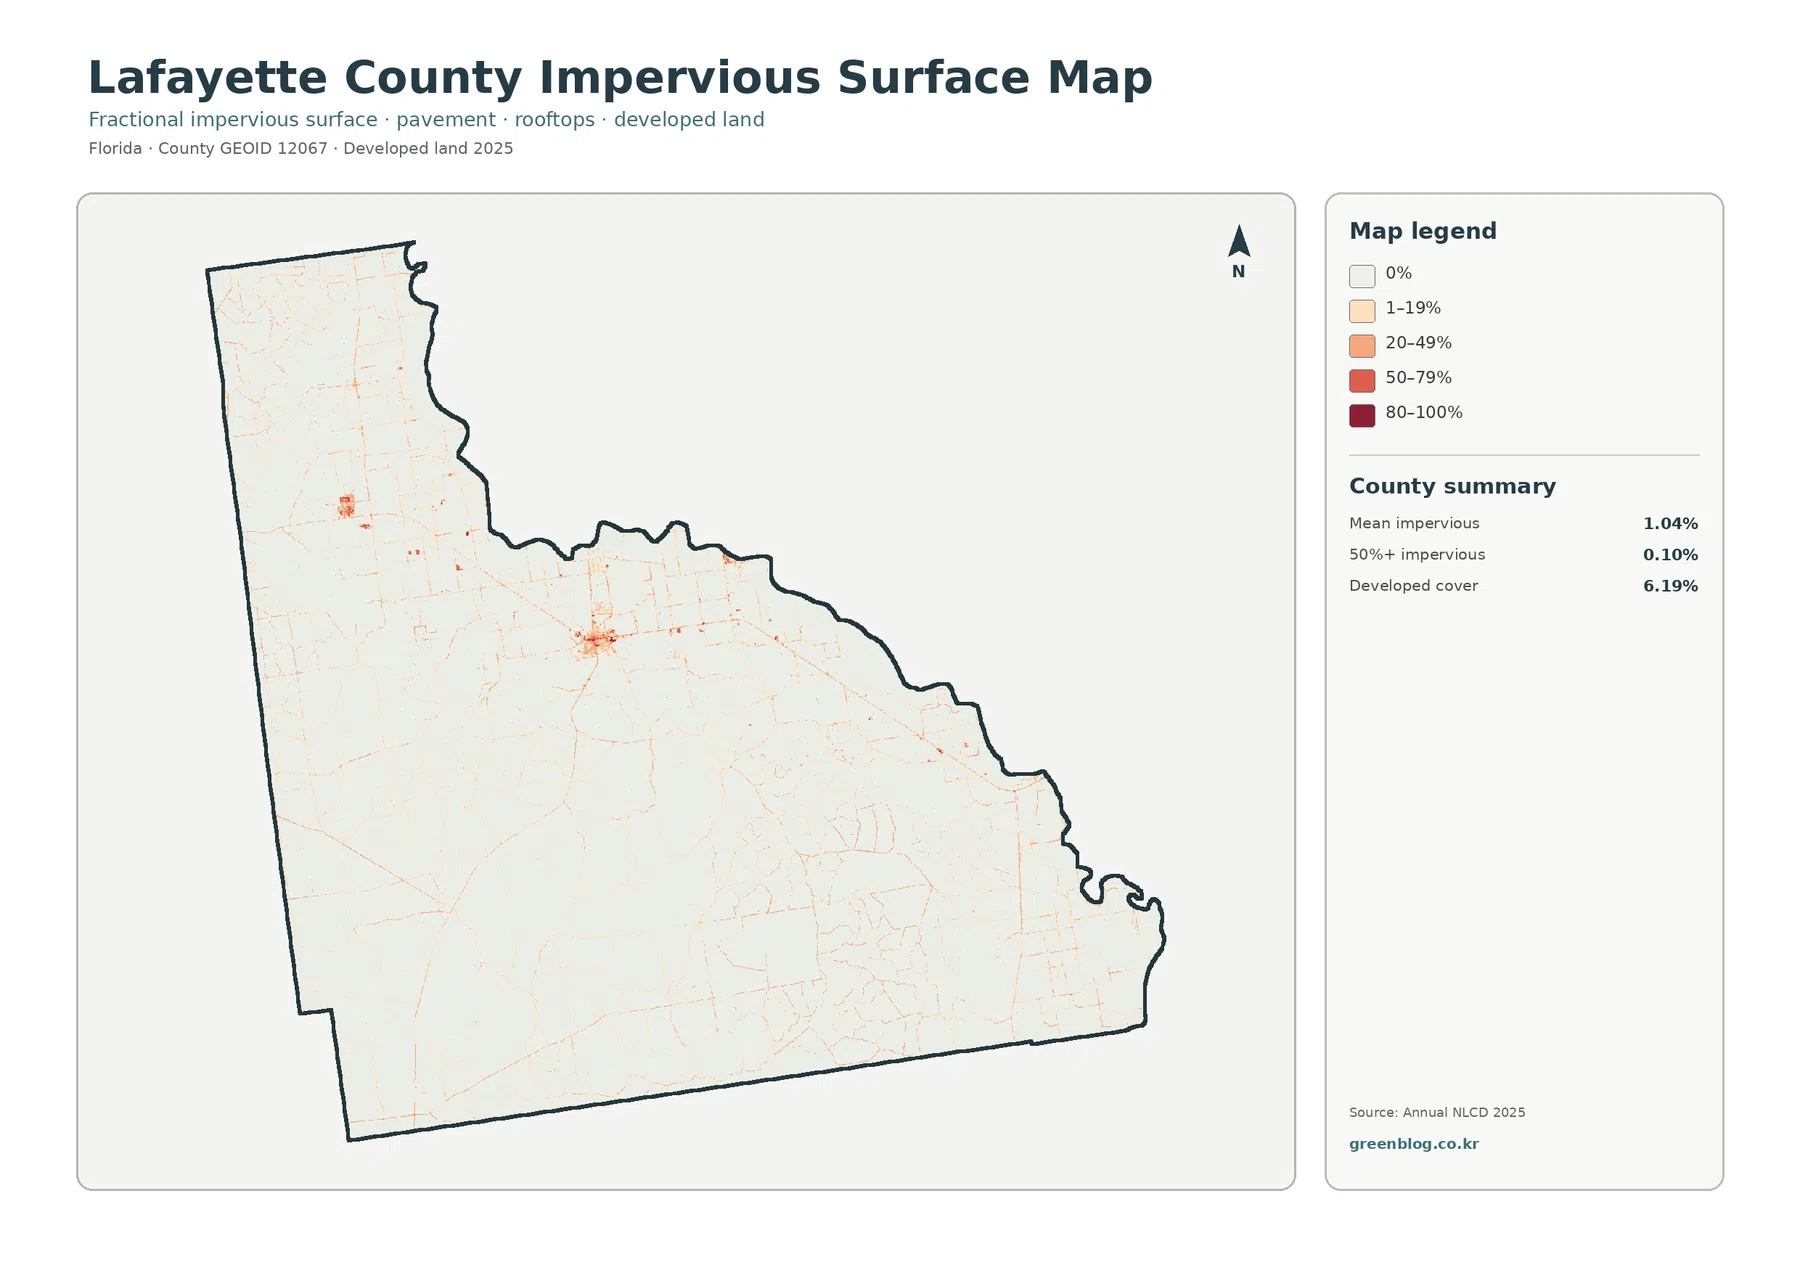
Impervious surface refers to hard cover such as pavement, parking areas, and rooftops that does not readily absorb rainfall. Lafayette County’s mean impervious value is 1.04%, and only 0.10% of the county is mapped at 50% or greater imperviousness. Those values are far below the 6.19% developed-land share because developed areas can include lawns, trees, bare soil, and other surfaces that still allow water to infiltrate.
The darkest impervious colors are limited. A small concentration appears around the county’s central settlement area, with thin lines along parts of the road network and a few smaller spots elsewhere. Most of the county is very pale on this map. That visual pattern fits a place where wetlands, forest, and agricultural land occupy most of the county and dense hard surfaces are uncommon.
A low impervious percentage does not mean that flooding or drainage concerns are absent. Flood behavior depends on elevation, soils, rainfall, river levels, wetlands, drainage infrastructure, and other factors. The impervious map is useful for comparing the concentration of hard surfaces, but flood-risk decisions require official flood maps and additional site-specific information.
The same limitation applies to planning and real-estate questions. Impervious cover does not indicate zoning, building rights, parcel ownership, or permit status. Those topics belong to county planning and property records. This map is best used to understand how concentrated or dispersed hard surfaces are across the county as a whole.
The 1985–2025 comparison reports a 21.72% class difference
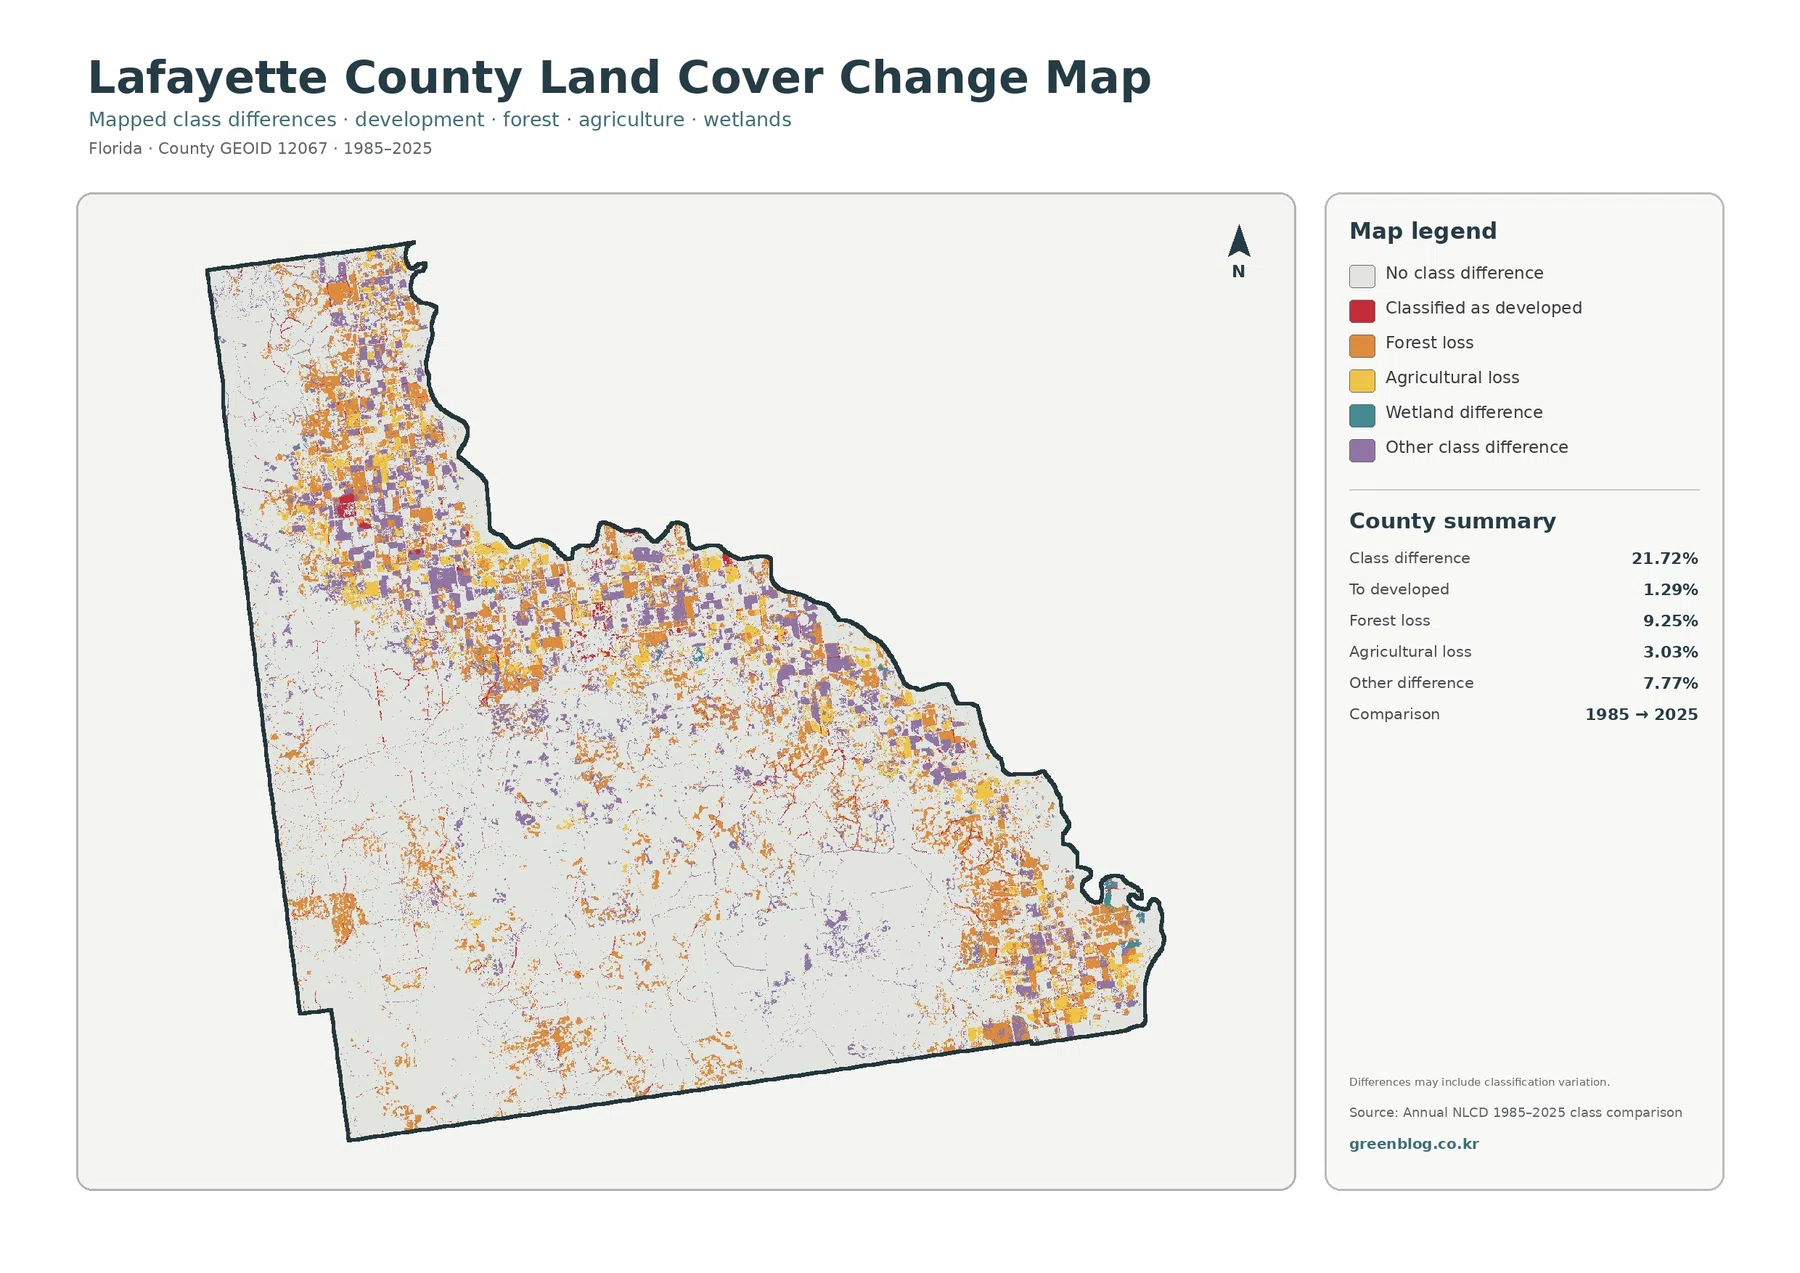
The 1985–2025 map reports class differences across 21.72% of Lafayette County. Forest loss is listed at 9.25%, agricultural loss at 3.03%, transition to developed at 1.29%, and other class difference at 7.77%. The change colors are especially common across the north and central parts of the county, with additional areas in the southeast and scattered portions of the west.
Orange forest-loss areas occur in several parts of the county rather than in one continuous zone. Agricultural-loss colors are also common around northern and central working-land areas. Red developed transitions are smaller and more localized. These patterns can help identify places for follow-up, but proximity between colors should not be treated as proof that one class directly caused another to change.
The map includes an important note that class differences may contain classification variation. The 21.72% value therefore should not be treated as a literal percentage of ground that physically changed. Differences in imagery, observation dates, mixed pixels, and classification methods can assign different labels to the same place. Aerial photography and additional Annual NLCD years are better tools for confirming important locations.
Only two endpoints are compared here: 1985 and 2025. The map does not show when a change occurred, whether a location changed more than once, or how long an intermediate condition lasted. For long-term research, this layer is most useful as a screening map that points to areas worth examining in a fuller time series.
Mayo and the Suwannee River provide two useful geographic reference points
UF/IFAS Extension describes Lafayette as a small rural county in Florida’s Big Bend, and the official county history identifies Mayo as the county seat. The strongest developed and impervious concentration is small compared with the county’s total area, while agriculture becomes more visible to the north and natural cover dominates much of the south and west. This makes the county’s settlement pattern easy to compare with its much larger wetland and forest footprint.
The Suwannee River forms the eastern boundary, giving the county a clear natural edge. The land-cover maps, however, are not detailed hydrographic maps, so river channels, floodplains, and regulatory wetland boundaries should be checked in dedicated water-resource data. The river is most useful here as geographic context for understanding the county’s location and eastern edge.
For classroom use, a simple sequence works well: begin with the general map and identify wetlands as the dominant class, then use the forest-and-farmland map to compare the northern agricultural blocks with the wetter south. Next, check the impervious map to see how small the hard-surface footprint is, and finish with the change map to locate areas where 1985 and 2025 classifications differ.
For a county overview, it is also useful to present the three largest classes together. Wetlands at 45.61%, forest at 25.49%, and agriculture at 13.93% account for most of the mapped landscape. Their positions explain Lafayette County better than any single number: broad wet areas and forest dominate much of the county, while working land is more concentrated in the north and central portions.
Four original JPG maps are available for closer inspection and document use
The download ZIP contains the 2025 land-cover map, the forest-and-farmland map, the impervious/developed-land map, and the 1985–2025 land-cover comparison map. Each JPG is 2480×1754 pixels. The original JPG files are easier than the reduced WebP previews for enlarging legends, examining smaller color patches, and placing maps into reports or presentations.
The source is raster land-cover data, which means the landscape is represented as a grid and each cell receives a representative class or value. Real ground conditions are more complex than the sharp color boundaries suggest. One cell may contain trees, a road edge, grass, buildings, or water, so the map should not be used as a surveyed parcel boundary.
The four maps work best as a set. A developed patch on the general map can be checked against impervious intensity; agricultural blocks can be compared with neighboring forest and wetlands; and locations with a 1985–2025 class difference can be flagged for review in aerial imagery or other years. Using the maps together helps prevent broad conclusions based on a single color or percentage.
Frequently Asked Questions
What is the largest 2025 land-cover category in Lafayette County?
Wetlands are the largest mapped category at 45.61%. Forest follows at 25.49% and agriculture at 13.93%. The map shows the largest wetland areas through much of the south and west, while agricultural cover is more visible in the north and parts of the center.
Why is developed land 6.19% while mean impervious cover is only 1.04%?
The two measures describe different things. Developed land can include buildings and roads along with lawns, trees, soil, and other permeable surfaces. Impervious cover measures hard surfaces such as pavement and rooftops more directly, so its countywide average can be much lower.
Does the 21.72% 1985–2025 class difference equal the true land-change rate?
No. The map notes that classification variation may be included. Differences in imagery and classification can change the label assigned to a location even when the ground did not undergo the same type of physical change. Important areas should be checked with aerial imagery, other Annual NLCD years, or official records.
Map File Information
Download the four original Lafayette County land-cover JPG maps together in one ZIP file.
- Included Files: Use only the versions confirmed in the article and supplied images
- File Type: Use the confirmed download contents
- Intended Use: Printing, education, presentations, and map-based projects
Related Maps
- Alachua County Florida Land Cover Map
- Baker County Florida Land Cover Map
- Bay County Florida Land Cover Map
Sources and References
- MRLC Annual NLCD Data – Official source for Annual NLCD land-cover data.
- USGS Annual NLCD Land Cover Classification – Describes the main Annual NLCD land-cover classes.
- U.S. Census Bureau TIGER/Line Shapefiles – Official geographic boundary data for county reference.
- Lafayette County BOCC – About Lafayette County – Official background on Mayo and the Suwannee River boundary.
- UF/IFAS Extension Lafayette County – Local agriculture and natural-resources education and Extension information.
Green Map creates custom-edited map images using open geographic data sources such as geoBoundaries, Natural Earth, OpenStreetMap, and government open data.
These maps are edited visual materials, not raw data files, and are provided for education, documents, presentations, and graphic reference.