Jackson County sits in Florida’s inland Panhandle, where working farmland, forest, and wetlands all occupy substantial parts of the county. Agriculture is the largest 2025 land-cover category at 33.58%, but the map does not look like one continuous farm belt. Forest accounts for 23.30% and wetlands for 21.57%, so fields repeatedly meet wooded tracts and wetter ground across the county. Developed land is much smaller at 9.35%, with the clearest concentration around the Marianna area and along a limited road network.
This page brings together four views of the same county: the 2025 land-cover map, a forest-and-farmland view, an impervious-surface map, and a 1985–2025 class-comparison map. The WebP images are provided for on-page viewing, while the four original JPG maps are available together in one ZIP download below. They work well for county reference, classroom comparison, presentations, and projects that need a broad view of farms, wooded land, wetlands, water, and developed areas.
Table of Contents
Agriculture leads the 2025 summary, but forest and wetlands remain major parts of the county
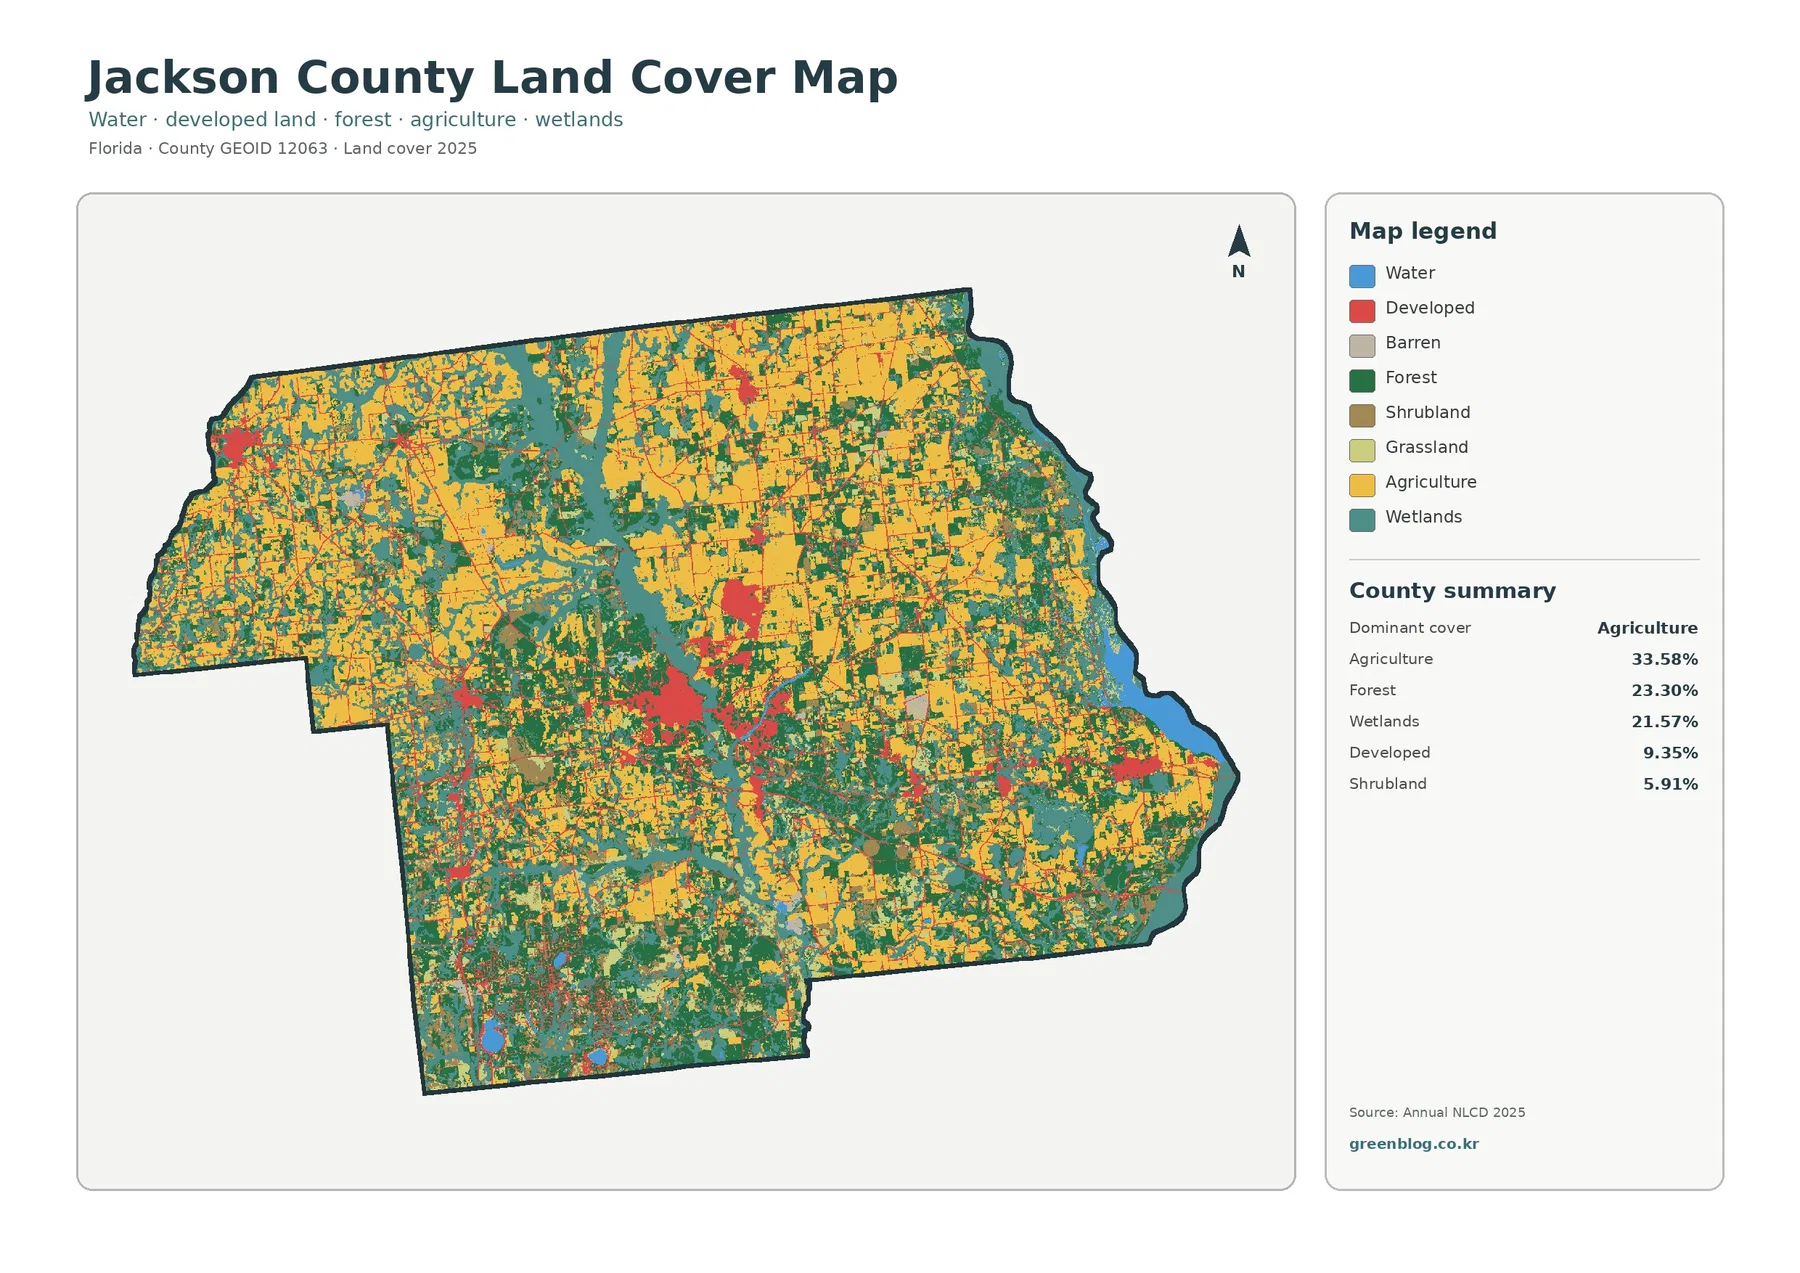
Yellow agricultural cover is the most widespread single category on the general map. Large farm blocks are especially noticeable across the northern half, with additional fields in the west, east, and around the edges of wooded areas. The 33.58% county summary confirms that agriculture is the leading class, yet the yellow areas are broken by forest, wetlands, roads, and small developed centers. That mixture is important because it keeps the county from reading as a uniform agricultural plain.
Forest is the second-largest category at 23.30%. Dark green appears through the center and south and continues in many separate tracts toward the north and east. Some wooded areas are broad enough to stand out immediately, while others form smaller pieces between fields and wetlands. For county-scale interpretation, this distribution matters more than simply ranking forest second: wooded cover is present in several parts of Jackson County rather than being confined to one corner.
Wetlands make up 21.57%, almost as much as forest. Teal areas are visible through the central and southern parts of the county, along the eastern side, and around water-connected low areas. Jackson County’s official website highlights the Chipola River and Jackson Blue Springs as important local natural resources, which provides useful geographic context for a county where wetlands and water are clearly part of the landscape. The mapped wetland class is still a satellite-based land-cover category, not a legal wetland delineation.
Developed land accounts for 9.35%, shrubland for 5.91%, grassland for 4.47%, and water for 1.46%. Red developed areas are easiest to see around Marianna and several smaller settlement or road locations. Water covers a relatively small share of the county total, but mapped blue areas along the eastern side and in the south remain visually important. These smaller categories are best interpreted by combining the percentage summary with their actual position on the map.
The forest-and-farmland view makes the north-to-center contrast easier to compare
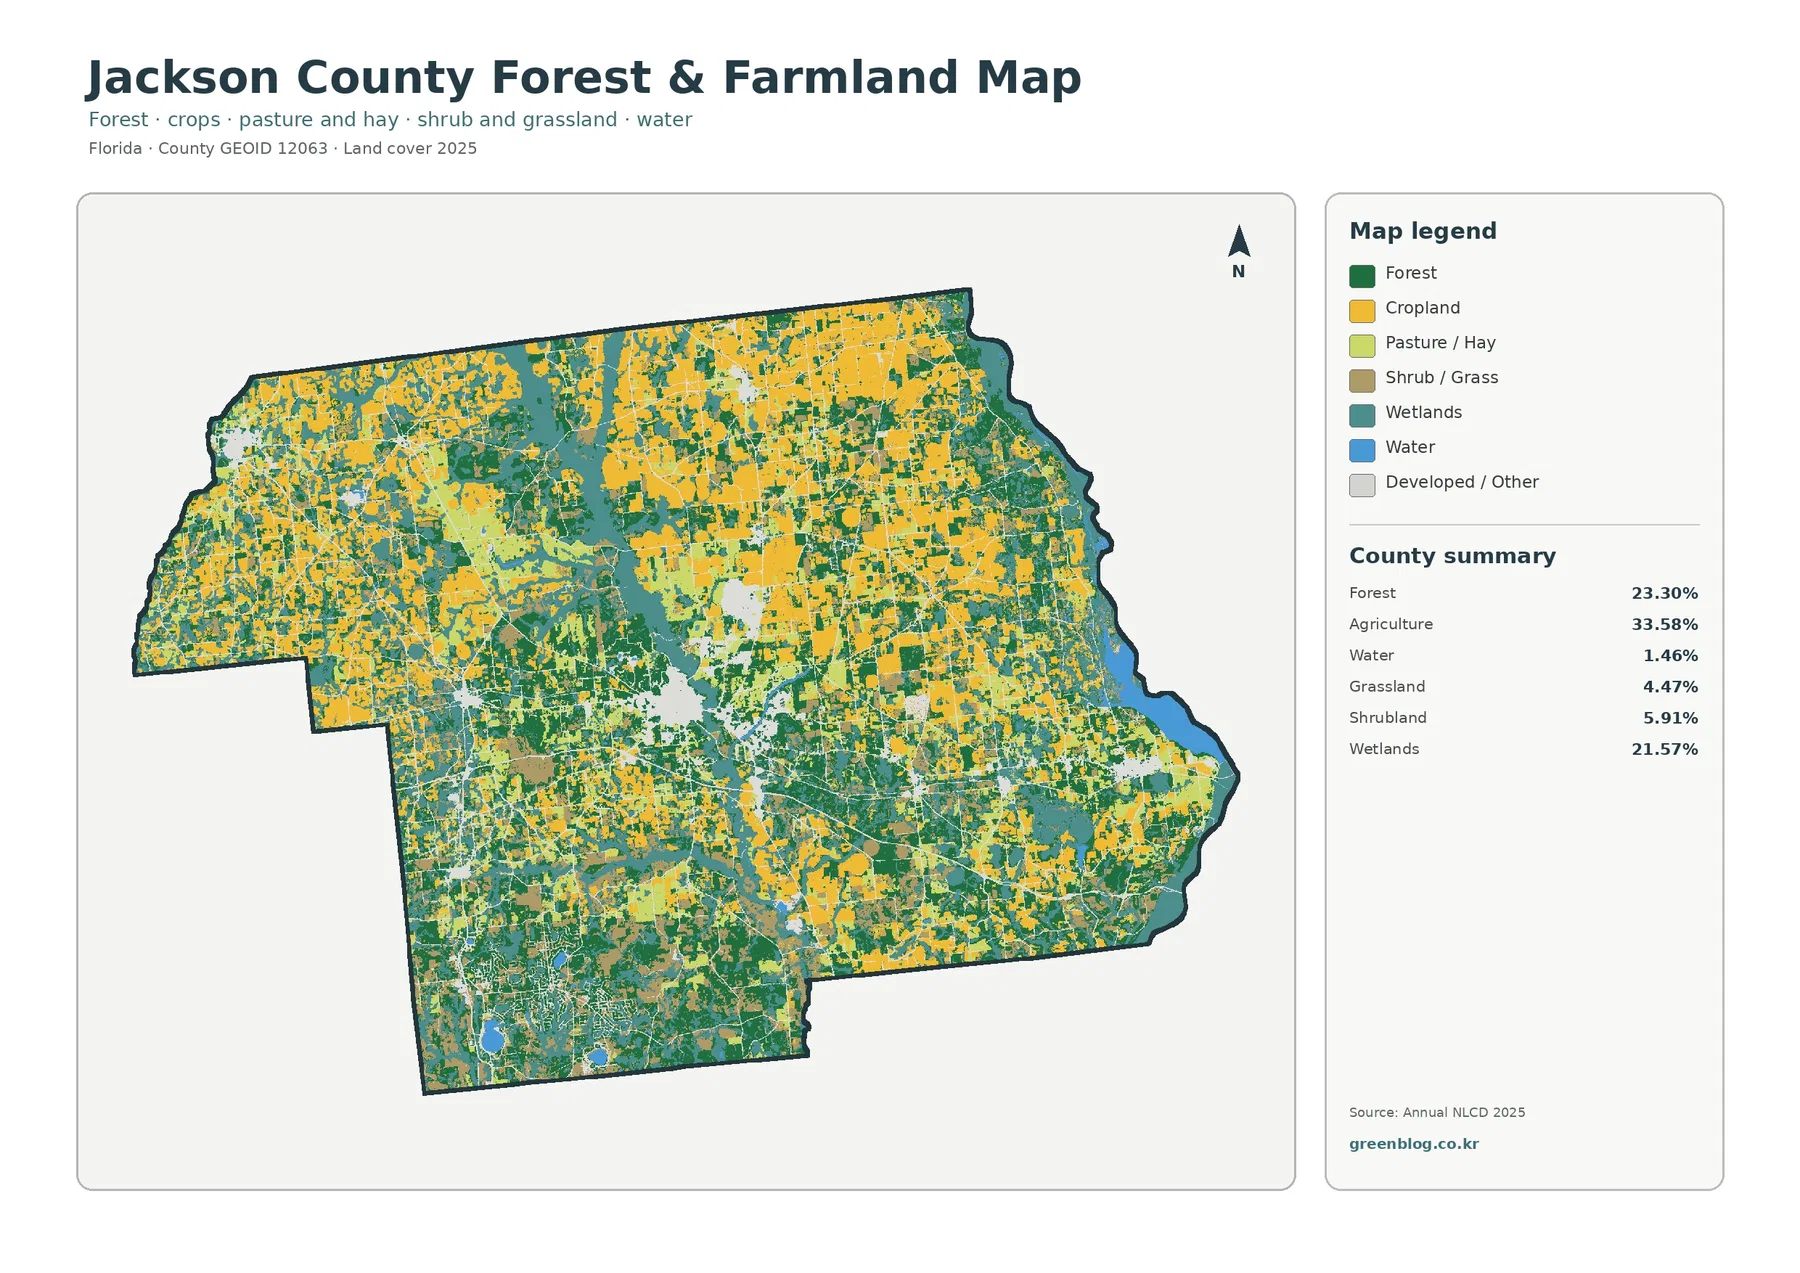
The forest-and-farmland map simplifies some of the other land-cover categories so that working land and wooded cover stand out more clearly. Broad yellow agricultural areas are easy to follow across the north and northeast, while darker green forest becomes more prominent through the middle and southern portions of the county. Wetlands thread between both. The result is not a clean line between farmland and forest, but a county where agricultural and natural cover repeatedly meet.
Agriculture’s 33.58% share is consistent with Jackson County’s broader rural character. UF/IFAS Extension Jackson County provides programs for row crops, livestock and forages, fruits and vegetables, and natural resources, giving useful local context for the importance of working lands. The map itself does not identify crop types, farm ownership, or agricultural zoning. Yellow pixels indicate land classified as agricultural cover in the source data, which is a different question from legal land use.
Forest and wetlands together occupy almost 45% of the county. In many central and southern areas, green and teal appear side by side, while the northern farm blocks are often interrupted by smaller wooded and wet areas. This helps explain why looking only at the dominant agriculture figure would miss a large part of Jackson County’s physical setting. A county reference map is more informative when these classes are read together rather than treated as isolated percentages.
Grassland at 4.47% and shrubland at 5.91% form smaller but recurring components of the map. They appear in scattered areas between fields, woods, and wetlands instead of forming one dominant region. When the original JPG is enlarged, these smaller classes are easier to see than on a reduced browser image. Keeping the legend visible when cropping or placing the map in a slide also helps prevent small categories from being mistaken for neighboring classes.
A 1.64% mean impervious value shows that hard surfaces are concentrated rather than countywide
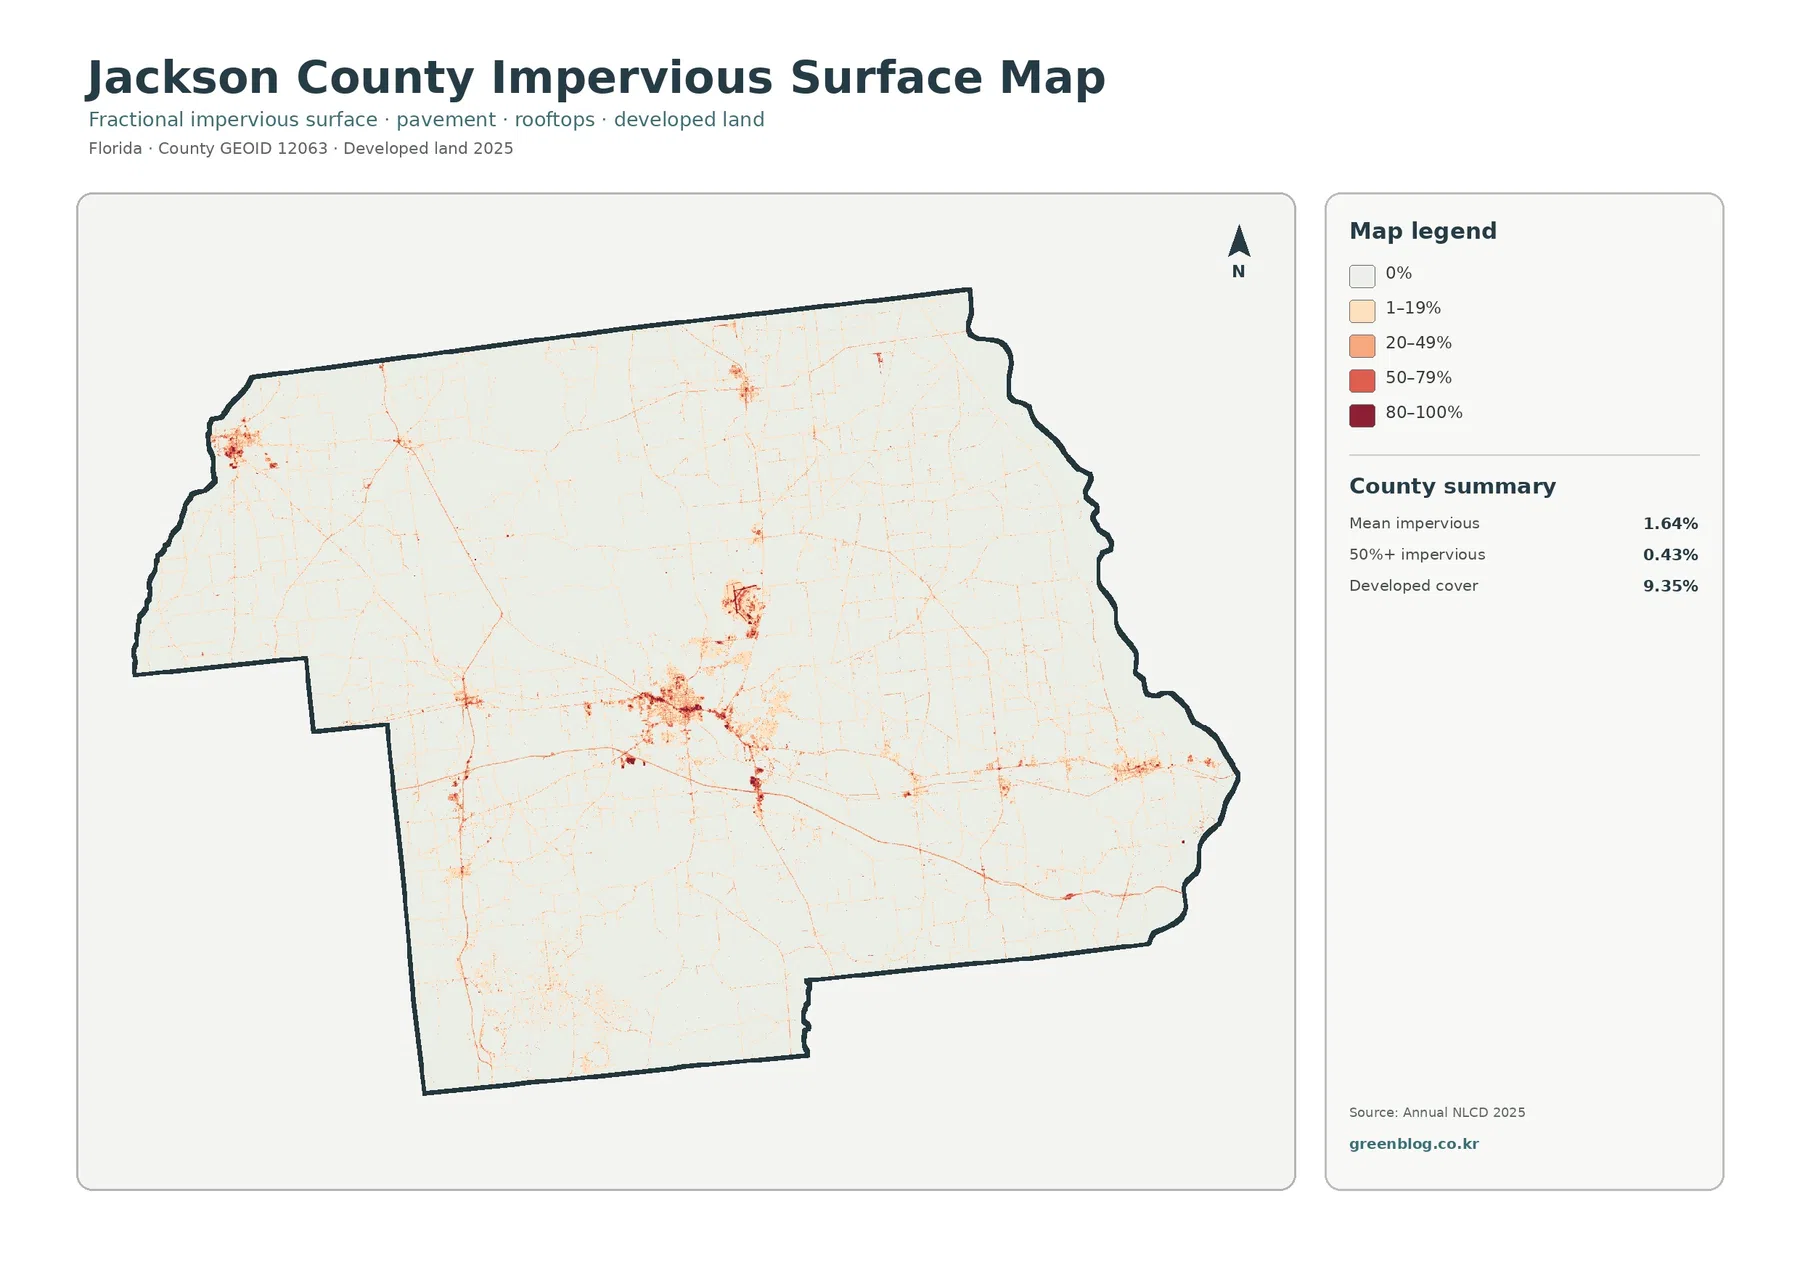
Impervious surface refers to hard cover such as pavement, parking areas, and rooftops that does not readily absorb rainfall. Jackson County’s mean impervious value is 1.64%, and only 0.43% of the county is mapped at 50% or greater imperviousness. Those values are much lower than the 9.35% developed-land figure because developed areas can include lawns, trees, bare soil, and other surfaces that still allow water to infiltrate.
The darkest impervious colors are concentrated around the central Marianna area, with smaller clusters near other settlements and road junctions. Thin lines also follow portions of the road system, but most of the county remains very pale on this map. That visual contrast fits a rural county where built surfaces are important locally but occupy a limited share of the total area.
Jackson County describes itself as a predominantly rural agricultural community, while its Community Development department separately manages planning, growth, building, and development rules. That distinction is useful here. A dark impervious pixel means that a high share of the surface is hard cover; it does not tell a reader whether a parcel is zoned for a particular use, whether construction is permitted, or who owns the land.
For environmental education, this map can be compared with the wetland and water classes on the general land-cover map. Students or readers can identify where hard surfaces are most concentrated and then see how quickly the surrounding landscape returns to farms, forest, or wetlands. The map should not be used by itself to determine flood risk, drainage capacity, or water quality because those questions require additional information about elevation, soils, stormwater systems, rainfall, and watershed conditions.
The 1985–2025 comparison shows widespread class differences, especially in forest and agricultural areas
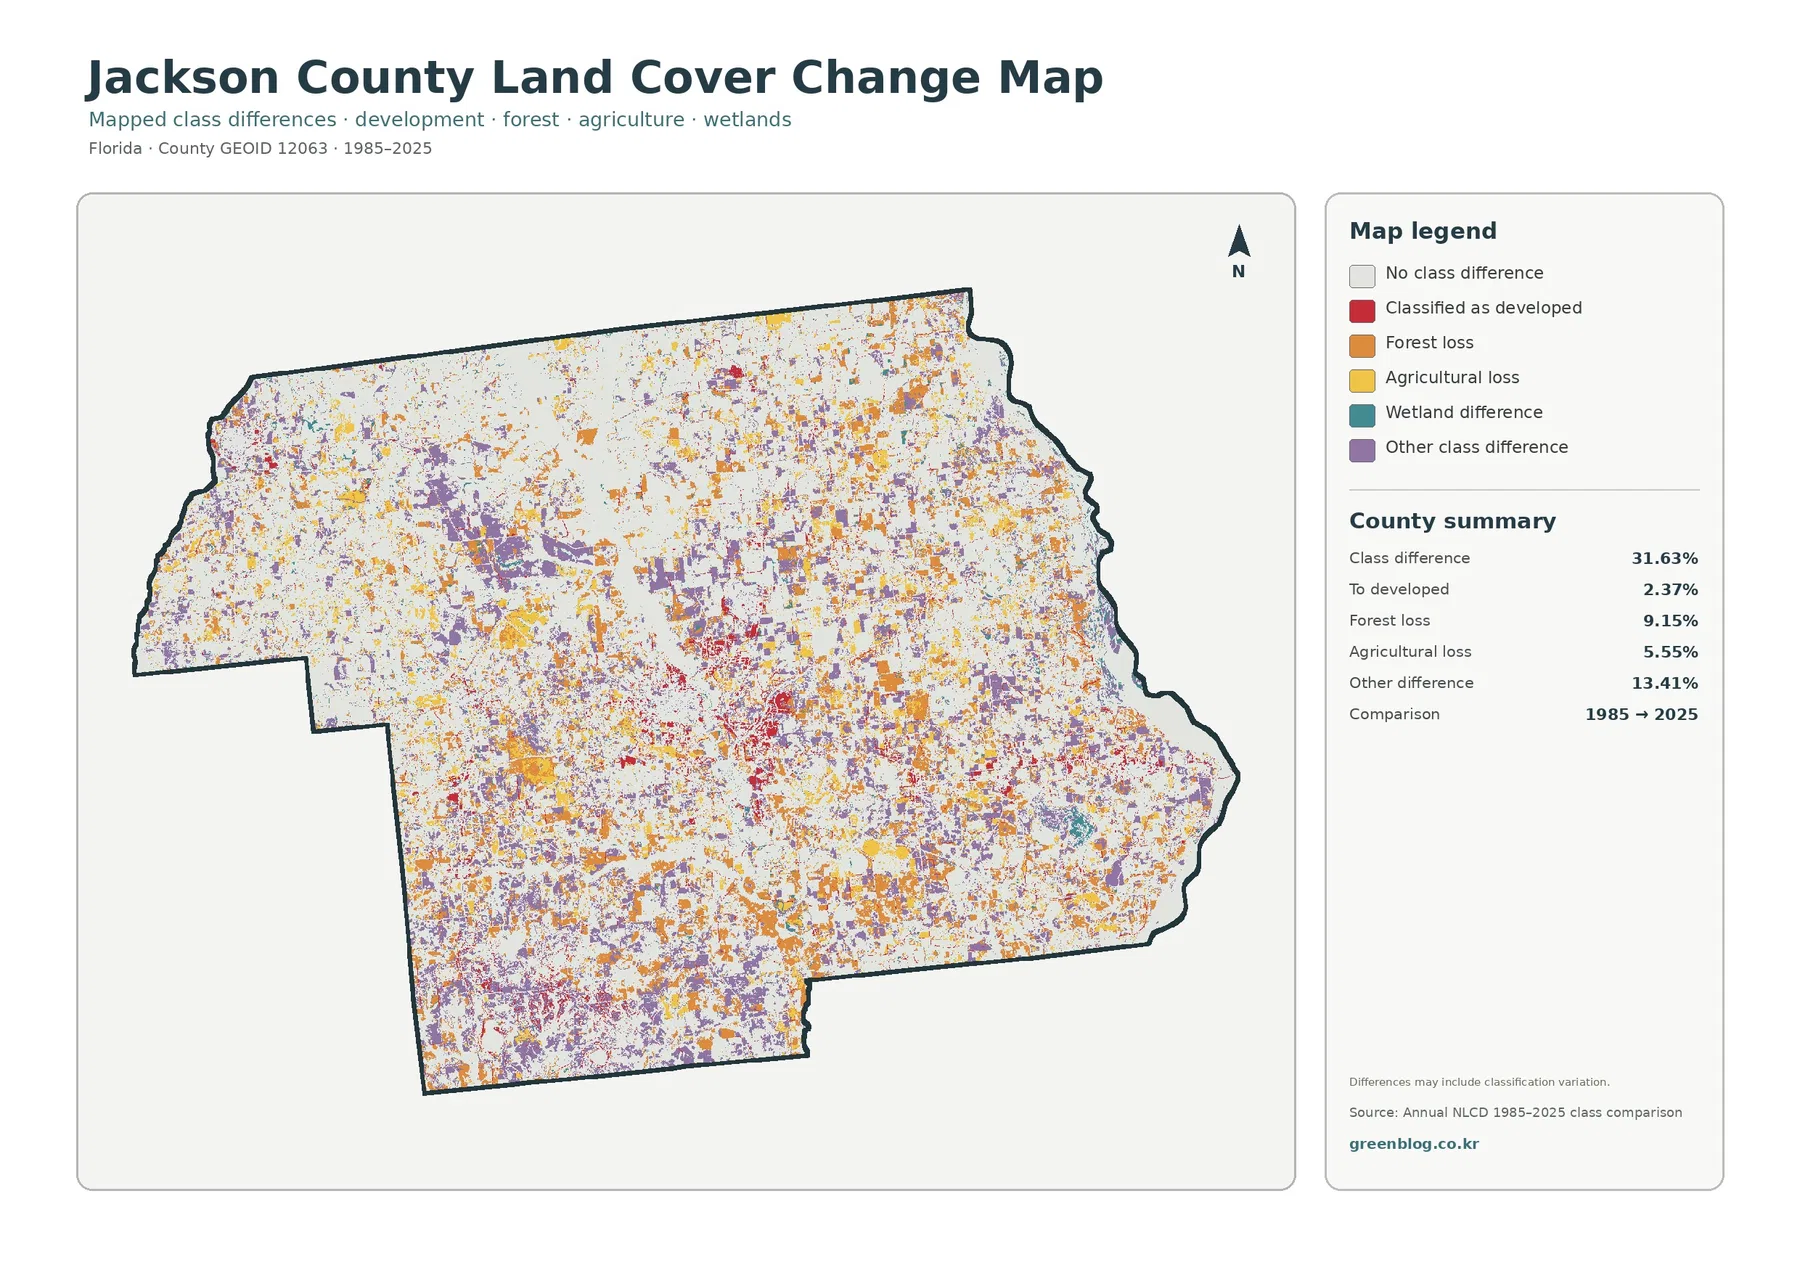
The comparison map reports class differences across 31.63% of Jackson County. Forest loss is listed at 9.15%, agricultural loss at 5.55%, conversion to developed at 2.37%, and other class difference at 13.41%. The colored areas are spread through much of the county rather than forming a single change zone. That broad distribution is one reason the map is most useful as a guide to places that deserve closer review.
Orange forest-loss areas and yellow agricultural-loss areas appear in many of the same broad parts of the county where forest and farming are prominent today. Red developed-class transitions are more limited and are easiest to notice around current settlement and road locations. Even when two maps highlight nearby places, however, the categories should not be treated as direct proof of one specific cause. The impervious map and the class-comparison map measure different things.
A note on the map states that the differences may include classification variation. That warning is important: the 31.63% class-difference value should not be read as a literal percentage of land that physically changed on the ground. Different imagery, observation dates, mixed pixels, and classification methods can cause the same place to receive a different label. Aerial photographs or additional Annual NLCD years are better tools for confirming whether a mapped difference represents a real landscape change.
The map also compares only two endpoints, 1985 and 2025. It does not show the sequence of events during the forty years in between. A location may have changed more than once, remained stable for decades before a recent transition, or returned to a class similar to its earlier condition. For long-term research, this map works best as a starting point rather than a complete history.
Marianna, the Chipola River, and the tri-state setting provide useful local context
Marianna is the county seat and the clearest developed center on the impervious-surface view. Outside that central area, built cover falls off quickly into agricultural, forest, and wetland land cover. This relationship is useful when explaining Jackson County to readers who might otherwise assume that the red developed class represents a large urbanized area. The maps show a compact settlement footprint within a much broader rural landscape.
The county’s official information also notes that Jackson County borders both Alabama and Georgia and forms part of a tri-state community. That administrative setting helps locate the county, but land-cover colors should not be interpreted as regulatory boundaries. A county line defines the map extent; it does not imply that fields, forests, or wetlands suddenly change at the border.
The Chipola River and Jackson Blue Springs are useful named references because they connect the abstract land-cover classes to real features in the county. Water and wetlands are not the dominant categories overall, but they remain a major part of the mapped landscape. A local lesson or report can use these references to explain why wetland cover matters alongside agriculture and forest without claiming that every teal pixel belongs to a particular named water feature.
A practical classroom sequence is to begin with the general land-cover map, identify agriculture as the leading class, and then switch to the forest-and-farmland map to compare working land with wooded and wet areas. The impervious map can then show the relative concentration of Marianna and road surfaces, followed by the change map to identify places where the 1985 and 2025 classifications differ. This order makes the purpose of each map clear without treating any one layer as a complete description of the county.
The four original JPG maps are useful for close inspection, documents, and presentations
The download ZIP contains the 2025 land-cover map, the forest-and-farmland map, the impervious/developed-land map, and the 1985–2025 land-cover comparison map. Each JPG is 2480×1754 pixels. The original JPG files are easier than the reduced WebP previews for enlarging legends, checking small color patches, or placing a county map into a document or presentation.
These maps are based on raster land-cover data, meaning that the landscape is represented as a grid of cells and each cell receives a representative class or value. Real ground conditions are more complex than the sharp map colors suggest. A single cell can include grass, a road edge, trees, a building, or water, so the boundary between colors should not be treated as a surveyed parcel line.
The four-map set is most useful when the maps are read together. A developed patch on the general map can be checked against impervious intensity; a farm block can be viewed beside neighboring forest and wetlands; and a location with a 1985–2025 class difference can be identified for follow-up in other imagery. This cross-checking approach reduces the risk of drawing a broad conclusion from one color or one percentage.
Frequently Asked Questions
What is the largest 2025 land-cover category in Jackson County?
Agriculture is the largest mapped category at 33.58%. Forest follows at 23.30% and wetlands at 21.57%. Because all three occupy substantial areas and repeatedly meet across the county, Jackson County is better understood as a mixed rural landscape than as an area represented by agriculture alone.
Why is developed land 9.35% while mean impervious cover is only 1.64%?
The two measures describe different things. Developed land can include buildings and roads along with lawns, trees, soil, and other permeable surfaces. Impervious cover measures hard surfaces such as pavement and rooftops more directly, so its countywide average can be much lower than the developed-land share.
Does the 31.63% 1985–2025 class difference equal the true land-change rate?
No. The map specifically notes that classification variation may be included. Differences in imagery and classification can change the label assigned to a location even when the ground did not undergo the same type of physical change. Confirm important locations with aerial imagery, additional years, or other official records.
Map File Information
Download the four original Jackson County land-cover JPG maps together in one ZIP file.
- Included Files: Use only the versions confirmed in the article and supplied images
- File Type: Use the confirmed download contents
- Intended Use: Printing, education, presentations, and map-based projects
Related Maps
- Alachua County Florida Land Cover Map
- Baker County Florida Land Cover Map
- Bay County Florida Land Cover Map
Sources and References
- MRLC Annual NLCD Data – Official source for Annual NLCD land-cover data.
- USGS Annual NLCD Land Cover Classification – Describes the main Annual NLCD land-cover classes.
- U.S. Census Bureau TIGER/Line Shapefiles – Official geographic boundary data used for county reference.
- Jackson County, Florida – About – Official county background on Marianna, the tri-state setting, the Chipola River, and Jackson Blue Springs.
- UF/IFAS Extension Jackson County – Local agriculture and natural-resource education and Extension information.
Green Map creates custom-edited map images using open geographic data sources such as geoBoundaries, Natural Earth, OpenStreetMap, and government open data.
These maps are edited visual materials, not raw data files, and are provided for education, documents, presentations, and graphic reference.