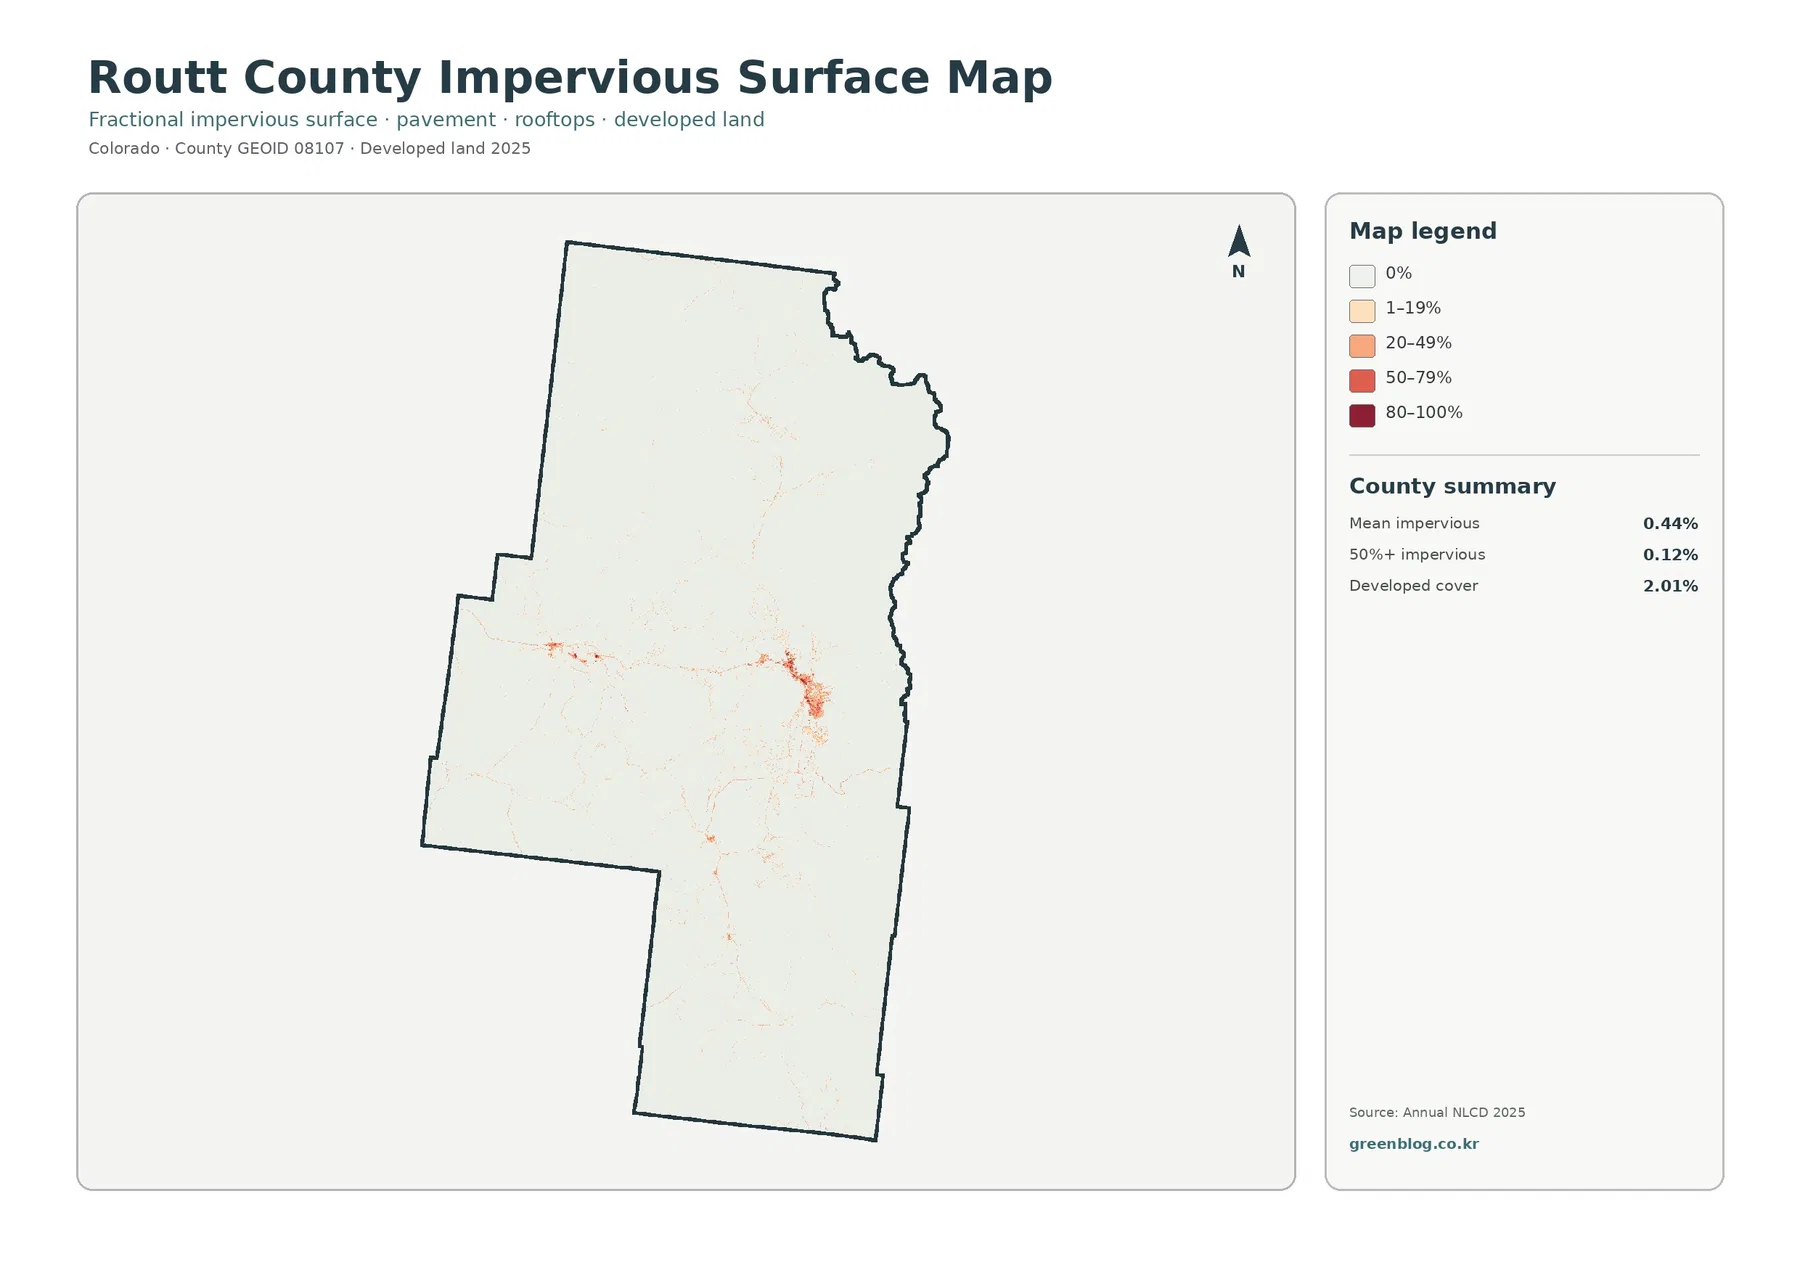
Routt County in northwest Colorado is dominated by natural vegetation rather than broad urban or cropland cover. In the 2025 summary, forest accounts for 49.29% of the county and shrubland for 40.16%. Wetlands make up 2.90%, agriculture 2.88%, grassland 2.29%, and water 0.28%, while developed cover is concentrated in a few settlement areas rather than spread across the county.
This page compares four views of the same county: 2025 land cover, forest and farmland, impervious surface and developed land, and mapped class differences between 1985 and 2025. The four original JPG maps are also available together in one ZIP for presentations, classroom work, county comparisons, and general environmental reference.
Table of Contents
A county where forest and shrubland nearly divide the landscape
The broadest pattern is easy to see before focusing on any town or valley. Forest forms large connected areas through much of the eastern, southern, and central part of the county. Shrubland is nearly as extensive and occupies wide areas in the northwest, west, and many openings between forested zones. Together, those two classes cover close to nine-tenths of Routt County.
Smaller classes matter because they occur in different settings. Wetlands represent 2.90% of the 2025 summary and often appear as narrow or irregular strips through lower terrain. Agriculture, at 2.88%, is more localized and tends to form patches along broader valley floors and gentler ground. Grassland is 2.29%, while mapped water is only 0.28%, so small lakes and streams occupy little area even though they remain useful landmarks when comparing the maps.
The land-cover colors describe the surface recorded by the classification, not zoning, ownership, or a legal land-use designation. A parcel used for ranching can contain shrubland or grassland rather than an agriculture class, and one property can contain several cover types. That distinction becomes especially important in Routt County because official county material describes a large agricultural land base even though the 2025 satellite-derived agriculture class covers a much smaller percentage.
Barren and developed classes are present in the legend, but neither dominates the countywide view. Their smaller extent makes them easier to understand after first recognizing the much larger forest and shrubland areas. The 2025 map therefore works best as an overview of how natural vegetation, wetter valley areas, agriculture, and settlement fit together.
Development becomes clearer when impervious surface is isolated
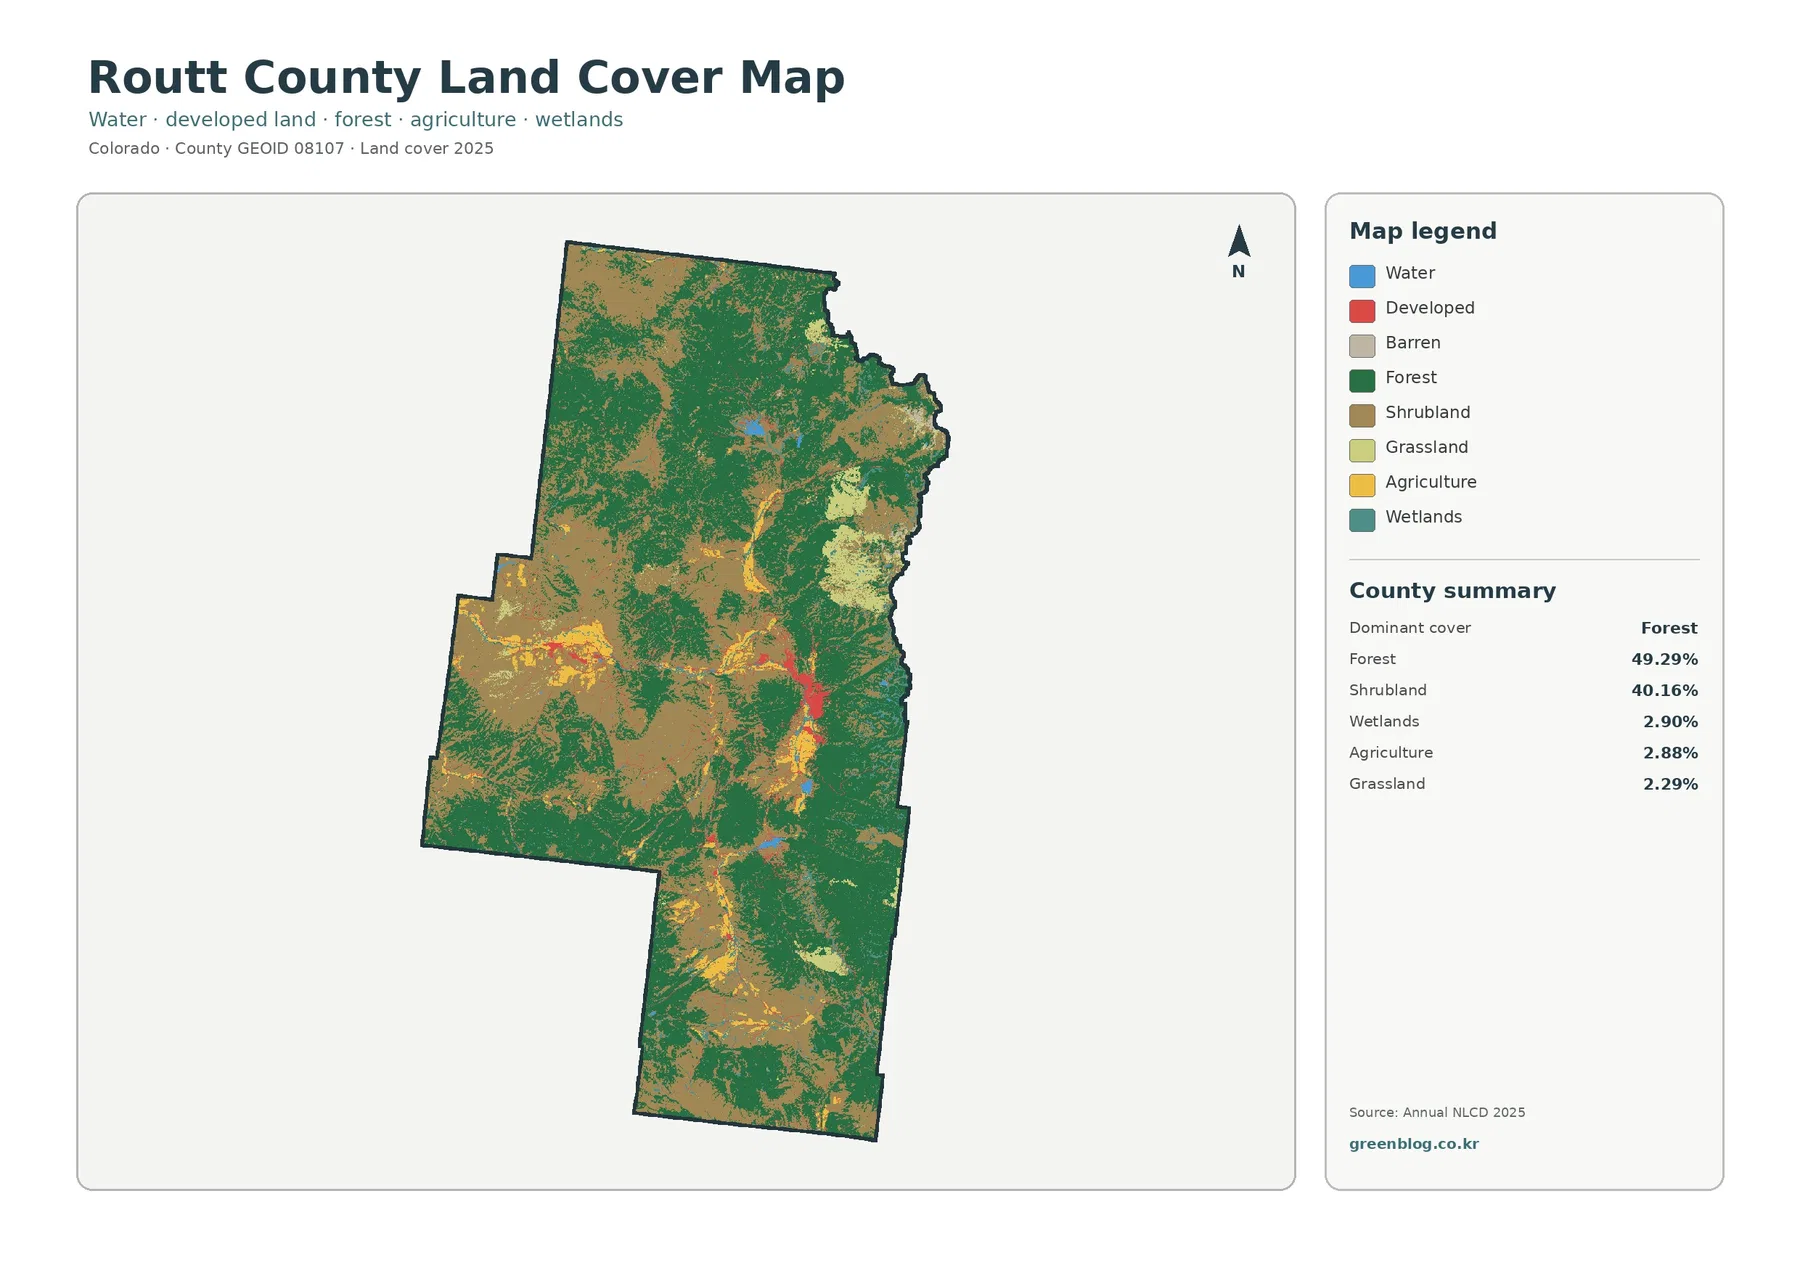
The impervious-surface map strips away most vegetation detail and emphasizes pavement, rooftops, and other hard surfaces that shed water instead of readily absorbing it. Routt County has a mean impervious value of 0.44%, and only 0.12% of the county is mapped at 50% impervious or higher. Developed cover is 2.01%, so the countywide average remains low even though several settlement areas stand out sharply.
The strongest concentration is around Steamboat Springs. Routt County identifies Steamboat Springs as the county seat and a major employment and tourism center, which provides useful context for the most continuous cluster of higher impervious values on the map. The surrounding county quickly returns to much lighter values, showing how compact the main developed concentration is relative to the total county area.
A smaller cluster appears around Hayden to the west, with additional narrow developed traces farther south in the part of the county that includes Oak Creek and Yampa. These patterns should be read at county scale. The map is not detailed enough to identify an individual roof, road surface, drainage facility, or parcel boundary, and it does not indicate whether development is permitted in any location.
Developed cover and impervious percentage are related but not interchangeable. A developed land-cover cell can contain trees, lawns, bare soil, and buildings together, especially in low-density areas. Impervious percentage instead focuses on the fraction of the cell occupied by hard surfaces. That is why the developed-cover share can be several times larger than the countywide mean impervious value.
Forest and farmland are easier to compare in the simplified map
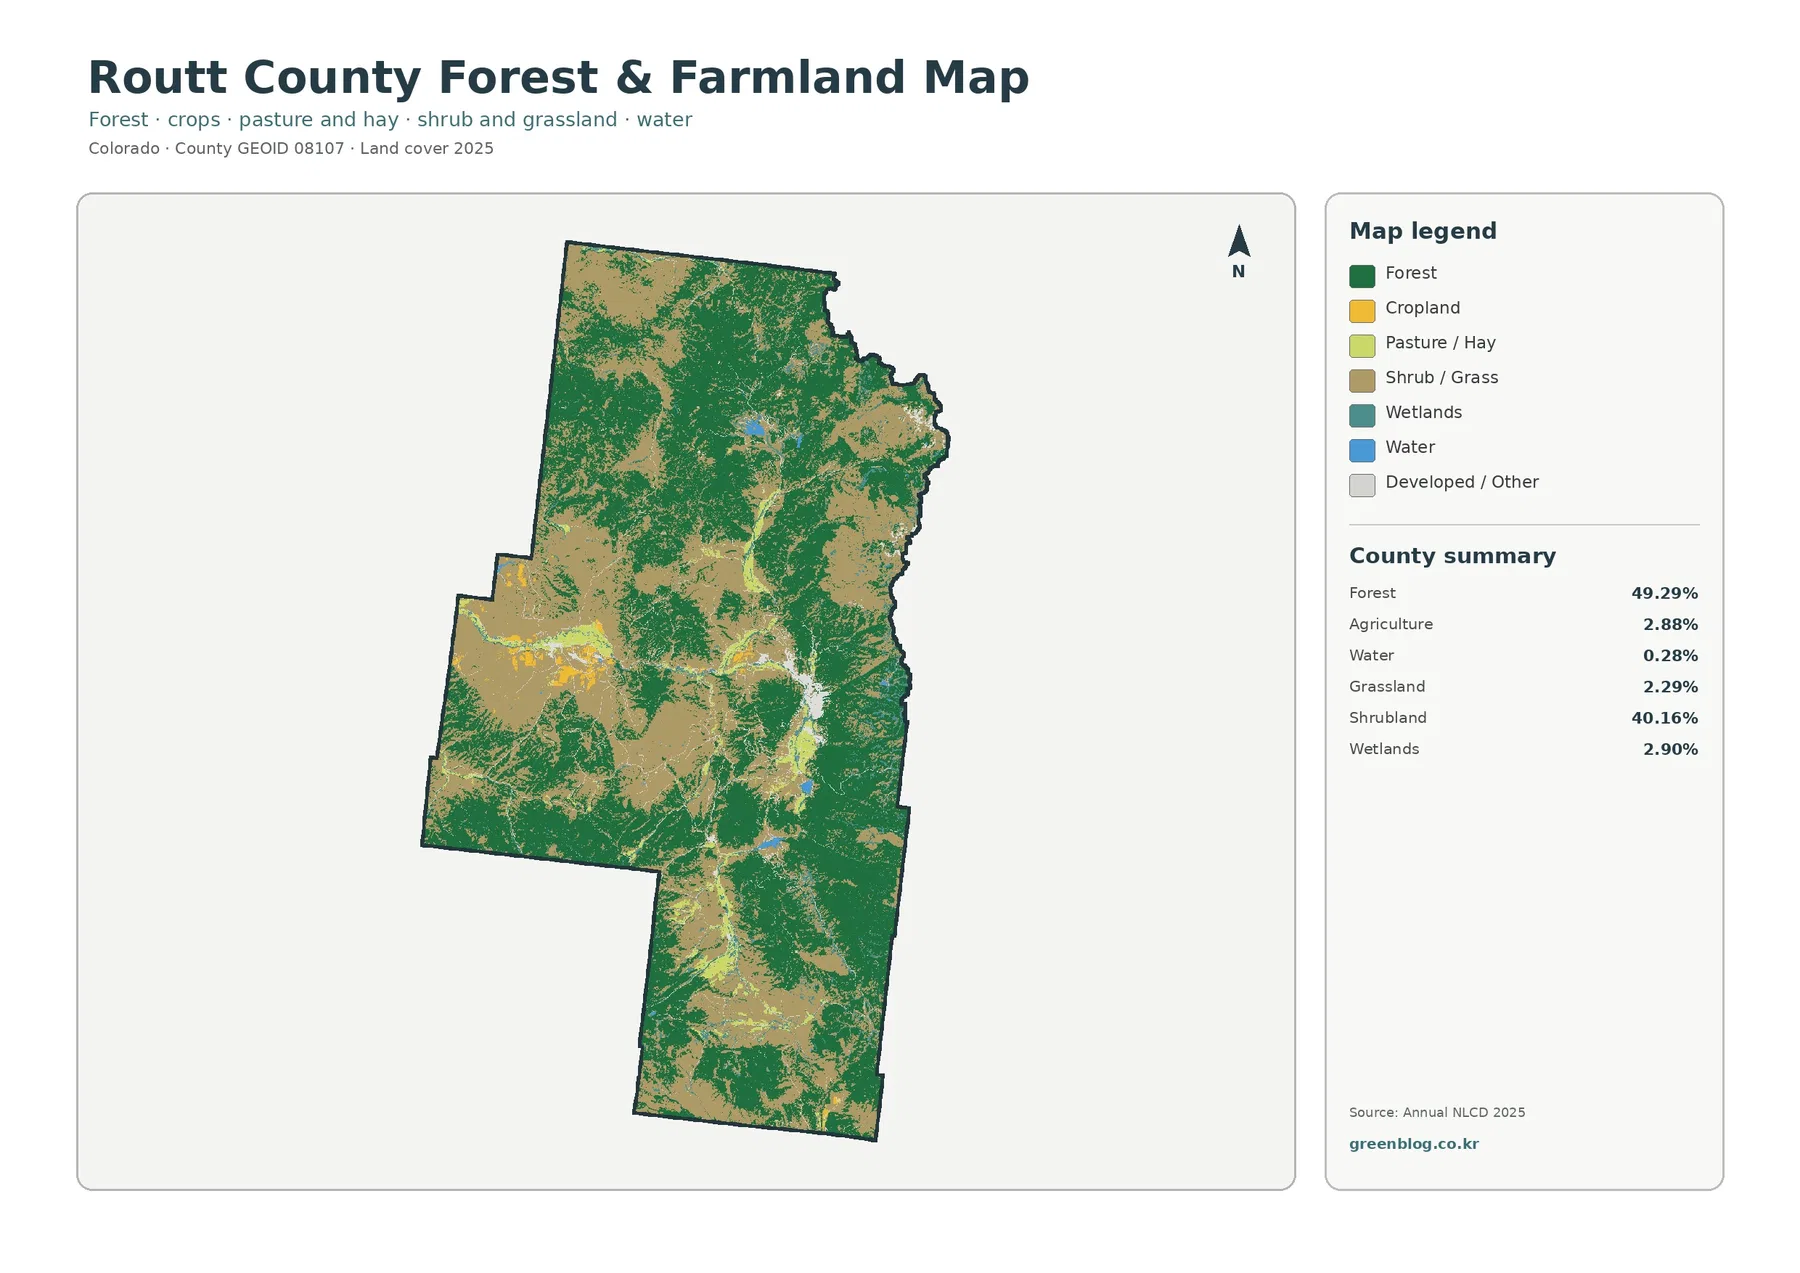
The forest-and-farmland view is useful when the full land-cover legend feels too busy. Forest remains the dominant green class across broad mountain and upland areas, while agriculture appears in much smaller yellow and light-green patches. Shrub and grass cover fills many of the spaces between those two categories, making the transitions between wooded uplands and more open valley settings easier to follow.
Agriculture covers 2.88% in the supplied 2025 land-cover summary. That figure should not be treated as the share of Routt County that is economically or legally agricultural. The county’s official website says Routt County covers more than 1.5 million acres and describes about 710,000 acres, or roughly 47%, as agricultural acres. The large difference reflects different definitions: the county statement concerns agricultural land in a broader administrative and local context, while the map class records how the ground surface was classified in the satellite-based land-cover product.
That distinction is especially helpful for understanding ranch country. Grazing land can appear as grassland or shrubland rather than the agriculture class, and forested portions of an agricultural property remain forest in a land-cover map. The forest-and-farmland map therefore answers a narrow visual question: where are forest and mapped agricultural cover located relative to other surface types? It does not measure the agricultural economy or define farm boundaries.
Wetlands and water remain visible in this version as well. They provide reference points through the broad forest and shrubland matrix and can help when preparing watershed or habitat-comparison graphics. Small features may still be generalized because the source is raster data, meaning the county is represented by a grid of cells rather than by detailed parcel polygons.
The 1985–2025 comparison highlights where classifications differ
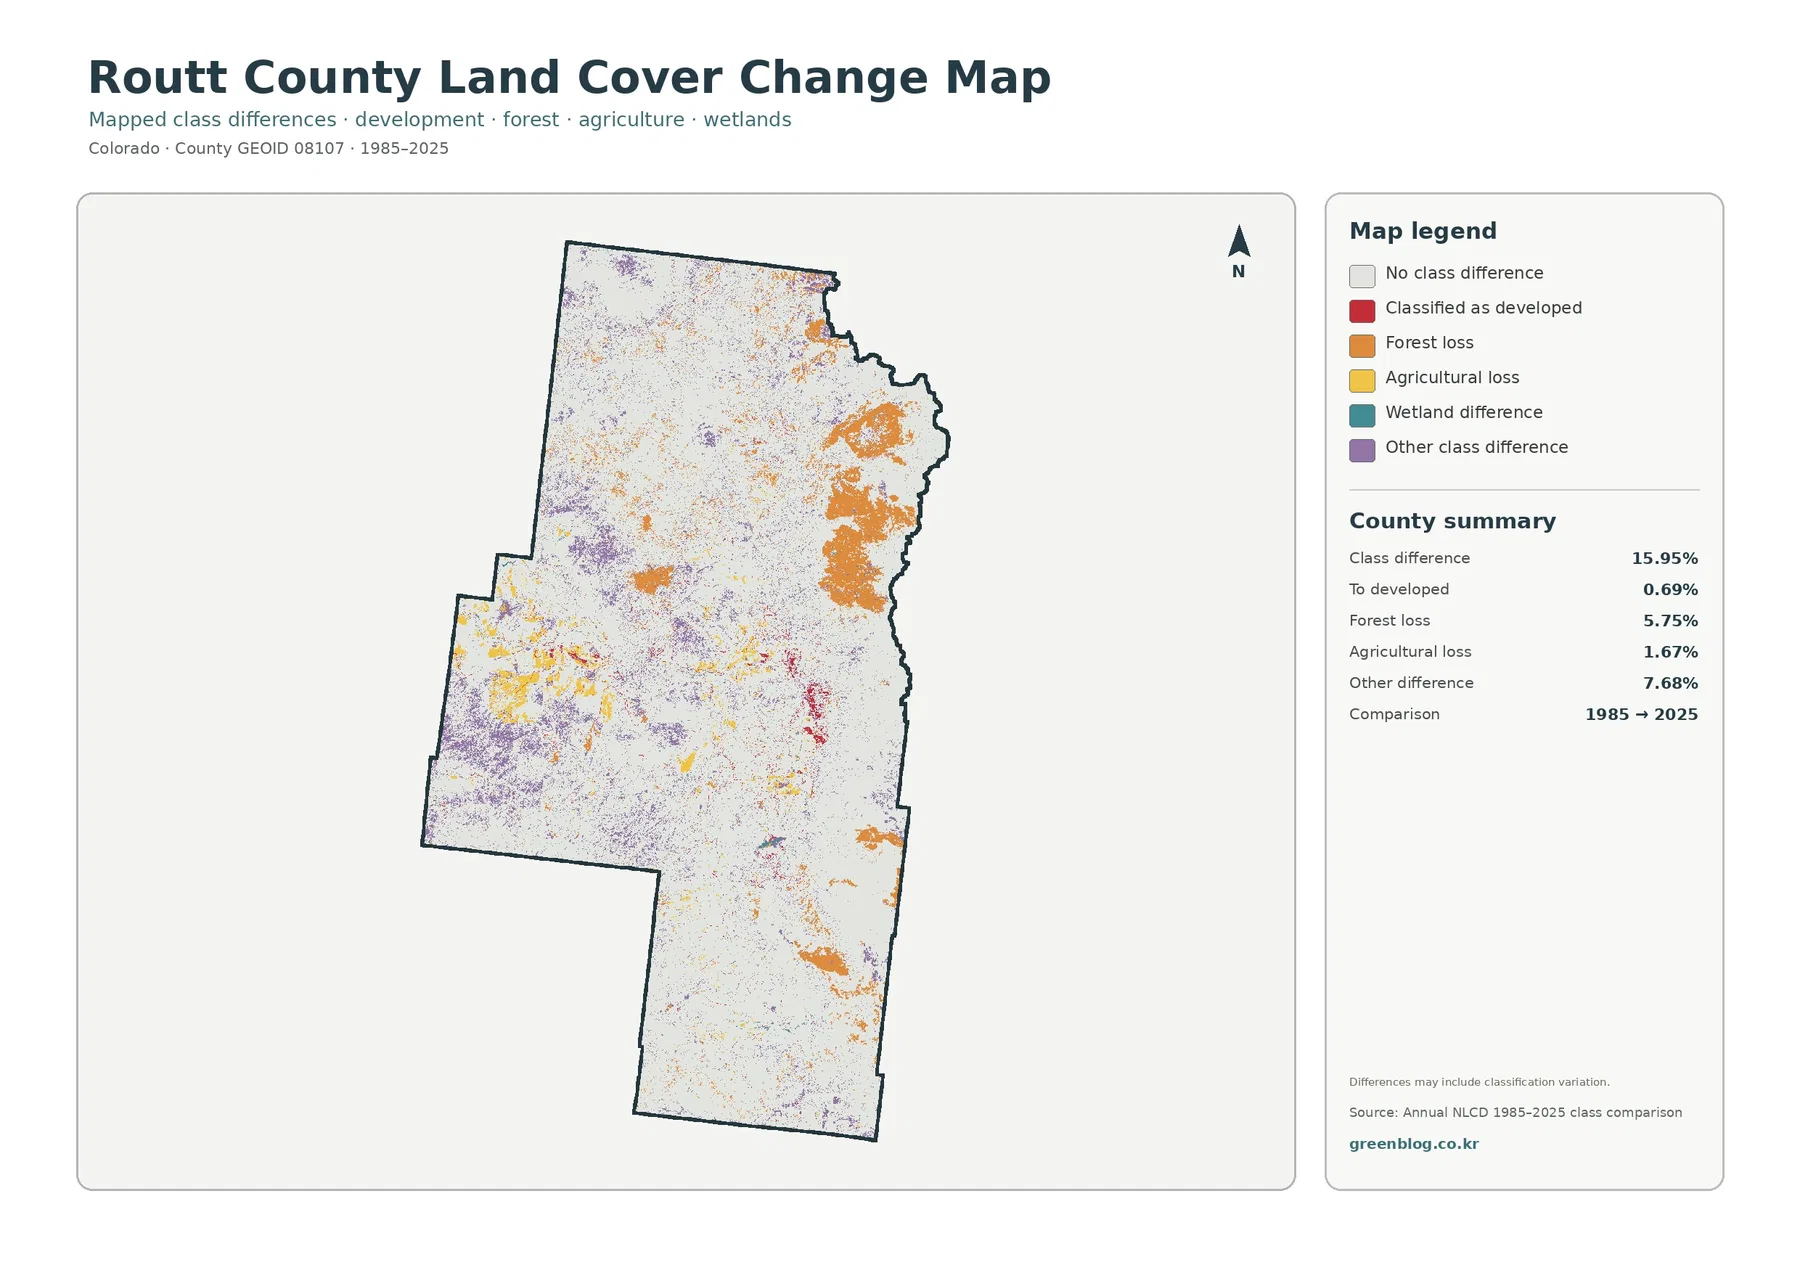
The change map compares the class assigned to the same locations in 1985 and 2025. Its summary reports a total class difference of 15.95%. Within that total, 0.69% is classified as change to developed, 5.75% as forest loss, 1.67% as agricultural loss, and 7.68% as other class difference. The colored cells are scattered across the county rather than confined to one single corridor.
The 15.95% value is not a countywide damage rate. It means that those cells received different land-cover classifications in the two comparison years. Real development, vegetation change, forest disturbance, or agricultural change may contribute, but so can differences in observation date, vegetation condition, recovery after disturbance, imagery, and classification methods.
The forest-loss category requires the same caution. A 5.75% forest-loss classification does not by itself prove that 5.75% of the county’s forest was permanently removed. It indicates that cells classified as forest in the earlier comparison were assigned another class in 2025. Determining cause requires intermediate Annual NLCD years and, where relevant, fire records, aerial imagery, forest-management information, or field evidence.
A practical way to use this map is to treat larger colored patches as places to investigate. Orange areas can be compared with the current forest-and-farmland map, red development changes can be checked against the impervious map, and purple ‘other’ differences can be compared with the general 2025 land-cover map. That workflow keeps the change layer from being mistaken for a complete explanation.
County context helps explain why land cover and land use do not match exactly
Routt County’s official website names Steamboat Springs, Hayden, Oak Creek, and Yampa among its incorporated communities and describes the county as both an outdoor-recreation destination and an agricultural county. Those facts help place the small developed clusters and broader open areas in context, but they do not change what the land-cover classes mean. The maps still represent surface cover, not municipal boundaries or economic activity.
The county Planning Department states a vision that includes open spaces, forests, rivers, lakes, wildlife, the rural western landscape, and agricultural heritage. That planning language is useful background for understanding why a county with extensive natural cover also pays close attention to growth and land management. It should not be used to infer a zoning rule from a color on these maps; planning regulations and permit decisions require the county’s official planning documents.
For boundary work, the U.S. Census Bureau’s TIGER/Line data are a more appropriate source than the land-cover raster. For detailed land-cover definitions, the MRLC and USGS Annual NLCD documentation should be consulted. Using each source for its intended purpose avoids turning a generalized environmental map into a parcel, zoning, or legal map.
Choosing the right Routt County map for a project
- Use the 2025 general land-cover map when you need one view of forest, shrubland, agriculture, grassland, wetlands, water, barren land, and developed areas.
- Use the forest-and-farmland map when the main question is how extensive forest relates to smaller mapped agricultural areas and open shrub or grass cover.
- Use the impervious-surface map to locate the strongest concentrations of pavement and rooftops around Steamboat Springs and other settlements.
- Use the 1985–2025 change map to identify cells with different classifications and then compare those locations with current maps or other evidence.
For a classroom or presentation, a useful sequence is to begin with the general map, move to the impervious layer to identify settlement concentrations, and then use the forest-and-farmland view to return to the larger landscape. The change map works best last, after the audience already understands the current pattern, because its colored classes describe differences rather than present-day cover.
The raster format also creates limits at small scales. Each cell summarizes a portion of the ground, so narrow roads, small wetlands, stream margins, scattered buildings, and mixed vegetation can be simplified into one class or one impervious value. These maps are well suited to county-scale comparison and visual reference, but not to property surveys, engineering measurements, or site-specific permitting decisions.
Download the four Routt County JPG maps
The ZIP below contains the four original JPG maps used for this article: 2025 land cover, forest and farmland, impervious surface and developed land, and the 1985–2025 class-difference map. Each image is 2480×1754 pixels. The supplied asset manifest does not mark these files as meeting the A3 high-resolution reference, so larger print work or detailed analysis may require the underlying Annual NLCD data or another higher-resolution source.
Frequently Asked Questions
What is the largest land-cover class in Routt County?
Forest is the largest 2025 class at 49.29%, followed by shrubland at 40.16%. Together they cover most of the county.
Which map is best for seeing development around Steamboat Springs?
Use the impervious surface and developed land map. It makes pavement and rooftops much easier to distinguish from the county’s broad natural cover.
Does the 15.95% 1985–2025 class difference mean 15.95% of the county was damaged?
No. It is the share of cells assigned different land-cover classes in the two comparison years. Real change may be included, but classification and observation differences can also contribute.
Map File Information
The ZIP includes all four original JPG maps: 2025 land cover, forest and farmland, impervious surface and developed land, and 1985–2025 class differences.
- Included Files: Use only the versions confirmed in the article and supplied images
- File Type: Use the confirmed download contents
- Intended Use: Printing, education, presentations, and map-based projects
Related Maps
- Adams County Colorado Land Cover Map
- Alamosa County Colorado Land Cover Map
- Arapahoe County Colorado Land Cover Map
Sources and References
- MRLC Annual NLCD Data – land-cover and impervious-surface data
- USGS Annual NLCD Land Cover Classification – class definitions and documentation
- U.S. Census Bureau TIGER/Line Shapefiles – county boundary data
- Routt County Official Website – county overview, communities, and agricultural context
- Routt County Planning Department – planning vision and land-use administration
- Routt County Agricultural – county agricultural classification information
Green Map creates custom-edited map images using open geographic data sources such as geoBoundaries, Natural Earth, OpenStreetMap, and government open data.
These maps are edited visual materials, not raw data files, and are provided for education, documents, presentations, and graphic reference.