Delta County on Colorado’s Western Slope contains two land-cover types at nearly equal scale: shrubland accounts for 42.11% of the 2025 summary and forest accounts for 40.29%. Agriculture adds 9.56%, while developed cover is 4.33% and wetlands are 2.15%. Those countywide numbers become much more useful once they are tied to the map, where forested uplands, broad shrub-covered country, irrigated valleys, river corridors, and several small community centers form very different patterns.
This page includes four views of the same county: current land cover, forest and farmland, impervious surface and developed land, and mapped class differences from 1985 to 2025. The four original JPG maps are available together in one ZIP download. They can be used separately or compared location by location when a project needs to distinguish natural cover, agriculture, built surfaces, and long-term classification change.
Table of Contents
A Western Slope county with forests, badlands, rivers, and irrigated ground
Delta County’s official recreation and trails plan describes a landscape that spans the Gunnison and Uncompahgre river valleys and includes Grand Mesa, adobe badlands, the North Fork of the Gunnison River, Escalante and Dominguez canyons, flat irrigated farmland, and the West Elk Mountains. That variety explains why the county outline contains such large shifts in color. The north and northeast are strongly forested, while lower and drier parts of the county contain broad shrub-dominated areas. Agricultural blocks appear within the more open valleys rather than covering the county uniformly.
The county’s communities are also spread among distinct local areas. Delta is in the southwest near the confluence of the Gunnison and Uncompahgre rivers. Cedaredge and Orchard City are associated with the Surface Creek area below Grand Mesa, while Hotchkiss, Paonia, and Crawford are part of the North Fork side of the county. The impervious and developed patterns on the maps reflect several separate centers instead of one continuous urban belt.
Agriculture is especially important to understanding those valleys. Delta County’s official agriculture page highlights apples, peaches, cherries, specialty crops, and irrigated farming. On the maps, cropland and pasture colors gather around lower, more open areas and near communities. The map can show that spatial association, but it should not be used to infer a farm’s ownership, irrigation right, zoning district, or legal land use. Those questions require separate local records.
The 2025 map is dominated by shrubland and forest, not development
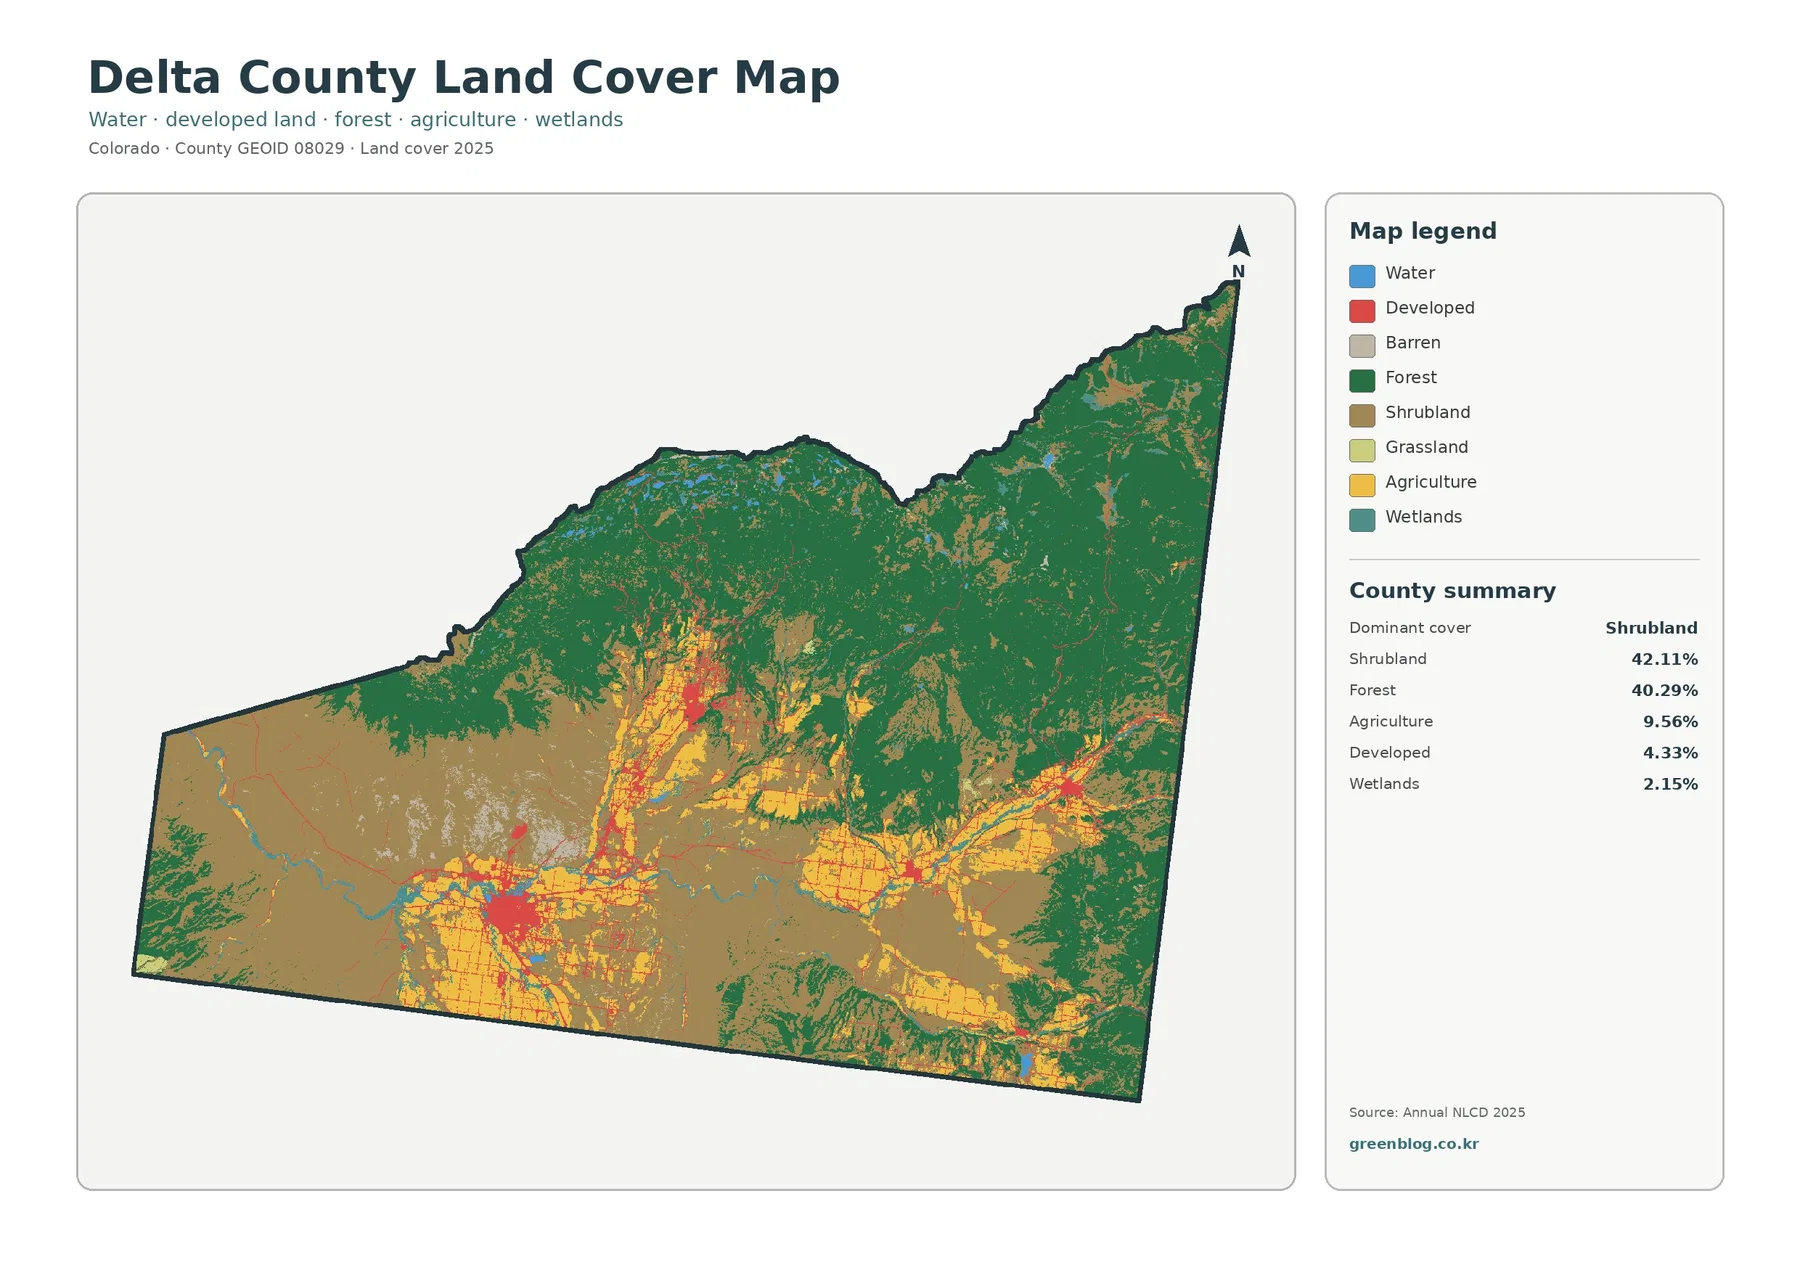
The general map is the best starting point because it keeps the main land-cover classes together. Shrubland is the largest reported class at 42.11%, with forest close behind at 40.29%. The visual balance between the two is easy to see: large forest areas occupy much of the upper and northeastern part of the county, while extensive tan shrub cover fills broad lower-elevation areas, especially toward the southwest and across open interior terrain.
Agriculture makes up 9.56% of the county, and its yellow color forms recognizable blocks rather than a thin countywide scatter. The largest concentration is around the Delta area, with additional agricultural zones extending through the Surface Creek and North Fork parts of the county. Developed cover is smaller at 4.33%. Because the developed class is bright red, it may attract the eye before the larger agricultural area does, so the summary values are useful for keeping visual emphasis and actual share in perspective.
Wetlands account for 2.15%, and blue water features occupy a much smaller portion of the map. The forest-and-farmland summary reports water at 0.47% and grassland at 0.16%. These smaller classes still matter for orientation because narrow wetland and water patterns can help trace valleys and river corridors through otherwise broad forest or shrub regions. The general map is therefore useful not only for percentages but also for seeing where small classes are concentrated.
Land-cover boundaries should be read as generalized raster classifications. A raster divides the landscape into grid cells, and each cell receives a class based on the dataset. Along a narrow stream, road, forest edge, or field boundary, one cell may contain more than one real-world surface. Enlarging the image makes the cells easier to see, but it does not turn them into parcel or survey boundaries.
Agricultural valleys stand out when the forest map simplifies the legend
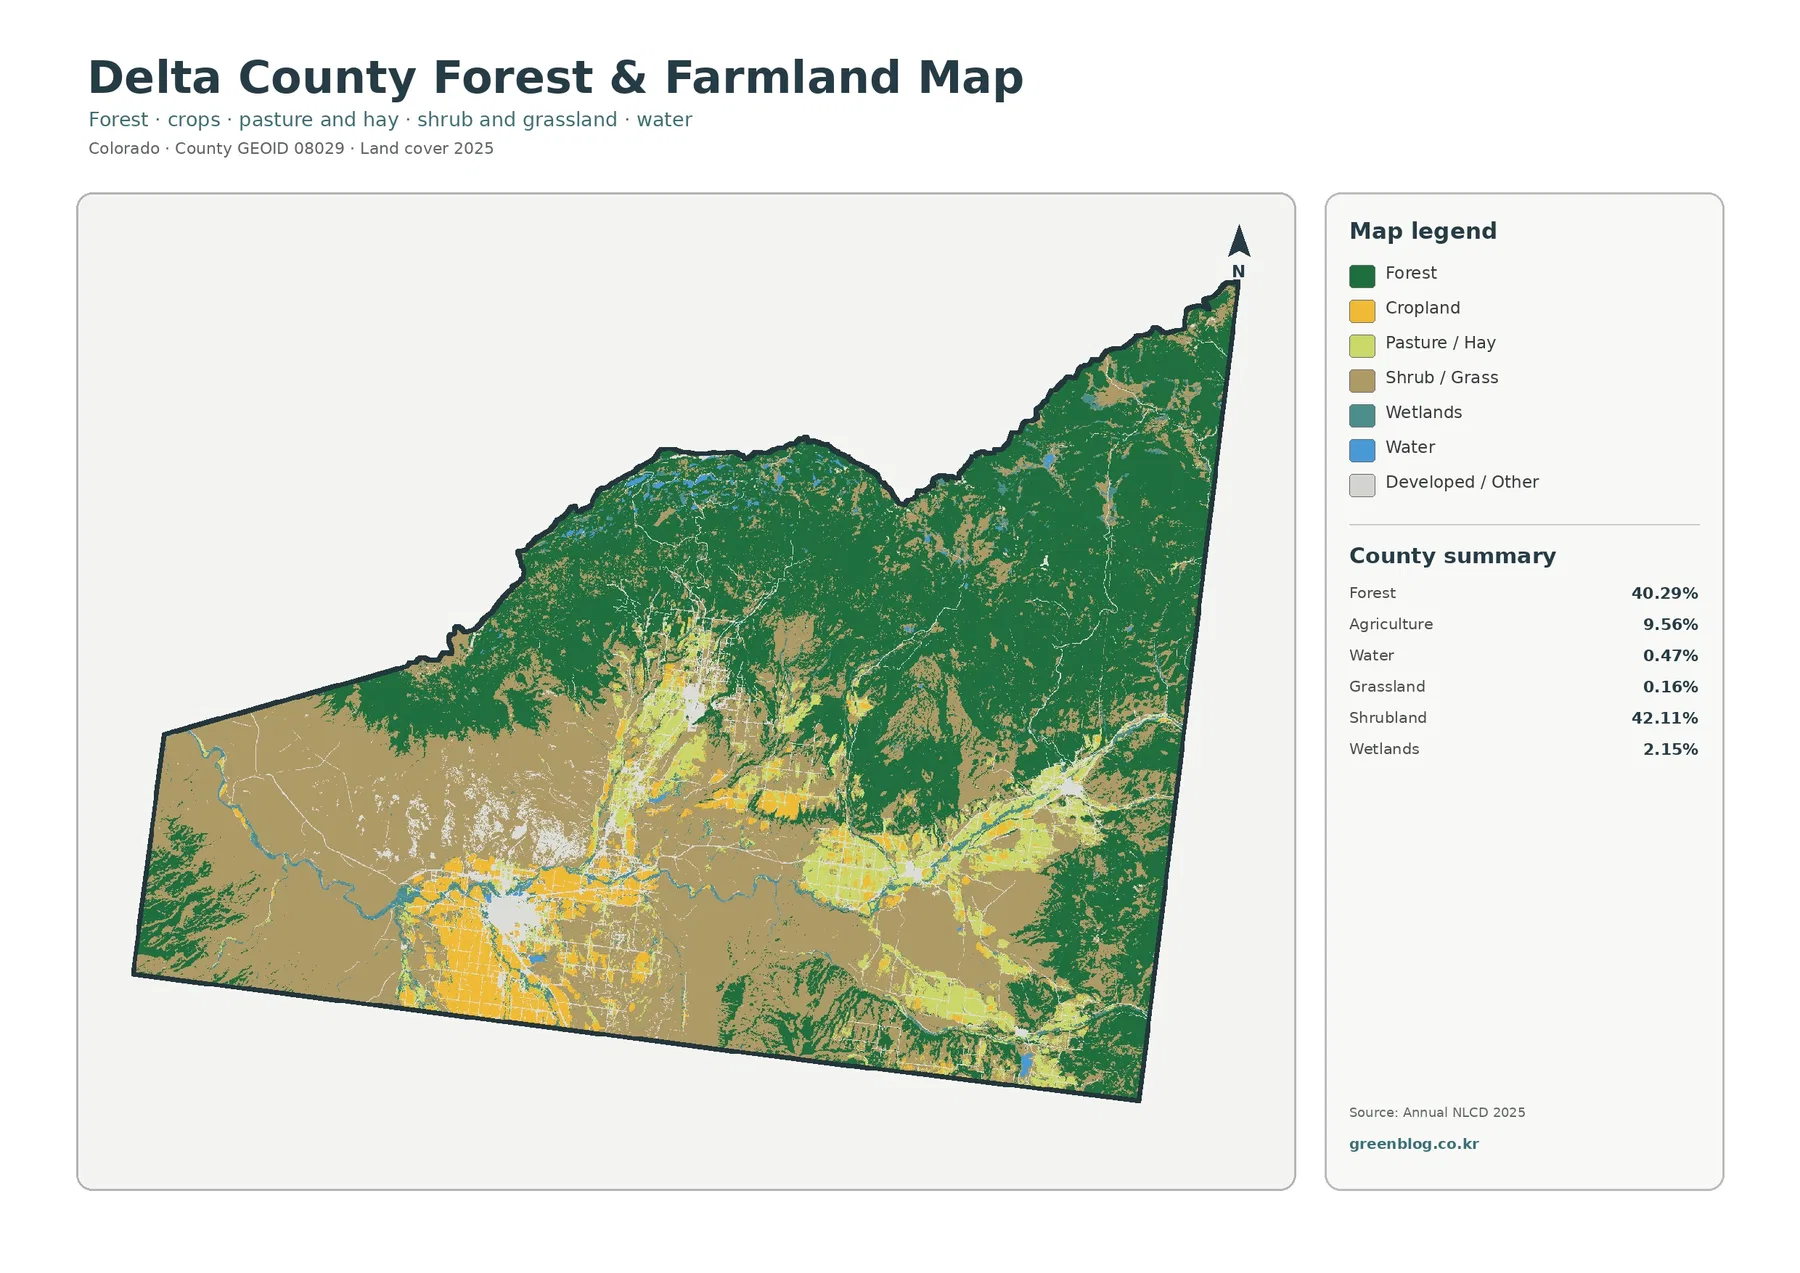
Removing several of the general land-cover categories makes the county’s farm pattern much easier to follow. Forest remains a large dark-green mass across the northern and northeastern uplands. Shrub and grass cover dominates wide open areas below and between those forests. Cropland and pasture or hay appear as brighter patches concentrated in valley settings, especially around the southwest and in the corridors leading toward the Surface Creek and North Fork communities.
The Delta area provides a useful example. The city sits where the Gunnison and Uncompahgre rivers meet, according to the county’s municipal information. On the forest-and-farmland map, agricultural blocks and developed or other cover are close to blue and teal water-related features. That proximity can be described directly, but the map alone does not prove why a specific field is located there or identify the source of its irrigation water.
North of Delta, the Surface Creek side of the county forms another transition. Cedaredge lies at the edge of Grand Mesa, and Orchard City occupies the rolling country between Delta, Cedaredge, and Hotchkiss. The map shows forest giving way to agricultural and open-cover colors across this part of the county. It is a particularly clear place to compare mountain vegetation with the more intensively used land below without assuming that every pale agricultural pixel represents the same crop or management practice.
The North Fork area adds a third pattern. Hotchkiss, Paonia, and Crawford are separated from the Delta core yet still sit within a landscape of agriculture, open cover, and forested uplands. Bright agricultural patches are embedded within larger natural-cover areas, which helps explain why the countywide agricultural share can be under ten percent while still being visually important in several local valleys.
This map should not be treated as a zoning map. “Cropland,” “pasture/hay,” and “forest” describe observed surface cover. A parcel can have a legal use or zoning designation that does not match the dominant cover class shown in a raster cell. Delta County’s Planning and Community Development department maintains land-use and zoning information separately, which is the appropriate source for regulatory questions.
Built surfaces remain concentrated in a few town and road networks
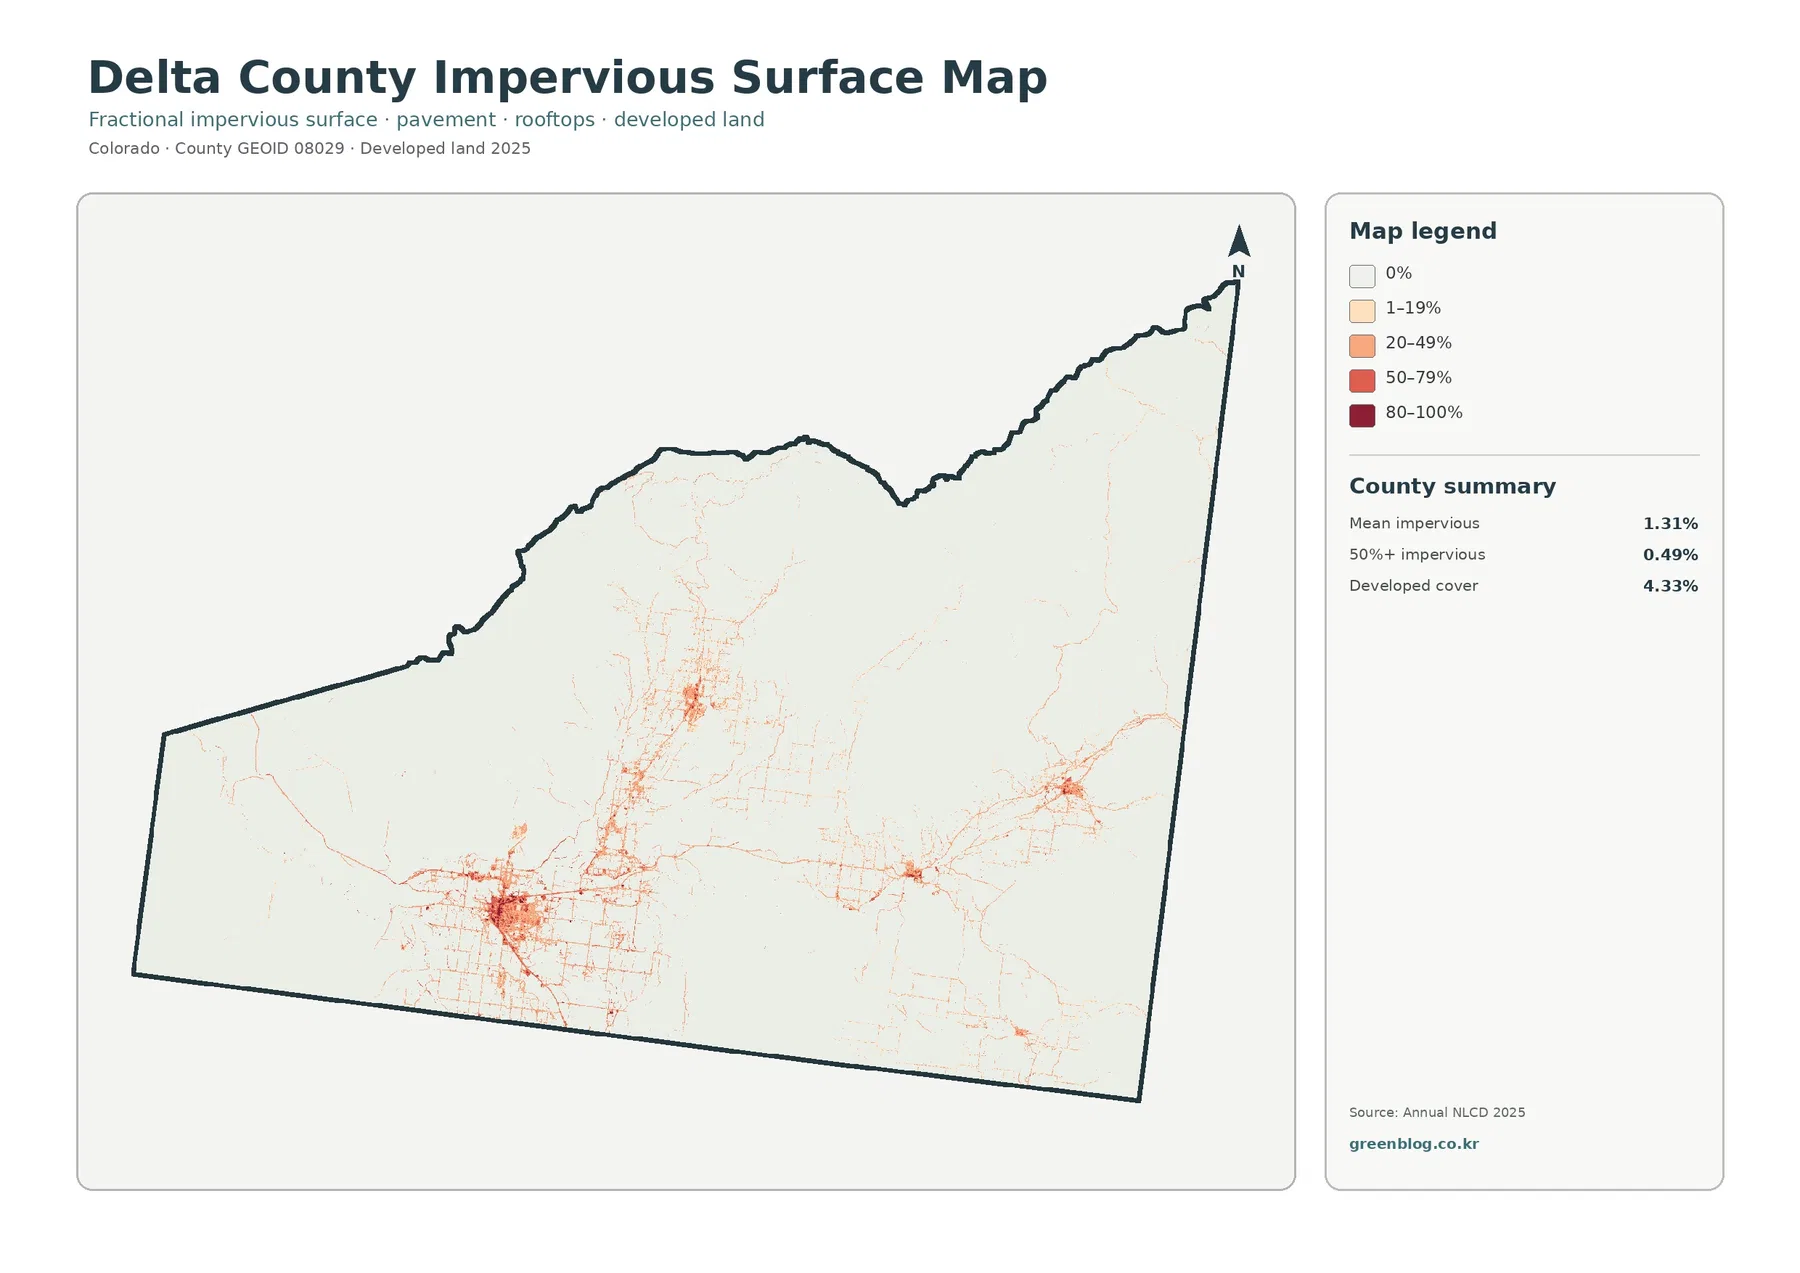
Impervious surface means hard cover such as pavement and rooftops where water does not readily soak into the ground. Delta County’s mean impervious value is 1.31%, and only 0.49% of the county is shown at 50% or greater imperviousness. Developed cover in the land-cover summary is 4.33%. Those values match the visual impression: most of the county stays very light, while stronger colors are confined to compact clusters and thin connecting lines.
The most prominent concentration is around Delta in the southwest. Smaller clusters appear farther north and east in the Surface Creek and North Fork areas. Linear traces connect several centers and resemble the road-and-settlement pattern, but a bright line should not be interpreted as the exact width of a paved road. The map reports the estimated fraction of impervious material within each raster cell, not a surveyed pavement boundary.
Comparing this view with the general land-cover map prevents a common misreading. A red developed class can appear visually strong even when it occupies a small portion of the county. The impervious map shows how quickly those built surfaces fade outside the principal community centers and road corridors. Forest, shrubland, agriculture, and other permeable surfaces remain dominant across most of the county outline.
This layer can be useful for watershed lessons, growth comparisons, or a presentation about where built surfaces are concentrated. It is not enough by itself to calculate storm runoff or flood risk. Elevation, soil, drainage infrastructure, rainfall, and channel conditions would also be needed for that type of analysis. The safest use here is to compare relative concentration rather than make engineering conclusions.
The 1985–2025 layer is a classification comparison, not a list of confirmed causes
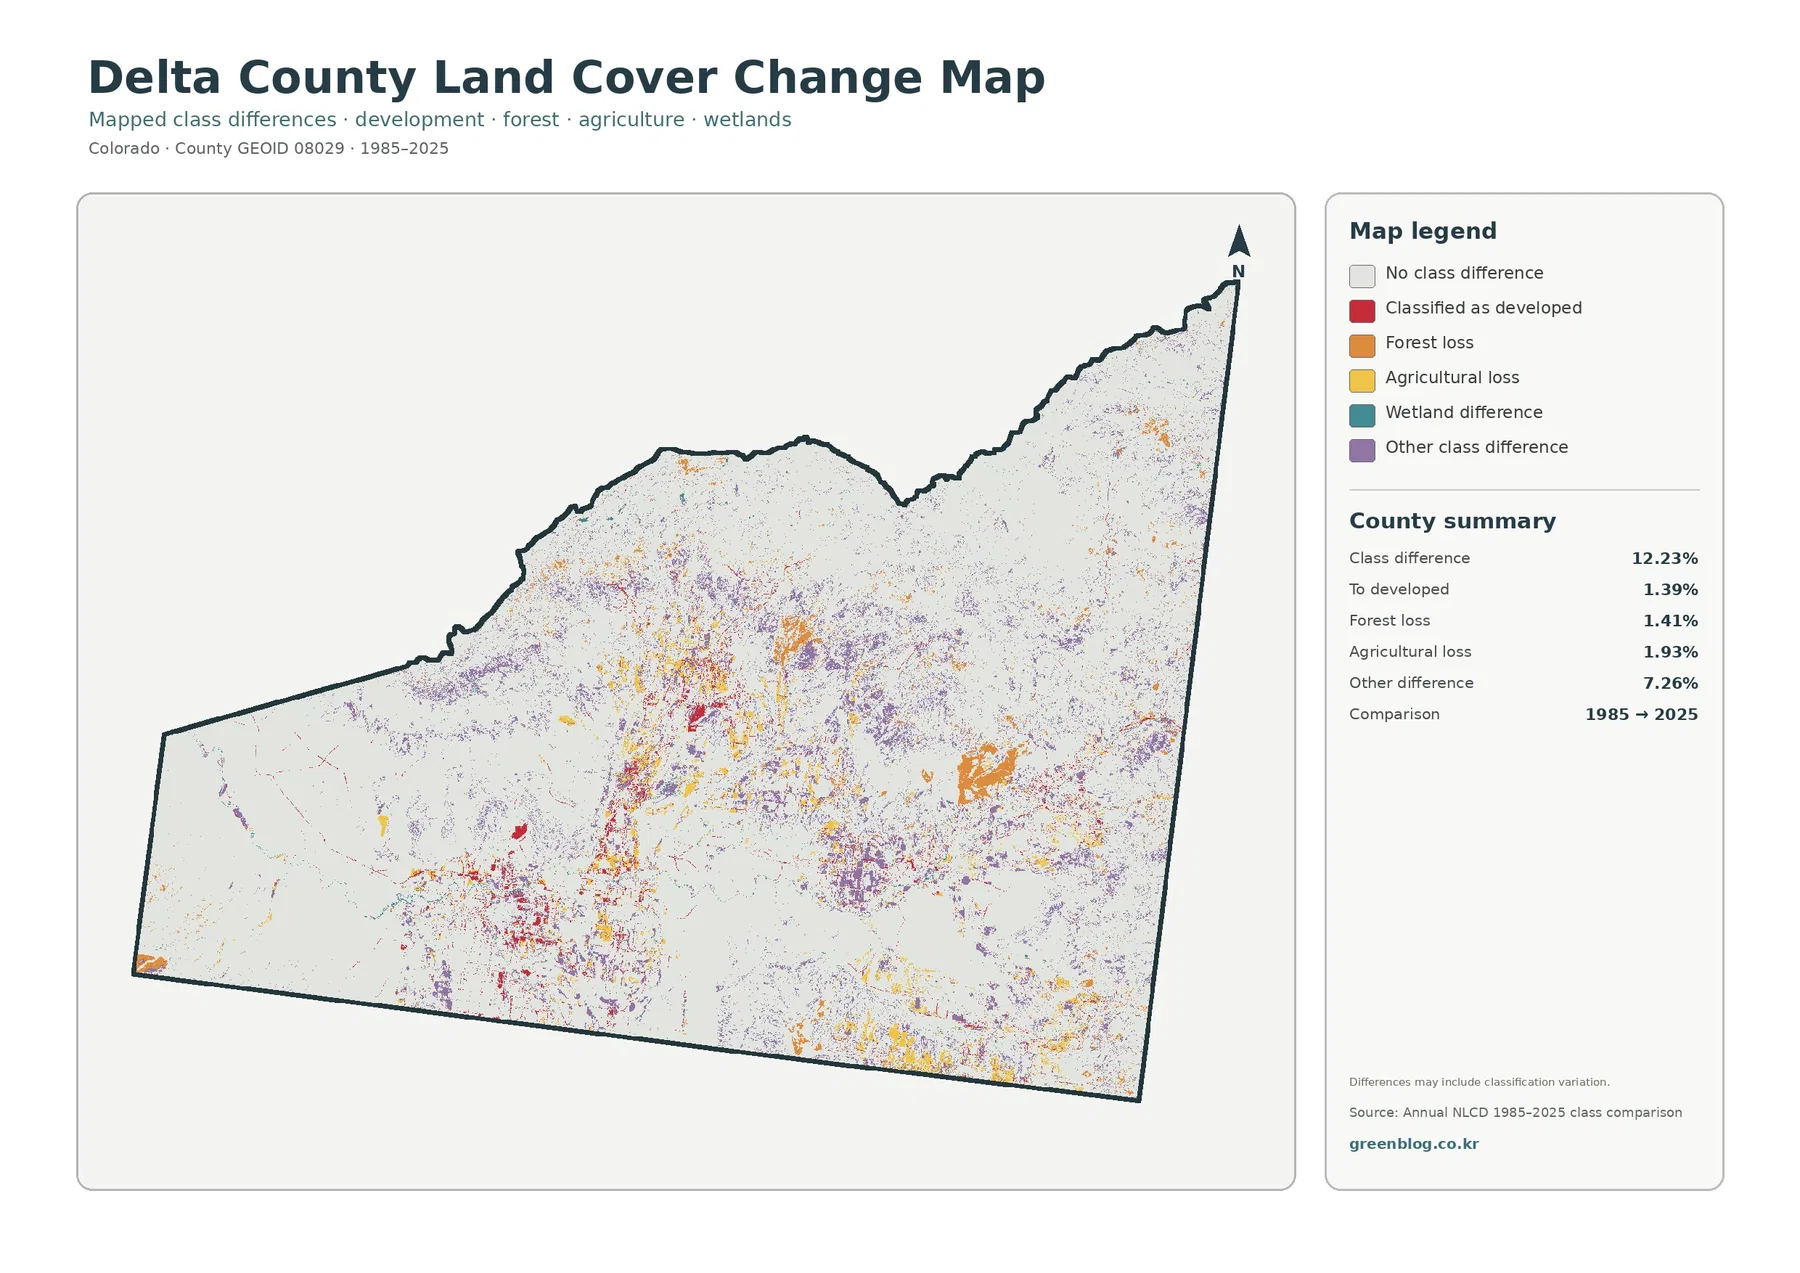
The long-term comparison marks 12.23% of the county as having a class difference between 1985 and 2025. Change to developed accounts for 1.39%, forest loss for 1.41%, agricultural loss for 1.93%, and other differences for 7.26%. The large “other difference” category is important. It means the image should not be summarized as though all colored areas were caused by development, forest clearing, or agricultural conversion.
Red change-to-developed cells are easiest to see near Delta and along parts of the developed network. Yellow agricultural-loss cells appear in and around agricultural zones, while orange forest-loss patches are scattered through portions of the currently forested uplands. Purple other-difference cells are more widespread and create a much broader texture across the county. The different categories do not form one simple east-to-west or north-to-south trend.
The map itself notes that differences can include classification variation. A forest edge may shift between forest and shrub classes, or a narrow wetland may be represented differently in two observation periods. Mixed pixels are especially relevant along small fields, riparian strips, roads, and transitions between vegetation types. For that reason, a single colored cell should not be described as a confirmed wildfire, subdivision, farm abandonment, or other event unless another source verifies it.
A better way to use the change map is to identify larger or repeated patterns for follow-up. A cluster of red cells near a community can be checked against historic imagery. A larger orange patch in the uplands can be investigated with forest or fire records. Agricultural changes can be compared with annual imagery or local agricultural information. The map narrows the search area, while the explanation of cause comes from additional evidence.
Following Delta, Surface Creek, and North Fork through all four maps
The southwest Delta area is a good first comparison because all four themes are present in a compact space. Current land cover shows agriculture, development, shrub cover, and water-related features close together. The forest-and-farmland map separates the farm blocks more clearly. The impervious layer isolates the strongest built-surface cluster in the county, and the change layer adds red and yellow differences around parts of the same landscape.
Surface Creek tells a different story. The area below Grand Mesa sits near a strong transition from extensive forest to agriculture and settlement. Current cover is visually complex there because several classes meet in a short distance. The simplified forest-and-farmland view makes that transition easier to interpret, while the impervious map identifies the smaller developed centers within it. The change map then shows that historical class differences do not match the current forest-farm boundary perfectly.
In the North Fork area, agriculture and town footprints are embedded within broader natural cover. Hotchkiss, Paonia, and Crawford can be considered as separate local centers rather than one continuous developed strip. The current maps show farm and open-cover areas between forested uplands, and the change layer contains several categories at once. That combination makes the North Fork a useful example of why a single countywide percentage cannot describe every part of Delta County.
Comparing the same places also helps separate present condition from historical change. A location can be forested in 2025 and still contain some mapped forest-loss or other-difference cells in the 1985–2025 comparison. Likewise, an agricultural valley can remain strongly agricultural today while showing some agricultural-loss cells. “Current cover” and “changed class” are different measurements and should not be substituted for one another.
Which map is most useful for your project?
Use the general land-cover map when the goal is to introduce the county as a whole. It keeps forest, shrubland, agriculture, developed cover, wetlands, water, and smaller classes in one view. This makes it well suited to a county profile, classroom overview, or presentation slide that needs to show the contrast between Grand Mesa and other forested uplands, broad shrub country, and irrigated valleys.
Choose the forest-and-farmland map when agriculture or vegetation is the main subject. Its simplified legend makes farm concentrations easier to compare with forest and shrub or grass cover. For a project focused on towns, roads, or built surfaces, the impervious map is more direct because it shows the intensity of hard cover rather than treating all developed land as one class.
The change map is the appropriate choice for a 1985–2025 comparison, but it needs the most careful captioning. It reports class differences and does not supply causes. In a report or class project, a useful approach is to pair the change view with one current map so the reader can see both what covers the ground now and where classifications differ from the earlier period.
Because all four JPGs use the same county boundary, they can be placed side by side in a slide or printed as a small set. A project does not need to use every file. Selecting one or two maps that answer the specific question usually produces a clearer result than placing all four on a page without explanation.
Scale, date, and the difference between land cover and land use
The current maps in this package are labeled 2025, and the change map compares 1985 with 2025. Conditions after the observation period may not appear. New construction, a vegetation shift, a field conversion, a fire, or a water-level change can occur after the mapped date. If a decision depends on current field conditions, recent imagery and local records should be checked as well.
Raster classification also generalizes boundaries. Each cell is assigned a category or an impervious estimate, even though several real surfaces may fall inside it. This creates mixed pixels around narrow streams, small buildings, field margins, and transitions between forest and shrubland. The downloadable JPGs are useful for countywide reference and visual comparison, but they are not parcel surveys, wetland delineations, or engineering plans.
Finally, land cover should be kept separate from zoning and legal land use. A green forest cell describes surface cover, not ownership or development restrictions. An agricultural class does not guarantee agricultural zoning, and a developed class does not establish a building permit or municipal boundary. Delta County’s Planning and Community Development resources provide the regulatory information needed for those questions.
Frequently Asked Questions
What is the largest 2025 land-cover class in Delta County?
Shrubland is the largest reported class at 42.11%, with forest very close at 40.29%. The map therefore shows two broad natural-cover systems at nearly equal countywide scale, while agriculture at 9.56% is concentrated in several valleys rather than spread evenly across the county.
Where are built surfaces most concentrated?
The strongest impervious cluster is around Delta in the southwest, with smaller concentrations in the Surface Creek and North Fork community areas. Mean imperviousness is 1.31% and developed cover is 4.33%, so built surfaces remain limited at county scale.
Does the 1985–2025 change map prove why a land-cover class changed?
No. It identifies cells whose mapped classifications differ between the two periods, and the map notes that classification variation can be included. A suspected cause such as development, fire, forest treatment, or farm conversion should be verified with additional imagery or local records.
Map File Information
The download contains the four original JPG land-cover maps for Delta County in one ZIP archive.
- Included Files: Use only the versions confirmed in the article and supplied images
- File Type: Use the confirmed download contents
- Intended Use: Printing, education, presentations, and map-based projects
Related Maps
- Adams County Colorado Land Cover Map
- Alamosa County Colorado Land Cover Map
- Arapahoe County Colorado Land Cover Map
Sources and References
- MRLC Annual NLCD Data – official access to Annual NLCD land-cover products.
- USGS Annual NLCD Land Cover Classification – descriptions of the land-cover classes used by Annual NLCD.
- Delta County Locations & Communities – official county context for Grand Mesa and the communities of Delta, Cedaredge, Crawford, Hotchkiss, Orchard City, and Paonia.
- Delta County Innovation and Agriculture – local background on irrigated valleys, orchards, and specialty crops.
- Delta County Recreation and Trails Master Plan – official geographic context for Grand Mesa, river valleys, badlands, canyons, irrigated farmland, and the West Elk Mountains.
- Delta County Planning and Community Development – official land-use and zoning resources that should be distinguished from land-cover classification.
Green Map creates custom-edited map images using open geographic data sources such as geoBoundaries, Natural Earth, OpenStreetMap, and government open data.
These maps are edited visual materials, not raw data files, and are provided for education, documents, presentations, and graphic reference.