Murray County sits in northwest Georgia where a comparatively lower western corridor gives way to rugged mountain terrain on the east. Chatsworth, the county seat, and Eton line up along Route 411, while the eastern half is cut by ridges, hollows, creeks, and several small lakes. The four maps on this page separate those features so they are easier to compare: county boundaries and roads, the two principal city markers, waterways, and elevation. High-resolution A3 JPG versions of all four maps can be downloaded together in one ZIP file from the map file box below.
The county is especially useful to read as a west-to-east contrast. Around Chatsworth and Eton, roads and settlement are concentrated on gentler ground. Moving east, the surface becomes much more broken, watercourses multiply, and elevation rises sharply into the mountain belt. The water map and elevation map explain why the ordinary county map looks so different from one side to the other: roads become more winding, streams occupy narrow valleys, and the largest city symbols remain outside the highest ridges.
Table of Contents
A Road Corridor on the West, Mountain Ridges on the East
The general county map places Chatsworth slightly west of center and Eton a short distance to the north. Route 411 runs through both places and forms the clearest north-south transportation line on the map. Chatsworth has the larger developed footprint and the courthouse marker, so it reads immediately as the county’s administrative and transportation center. Eton forms a second, smaller node farther north, with Route 286 extending west and other numbered routes continuing toward the northern county line.
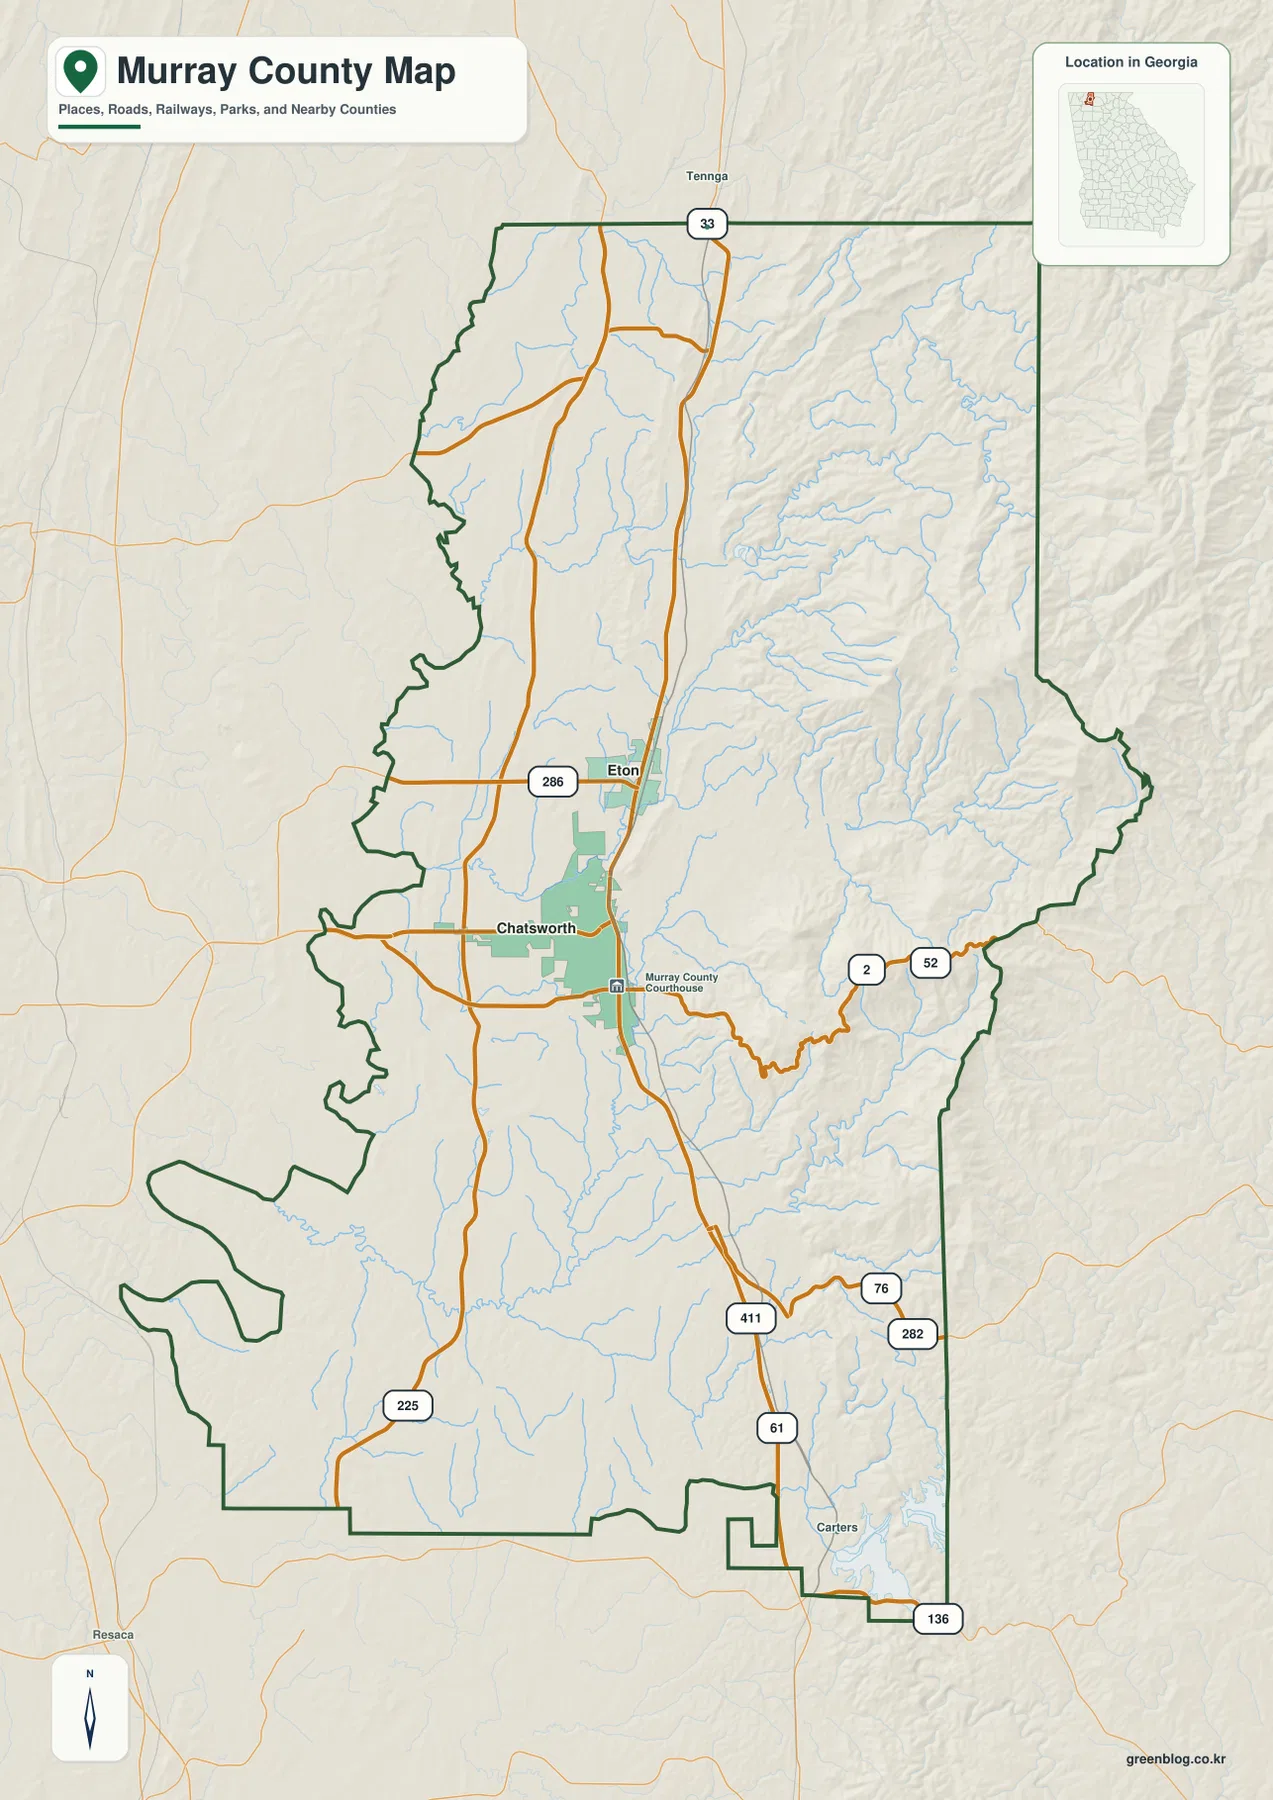
Several other route numbers show how travel changes as it approaches the mountains. Routes 2 and 52 leave the Chatsworth area toward the east, while 76 and 282 bend through the southeast. Route 225 appears in the southwest, Route 61 continues south, and Route 33 is shown near the northern edge. The western lines are generally straighter than the eastern ones. That difference is not just a drawing choice; it matches the terrain shown beneath the road network, where the eastern side is visibly steeper and more deeply dissected.
The county outline also helps orient Murray County within the region. Whitfield County lies to the west, Gordon County is along the southwest side, and Gilmer and Fannin counties appear to the east. The far north approaches the Tennessee state line. Those relationships explain why Chatsworth is a practical reference point: it lies between the lower western side of the county and the mountain routes that continue eastward, while still connecting north and south through the central road corridor.
Two City Anchors in a County with a Large Rural Interior
The city distribution map simplifies the county to its two ranked major city markers: Chatsworth and Eton. Both are clustered in the west-central part of the county rather than spread evenly from border to border. This is one of the most useful differences between the city map and the general county map. With most route numbers and secondary details removed, the settlement pattern becomes obvious: the main city centers occupy the gentler corridor, while the broad eastern mountain area has no comparable city marker.
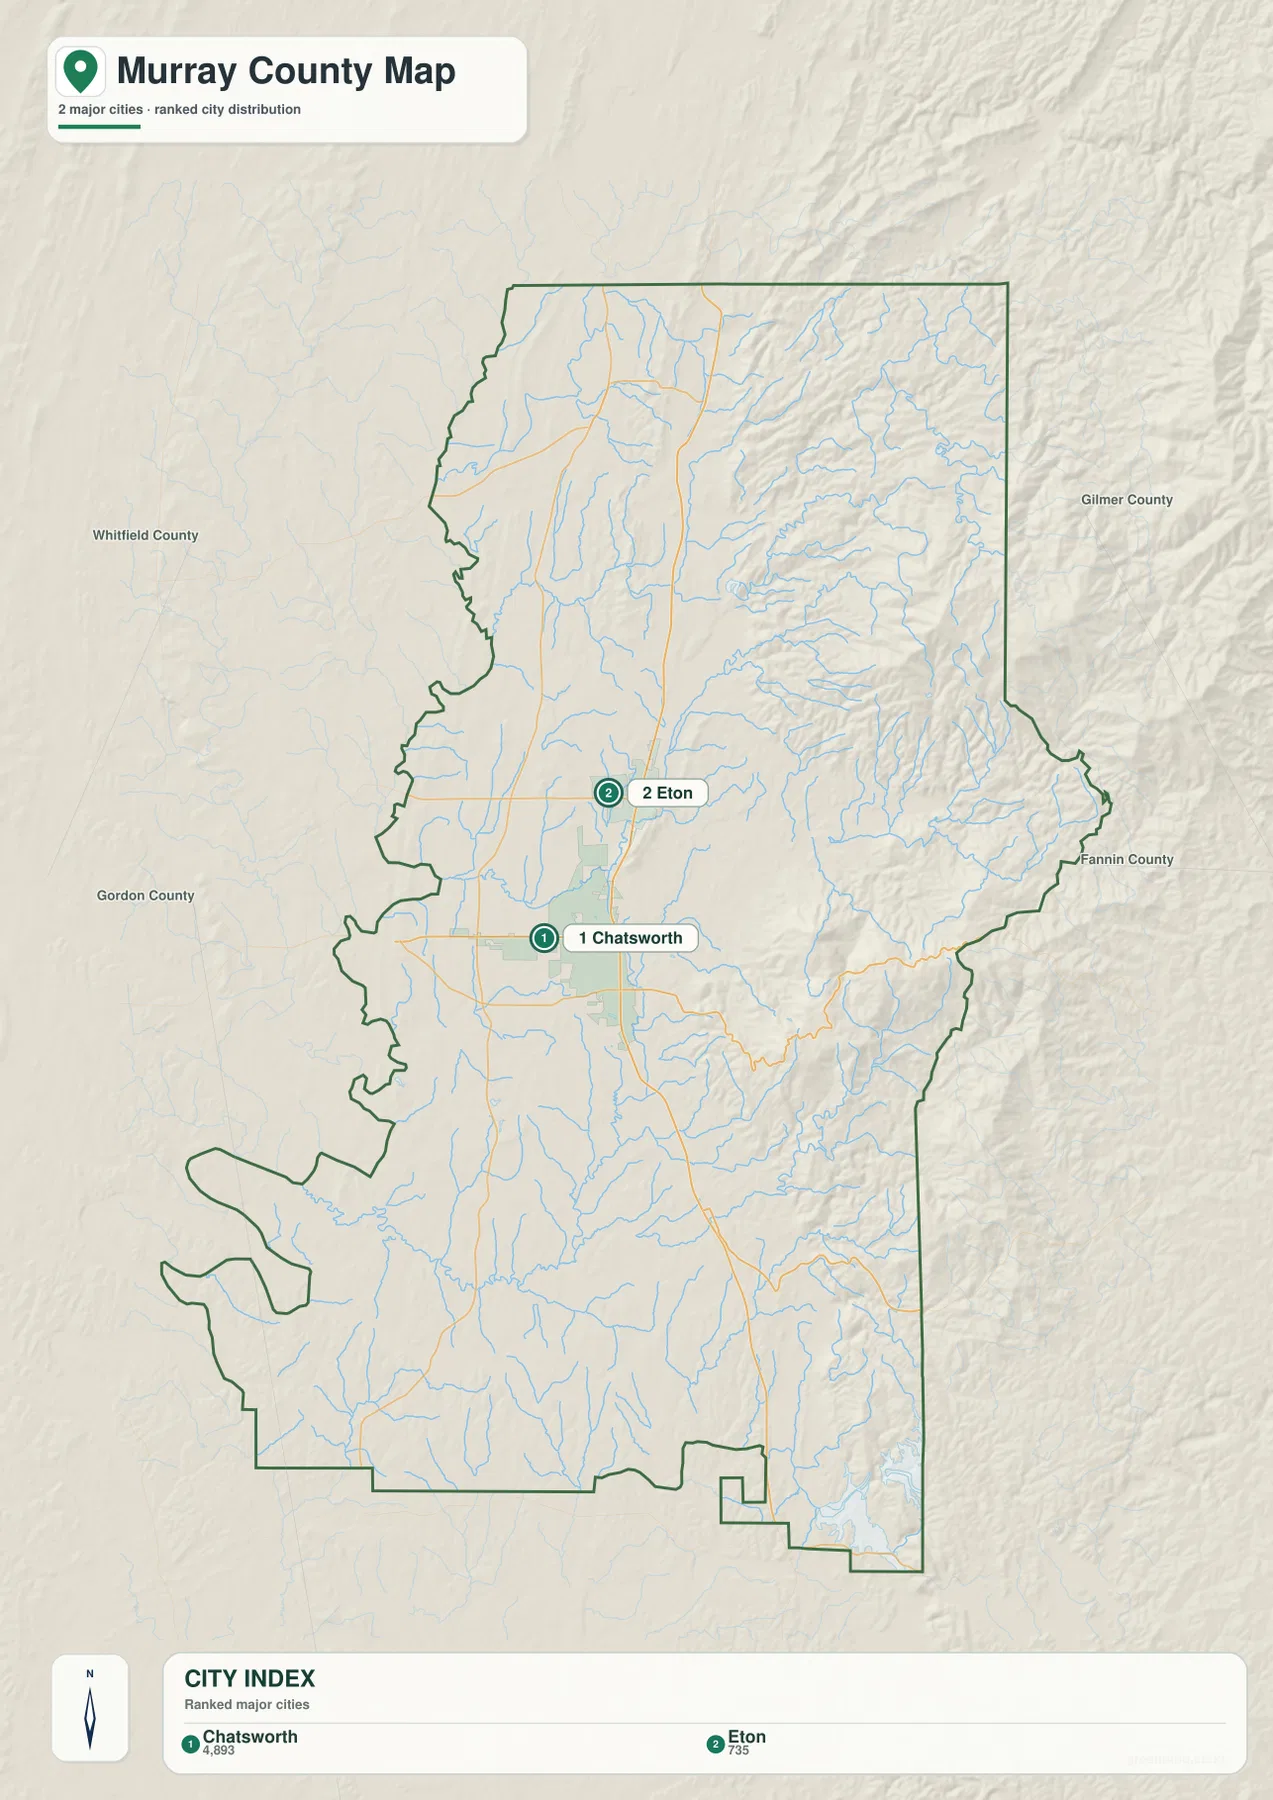
Chatsworth is the county seat and the larger of the two urban footprints shown on the maps. Eton sits north of it on the same general corridor. Around them, the city map labels neighboring Whitfield, Gordon, Gilmer, and Fannin counties, making the regional orientation easier to understand without adding a dense road network. This map is therefore best used to explain where the principal city centers are, not to locate every community, local road, address, or parcel in Murray County.
The absence of additional major city markers is itself informative. Murray County covers a long north-south area, but its main settlement pattern is not evenly distributed across that space. The high eastern ridges, the many creeks, and the mountain lakes occupy a large portion of the county’s visual geography. When the city map is compared with the elevation map, the reason for the west-central concentration becomes much easier to see.
Waterways Between the Conasauga and Coosawattee Systems
The water map reveals a much denser network than the ordinary county map. The Conasauga River follows the northeastern side of the county, while the Coosawattee River is labeled along the southern edge. Between them are numerous tributaries, including Mill Creek, Holly Creek, Rock Creek, Sumac Creek, Perry Creek, and other smaller branches. The result is a landscape where water is organized by many narrow valleys rather than by one single river crossing the center of the county.
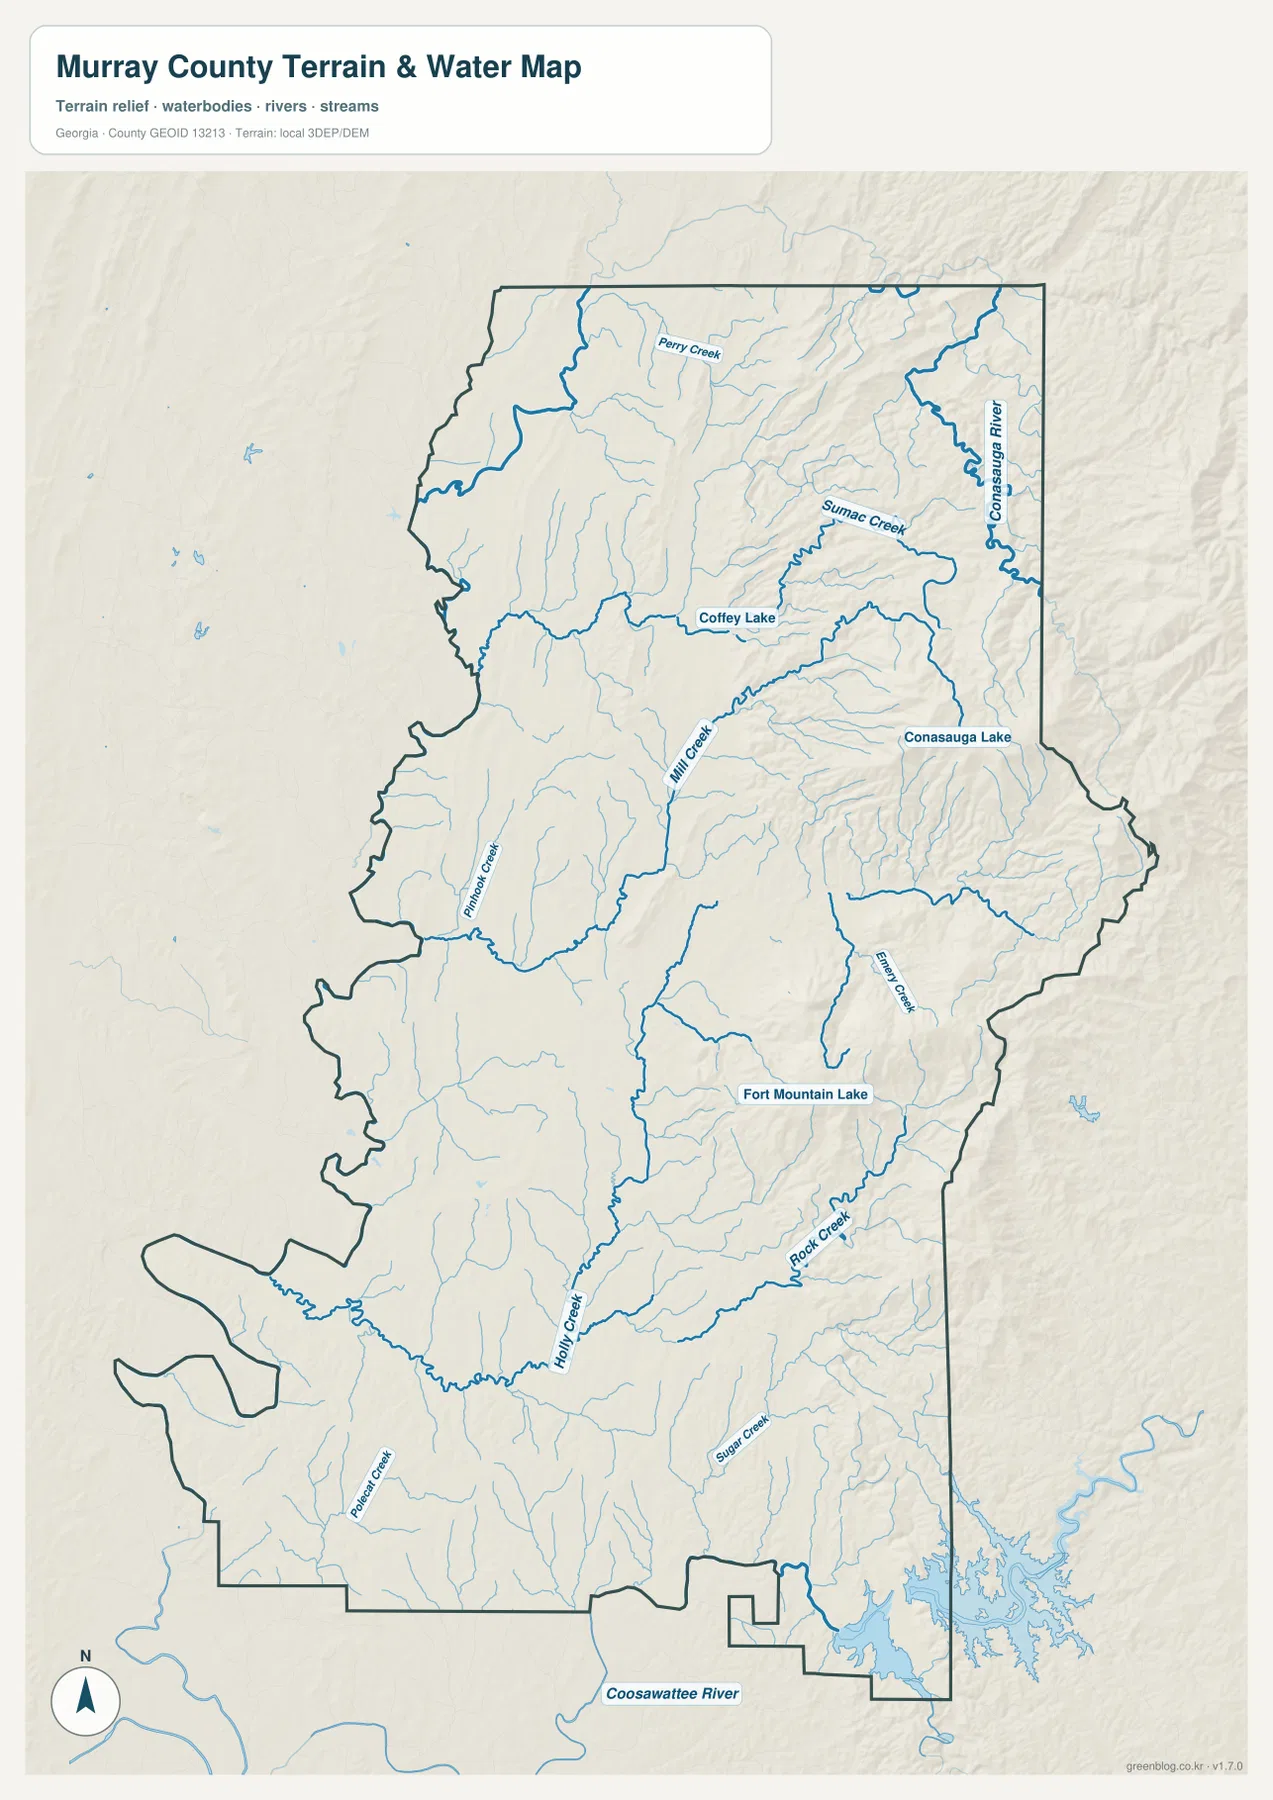
Several lakes provide additional landmarks. Conasauga Lake is shown in the northeastern mountain area, Fort Mountain Lake lies farther south in the eastern interior, and Coffey Lake appears closer to the north-central part of the county. These water bodies are small compared with the full county area, but their positions help connect named places to the relief around them. Fort Mountain Lake, for example, sits amid a cluster of ridges and creeks that becomes much more understandable when the elevation map is viewed beside the water map.
This is a reference map for the location of rivers, creeks, and lakes. It should not be treated as a flood map, navigation chart, parcel map, or legal water-boundary survey. Its value is geographic: it shows where the named water features lie and how tributaries branch through the county. The contrast between the relatively open western drainage lines and the tighter eastern valleys mirrors the county’s elevation pattern.
The Eastern Half Rises Far Above the Western Corridor
The elevation map gives the strongest visual explanation of Murray County’s geography. Its legend shows an actual elevation range of about 192 to 1,218 meters, with a mean near 332 meters. Most of the western side appears in lower green tones, while the eastern and northeastern ridges climb through lighter colors into brown at the highest terrain. Shaded relief makes the slopes, ridgelines, and narrow valleys visible even before the legend is read.
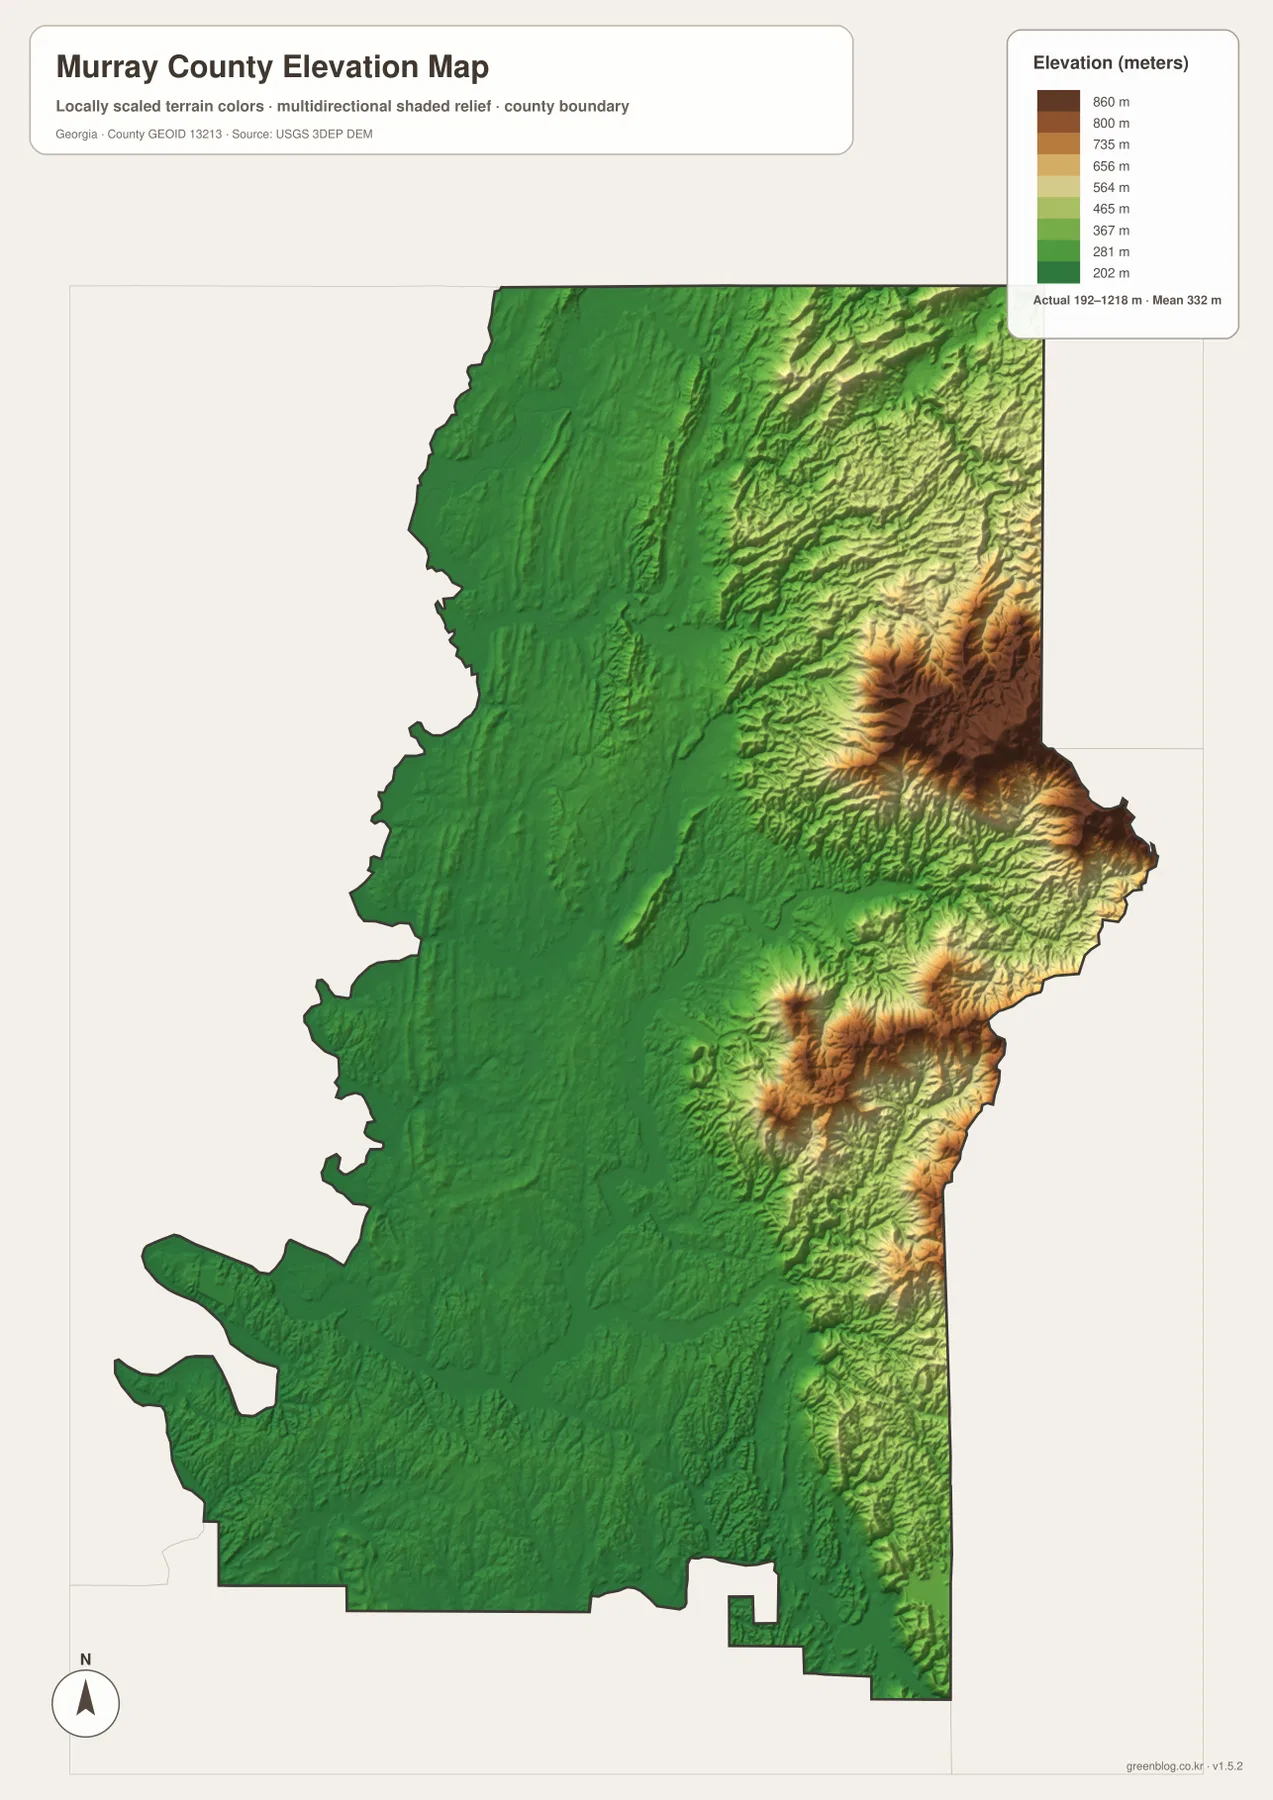
Chatsworth and Eton occupy comparatively lower terrain west of the steepest relief. East of them, the surface rises rapidly into a series of ridges cut by creeks. That transition helps explain why the roads heading east from Chatsworth bend more than the main north-south corridor and why the eastern water network is so intricate. The maps do not prove a specific engineering constraint at any point, but they clearly show the broad relationship among settlement, roads, drainage, and elevation.
The elevation surface is generalized for county-scale reference and should not be used as survey-grade measurement. A construction site, trail segment, or property corner may differ from what can be inferred at this scale. For general orientation, however, the map makes one fact unmistakable: Murray County is not a uniformly rolling county. It contains a lower western corridor and a distinctly mountainous eastern sector with far greater vertical relief.
Reading the Four Maps as One Geographic Story
Each map answers a different part of the same question. The county map is the fastest way to orient the boundary, roads, Chatsworth, and Eton. The city map strips away most detail and emphasizes how strongly the two main city centers are concentrated in the west-central corridor. The water map fills the county with named creeks and rivers, revealing how thoroughly the mountain valleys shape drainage. The elevation map then explains the underlying contrast by showing how abruptly the eastern half rises above the west.
Fort Mountain Lake is a good example of why comparing maps matters. On the water map it is a named lake within the eastern interior. On the elevation map the surrounding area sits among pronounced ridges and valleys. On the county map the nearest eastward roads are visibly more winding than the Route 411 corridor. None of those maps alone tells the whole story, but together they describe a mountain setting where roads and water are strongly influenced by relief.
Chatsworth provides the opposite example. It is prominent on the county map, ranked first on the city map, located outside the highest terrain on the elevation map, and surrounded by a drainage network that is less compressed than the streams farther east. Eton shows a similar relationship to the landscape. These connections are more useful than a generic list of map types because they tie each map directly to places the visitor can see.
Choosing the Map That Fits the Question
- Boundary and road orientation: use the county map to locate Chatsworth, Eton, Route 411, and the routes entering the mountain side.
- City distribution: use the city map when the main question is where the two principal city centers sit within the county.
- Rivers, creeks, and lakes: use the water map for the Conasauga River, Coosawattee River, Mill Creek, Holly Creek, Fort Mountain Lake, and other named waters.
- Mountain relief: use the elevation map to compare the low western corridor with the high eastern ridges.
The WebP maps in the article are intended for quick on-page viewing. For printing or keeping the maps locally, the download archive contains four original high-resolution A3 JPG files: one county map, one city map, one water map, and one elevation map. Keeping the four files together also makes it easy to compare the same area without switching between unrelated map products.
Frequently Asked Questions
Which map is best for understanding the Fort Mountain area?
Start with the water map to locate Fort Mountain Lake and nearby creeks, then compare it with the elevation map. The eastern part of Murray County has the county’s highest and most rugged terrain, so the elevation layer explains why the drainage lines around the lake are closely tied to narrow valleys and ridges.
Why does the city map emphasize only Chatsworth and Eton?
The supplied city map is designed to compare the county’s ranked major city markers rather than every community. Chatsworth and Eton are the two highlighted cities, both in the west-central corridor. Smaller communities, local roads, addresses, and parcels require a more detailed local map.
What is the main elevation pattern in Murray County?
The western side is generally lower and smoother, while the eastern and northeastern side rises into steep mountain ridges. The supplied elevation map shows an actual range of about 192 to 1,218 meters and a mean near 332 meters. That difference is closely reflected in the road shapes, city concentration, and dense eastern stream network.
Map File Information
The download includes four high-resolution A3 JPG maps of Murray County covering the county boundary, city distribution, waterways, and elevation.
- File Type: One ZIP containing four A3 JPG files
Related Maps
Sources and References
- U.S. Census Bureau QuickFacts for Murray County
- New Georgia Encyclopedia: Murray County
- U.S. Census Bureau TIGER/Line Shapefiles
- USGS National Hydrography
- USGS 3D Elevation Program
Green Map creates custom-edited map images using open geographic data sources such as geoBoundaries, Natural Earth, OpenStreetMap, and government open data. These maps are edited visual materials, not raw data files, and are provided for education, documents, presentations, and graphic reference.